ডাবল রিভার্সাল ট্রেন্ড অনুসরণ কৌশল

ওভারভিউ
এটি একটি ট্রেন্ড ট্র্যাকিং কৌশল যা ডাবল বিপরীত সিগন্যালের সাথে মিলিত। এটি 123 বিপরীত কৌশল এবং পারফরম্যান্স সূচক কৌশলকে একত্রিত করে, দামের বিপরীত পয়েন্টগুলি ট্র্যাক করে, আরও নির্ভরযোগ্য প্রবণতা বিচার করে।
কৌশল নীতি
এই কৌশল দুটি উপ-কৌশল নিয়ে গঠিতঃ
-
123 বিপরীতমুখী কৌশল
১৪ দিনের K-লাইন ব্যবহার করে বিপরীত সিগন্যাল বিচার করুন। নির্দিষ্ট নিয়ম হলঃ
- একাধিক শীর্ষ সংকেতঃ প্রথম দুই দিন বন্ধের দাম কমেছে, বর্তমান কে লাইন বন্ধের দাম আগের দিনের বন্ধের দামের চেয়ে বেশি, 9 তারিখে স্টোক্যাস্টিক স্লো 50 এর নিচে
- খালি মাথা সংকেতঃ প্রথম দুই দিন বন্ধের দাম বেড়েছে, বর্তমান কে লাইন বন্ধের দাম আগের দিনের বন্ধের দামের চেয়ে কম, 9 তারিখে স্টোক্যাস্টিক ফাস্ট 50 এর উপরে
-
পারফরম্যান্স সূচক কৌশল
গত ১৪ দিনের পতন ও পতনকে একটি সূচক হিসেবে গণনা করা হয়।
- পারফরম্যান্স সূচক> ((0)), মাল্টিহেড সংকেত উত্পন্ন করে
- পারফরম্যান্স সূচক < ((0)), একটি খালি মাথা সংকেত উত্পন্ন
চূড়ান্ত সংকেত হল দুই ধরনের সংকেতের সমন্বয়। অর্থাৎ, একই দিকের মাল্টি-হোয়ার সংকেত প্রয়োজন যা প্রকৃত ক্রয়-বিক্রয় ক্রিয়াকলাপ তৈরি করতে পারে।
এটি কিছু শব্দকে ফিল্টার করে এবং সংকেতকে আরো নির্ভরযোগ্য করে তোলে।
কৌশলগত সুবিধা
এই দ্বৈত-বিপরীতমুখী পদ্ধতির সুবিধাগুলি হলঃ
- সিগন্যালের নির্ভরযোগ্যতা বাড়ানোর জন্য ডাবল ফ্যাক্টর
- বাজারের শব্দকে কার্যকরভাবে ফিল্টার করুন এবং ভুল সংকেত এড়িয়ে চলুন
- 123 ফর্ম্যাটটি ক্লাসিক এবং ব্যবহারিক, সহজেই বিচার করা এবং পুনরুত্পাদন করা যায়
- পারফরম্যান্স ইনডেক্স ভবিষ্যতের প্রবণতা নির্ধারণ করতে পারে
- প্যারামিটার সমন্বয় নমনীয় এবং আরও অপ্টিমাইজযোগ্য
কৌশলগত ঝুঁকি
এই কৌশলটির কিছু ঝুঁকিও রয়েছেঃ
- এই প্রবণতাকে পুরোপুরি ধরতে না পারলে হঠাৎ বিপর্যয় ঘটতে পারে
- দ্বৈত অবস্থার সংমিশ্রণ সংকেত হ্রাস করে এবং লাভজনকতা প্রভাবিত করতে পারে
- সম-পর্যায়ে বিচার প্রয়োজন এবং স্বতন্ত্র শেয়ারের অস্থিরতার জন্য সংবেদনশীল
- প্যারামিটার সেটিং সমস্যা হতে পারে
নিম্নলিখিত দিকগুলি বিবেচনা করা যেতে পারেঃ
- K-লাইন দৈর্ঘ্য, স্টোক্যাস্টিক চক্র ইত্যাদি প্যারামিটারগুলি সামঞ্জস্য করুন
- ডাবল সিগন্যালের বিচার লজিক অপ্টিমাইজ করুন
- এবং আরও অনেক কিছু, যেমন প্রসবের সংখ্যা
- ক্ষতিপূরণ বাড়ানো
সারসংক্ষেপ
এই কৌশলটি ডাবল রিভার্সাল বিচারকে সংহত করে এবং কার্যকরভাবে মূল্যের বিপরীত দিকগুলি সনাক্ত করতে পারে। যদিও সংকেতটি ঘটার সম্ভাবনা হ্রাস পেয়েছে, তবে এটি উচ্চ নির্ভরযোগ্যতা রয়েছে, যা মধ্য-দীর্ঘ লাইন প্রবণতা ধরার জন্য উপযুক্ত। প্যারামিটার সমন্বয় এবং বহু-ফ্যাক্টর অপ্টিমাইজেশনের মাধ্যমে কৌশলটির কার্যকারিতা আরও বাড়ানো যেতে পারে।
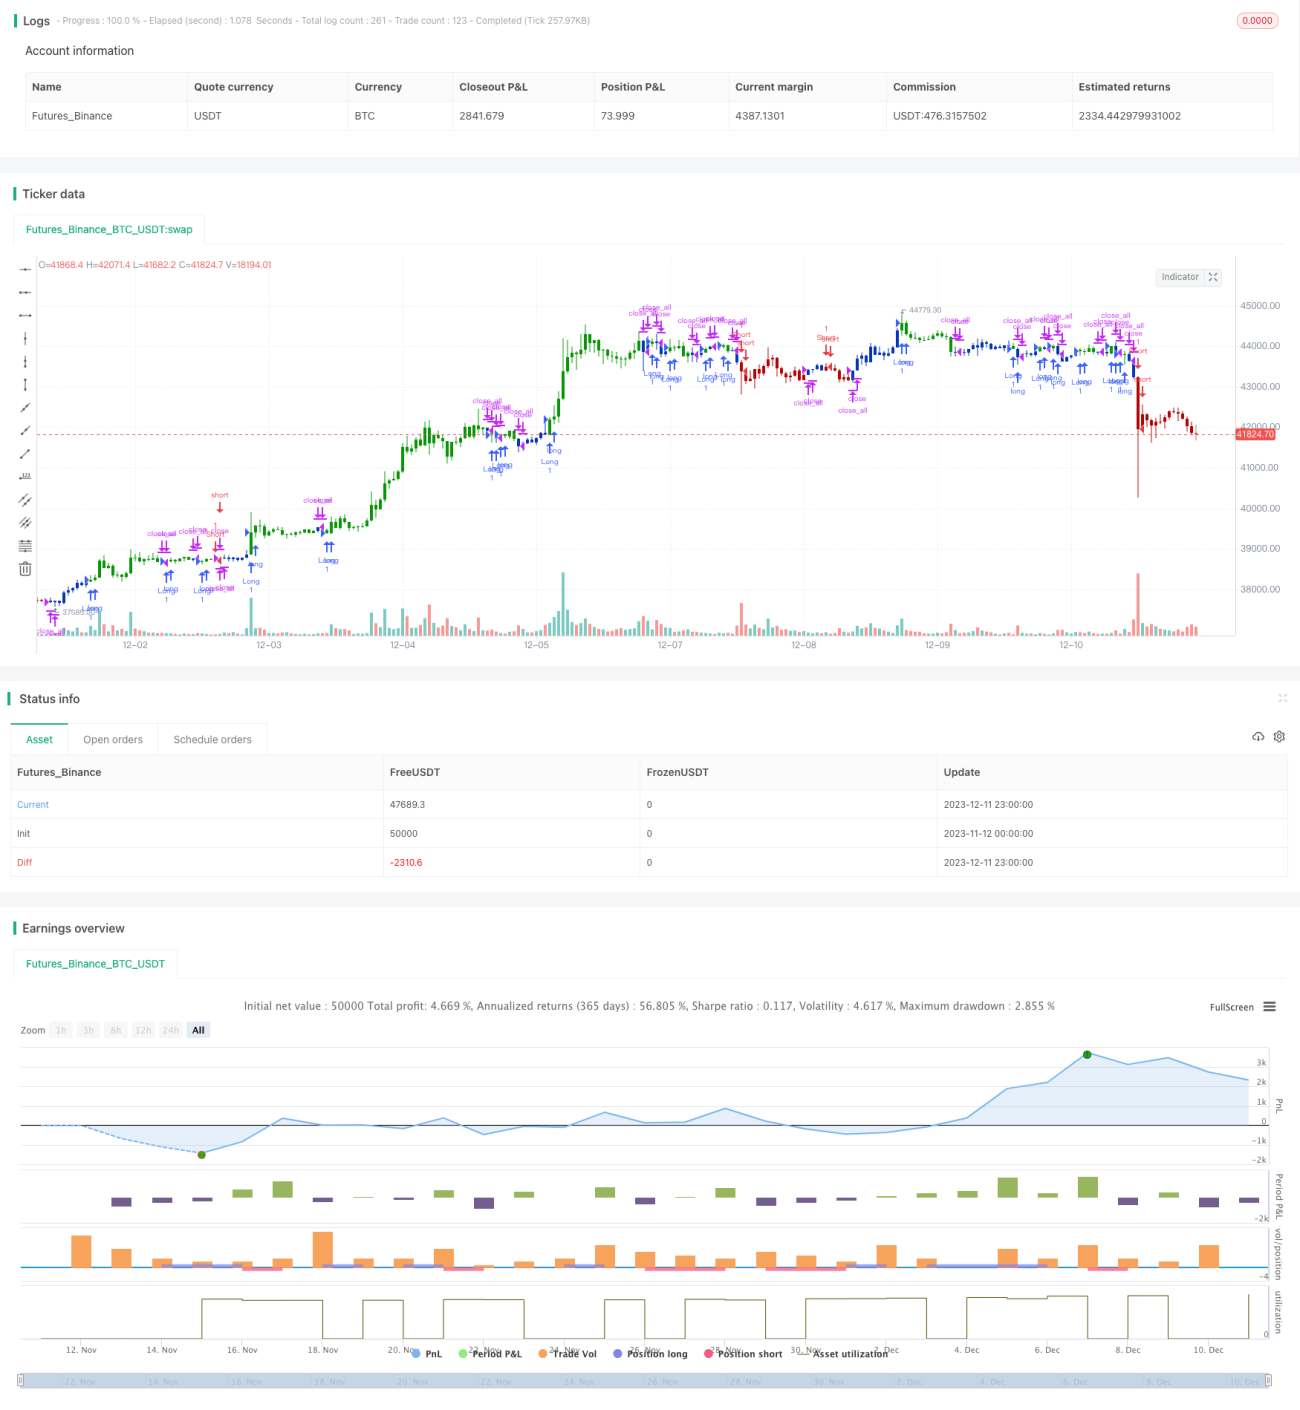
/*backtest
start: 2023-11-12 00:00:00
end: 2023-12-12 00:00:00
period: 1h
basePeriod: 15m
exchanges: [{"eid":"Futures_Binance","currency":"BTC_USDT"}]
*/

//@version=4
////////////////////////////////////////////////////////////
//  Copyright by HPotter v1.0 15/04/2021
// This is combo strategies for get a cumulative signal. - 1