যখন দাম চলমান গড় অতিক্রম করে তখন ট্রেডিং কৌশল

ওভারভিউ
ডুয়াল ডাইরেকশন প্রাইস ব্রেকথ্রু মুভিং এভারেজ টাইমিং ট্রেডিং স্ট্র্যাটেজি (ডুয়াল ডাইরেকশন প্রাইস ব্রেকথ্রু মুভিং এভারেজ টাইমিং ট্রেডিং স্ট্র্যাটেজি) হল একটি পরিমাণগত ট্রেডিং কৌশল যা দামের ব্রেকথ্রু ব্যবহার করে কেনা বেচা করার সময় নির্ধারণ করে। এই কৌশলটি নির্দিষ্ট সময়ের জন্য মুভিং এভারেজের সাথে দামের তুলনা করে এবং দামের উপর ভিত্তি করে ট্রেডিং তৈরি করে।
কৌশল নীতি
এই কৌশলটির মূল যুক্তি হলঃ
-
ইএমএ ফাংশন ব্যবহার করে নির্দিষ্ট সময়ের (যেমন ২০০ দিন) চলমান গড় গণনা করা হয়।
-
EMA-এর চেয়ে বড় হলে, দাম EMA-এর উপরে থাকবে; EMA-এর চেয়ে ছোট হলে, দাম EMA-এর নিচে থাকবে।
-
ইএমএ-র উপরে বা নীচে যাওয়ার সময় ক্রয়-বিক্রয়ের সময় নির্ধারণ করুন। যখন দাম ইএমএ-র উপরে থাকে তখন একটি ক্রয় সংকেত উত্পন্ন হয়; যখন দাম ইএমএ-র নীচে থাকে তখন একটি বিক্রয় সংকেত উত্পন্ন হয়।
-
সিগন্যাল তৈরি করার সময়, একটি নির্দিষ্ট অনুপাত (যেমন পূর্ণ স্টোর) অর্ডার করুন এবং তারপরে স্টপ লস এবং স্টপ স্টপ মূল্য সেট করুন।
-
যখন দাম স্টপ লস বা স্টপ পয়েন্টের কাছাকাছি আসে, তখন পজিশনটি সমতল করুন।
-
এইভাবে, দামের সময়মততা থেকে মুনাফা অর্জনের জন্য গড় লাইন ভেঙে দেওয়া হয়।
এই কৌশলটি সহজ সরল, সহজেই বোঝা যায় এবং বাস্তবায়ন করা যায়। সংক্ষিপ্ত লাইনে ব্রেকিং সিগন্যাল ধরার মাধ্যমে আরও ভাল সময়োপযোগীতা পাওয়া যায়। তবে কিছু স্থগিতাদেশ এবং একাধিক ঝড়ের ঝুঁকিও রয়েছে।
কৌশলগত সুবিধা
- কৌশলগত ধারণাগুলি সহজ এবং স্পষ্ট, সহজে বোঝা যায় এবং যাচাই করা যায়।
- গড়রেখার বৈশিষ্ট্য ব্যবহার করে, একটি নির্দিষ্ট প্রবণতা ট্র্যাকিং ক্ষমতা আছে।
- অনেকবার লেনদেনের ফলে, এটি সংক্ষিপ্ত লাইন অপারেশনের জন্য উপযুক্ত।
- "আমি মনে করি, এই ধরনের একটি ব্যবস্থার মাধ্যমে আমরা আমাদের মূল্যবোধকে আরও উন্নত করতে পারবো।
কৌশলগত ঝুঁকি
- "অবশ্যই, আমরা আমাদের লক্ষ্যে পৌঁছাতে পারবো না, কিন্তু আমরা আমাদের লক্ষ্যে পৌঁছাতে পারবো না।
- এই ধরনের সমস্যা অনেক সময় ঘটে যখন একাধিকবার ভূমিকম্প আঘাত হানে।
- "অবশ্যই, আমরা আমাদের লক্ষ্যে পৌঁছাতে সক্ষম হব না।
প্যারামিটার সমন্বয় দ্বারা অপ্টিমাইজ করা যায়, যেমন গড় লাইন প্যারামিটার সমন্বয়, আরও দক্ষ সূচক বিচার ব্যবহার, ট্রেডিং ফ্রিকোয়েন্সি হ্রাস করা ইত্যাদি পদ্ধতি। এছাড়াও ঝুঁকি নিয়ন্ত্রণের জন্য অভিযোজিত স্টপ লস বা ফিল্টারিং শর্ত প্রবর্তনের মতো উপায়গুলি সেট করা যেতে পারে।
কৌশল অপ্টিমাইজেশনের দিকনির্দেশনা
- EMA, SMA, LWMA ইত্যাদির মতো বিভিন্ন ধরণের এবং প্যারামিটারগুলির গড়রেখার সূচকগুলি চেষ্টা করে আরও ভাল সমাধানের সন্ধান করুন।
- ফিল্টারিং কন্ডিশন যুক্ত করা হয়েছে যাতে একাধিক ঝড়ের লেনদেন এড়ানো যায়। যেমন লেনদেনের পরিমাণ, বুলিন লাইন, এটিআর ইত্যাদির মতো সহায়ক বিচার।
- ঝুঁকি কমানোর জন্য ক্ষতি বন্ধ করার কৌশলগুলি অপ্টিমাইজ করুন এবং পরীক্ষা করুন।
- ট্রেন্ডিং এবং রিভার্সনের মতো বিভিন্ন কৌশলগত চিন্তাধারার সমন্বয়ে একটি সমন্বিত ট্রেডিং সিস্টেম গড়ে তোলা।
- প্যারামিটারাইজড কনফিগারেশন যুক্ত করা হয়েছে, যা নীতিগুলিকে আরও বেশি সার্বজনীন করে তোলে।
সারসংক্ষেপ
এই কৌশলটি সামগ্রিকভাবে সহজ এবং স্বজ্ঞাত, মূল ধারণাটি হ'ল মূল্যের সংক্ষিপ্ত বিরতি ক্যাপচার করার জন্য গড়রেখার অনুসরণ করা। সুবিধাগুলি হ'ল প্রতিক্রিয়াশীলতা এবং বাস্তবায়নের সহজতা; অসুবিধাগুলি হ'ল পিছিয়ে পড়া এবং বিলম্বিততা। পরবর্তী পর্যায়ে সূচক নির্বাচন, ক্ষতি বন্ধ করার ব্যবস্থা, ফিল্টারিংয়ের উপায় ইত্যাদির ক্ষেত্রে অপ্টিমাইজ করা যেতে পারে, যাতে কৌশলটি আরও স্থিতিশীল এবং বিস্তৃত হয়।
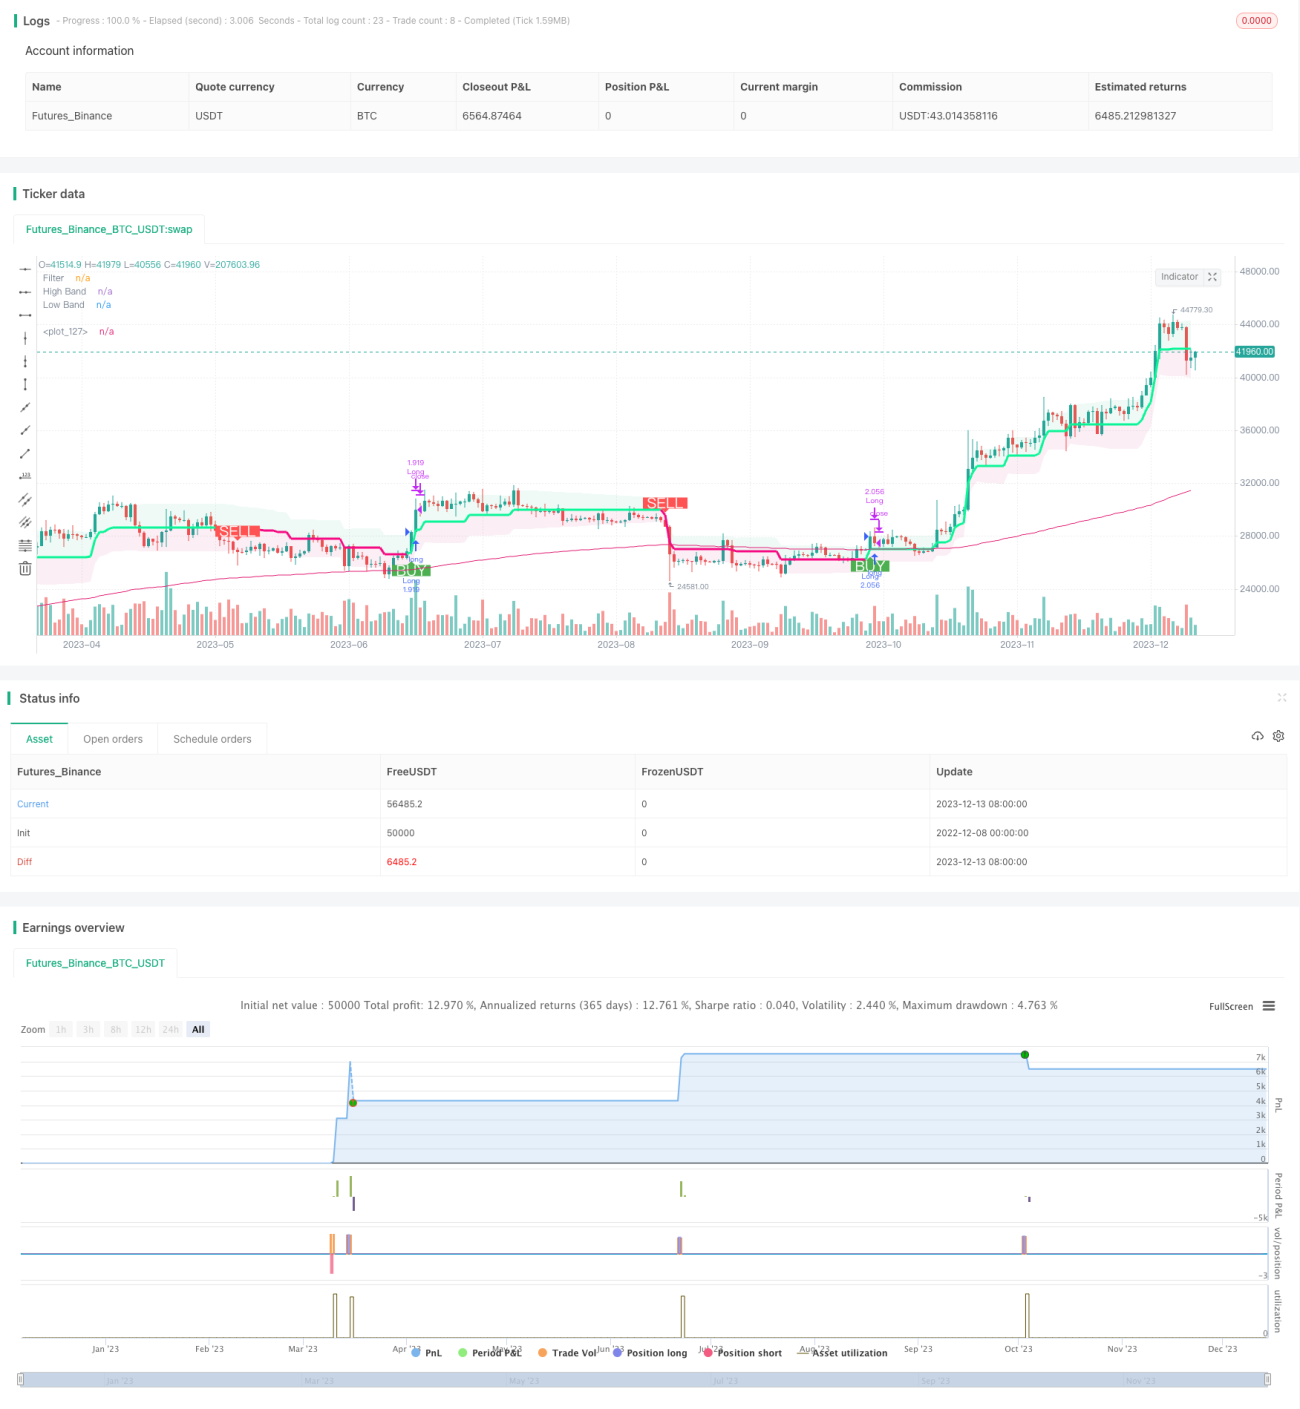
/*backtest
start: 2022-12-08 00:00:00
end: 2023-12-14 00:00:00
period: 1d
basePeriod: 1h
exchanges: [{"eid":"Futures_Binance","currency":"BTC_USDT"}]
*/

// This source code is subject to the terms of the Mozilla Public License 2.0 at https://mozilla.org/MPL/2.0/

// Credits to the original Script - Range Filter DonovanWall https://www.tradingview.com/script/lut7sBgG-Range-Filter-DW/
// This version is the old version of the Range Filter with less settings to tinker with- 1