দ্বৈত ট্রেইলিং স্টপ-লস টার্টল ট্রেডিং স্ট্র্যাটেজি

সারসংক্ষেপ
এই কৌশলটি Turtle Trading নিয়ম ব্যবহার করে দুটি ট্রেইলিং স্টপ লস পয়েন্ট স্থাপন করে, দ্বৈত ট্রেইলিং স্টপের মাধ্যমে ক্ষতি সীমিত করে এবং একই সাথে বাজারের শব্দ ফিল্টার করতে ভিন্ন প্যারামিটার সেট করে, যখন প্রবণতা বেশ স্পষ্ট হয় তখন ক্রয় করে।
কৌশলের মূলনীতি
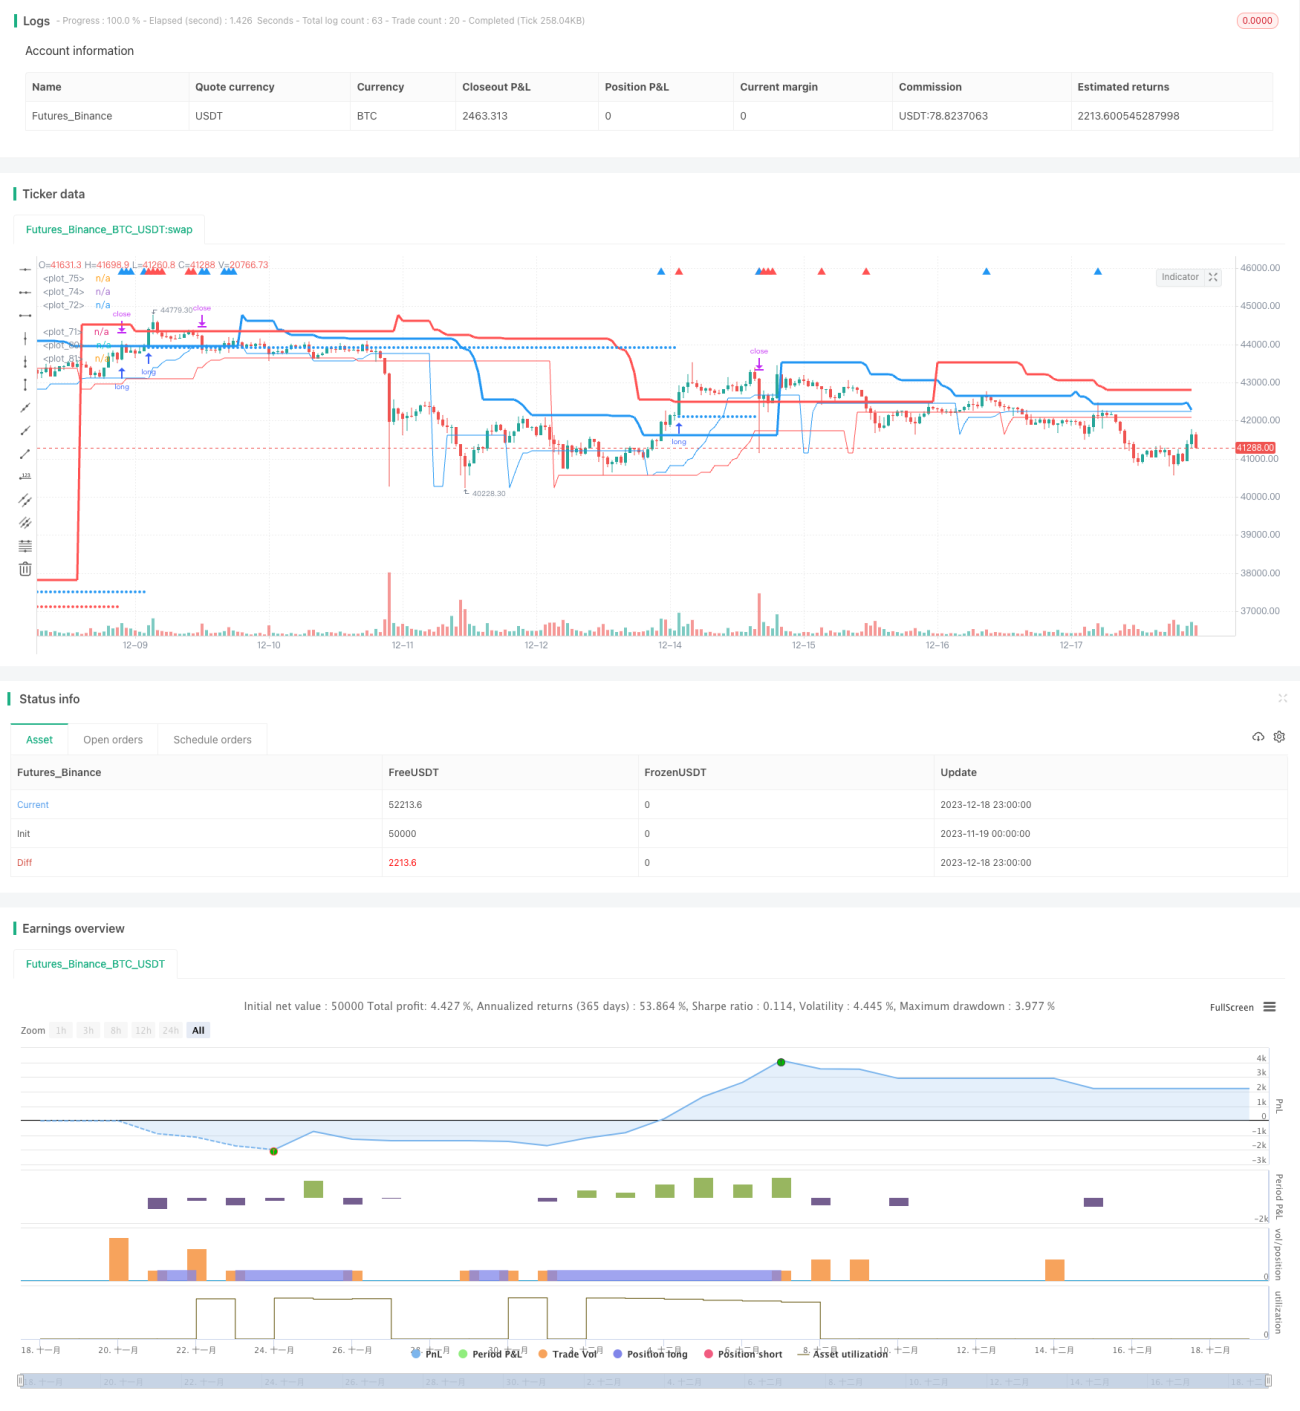
এই কৌশলটি মূলত দুটি ট্রেইলিং স্টপ লস পয়েন্ট long_1 এবং long_2 এর মাধ্যমে ক্রয়ের সময় নির্ধারণ করে। এখানে long_1 অপেক্ষাকৃত দীর্ঘমেয়াদী প্রবণতা ট্র্যাক করে, long_2 অপেক্ষাকৃত স্বল্পমেয়াদী প্রবণতা ট্র্যাক করে। একই সাথে profit1 এবং profit2 কে স্টপ লস পয়েন্ট হিসেবে সেট করা হয়।
যদি দাম long_1 এর উপরে থাকে, তাহলে বাজারটি দীর্ঘমেয়াদী ঊর্ধ্বমুখী প্রবণতায় থাকে, এই সময়ে যদি দাম আবার long_2 এর নিচে নেমে যায়, তাহলে বোঝা যায় স্বল্পমেয়াদে একটি সংশোধন হয়েছে যা ভালো প্রবেশের সুযোগ তৈরি করে, তাই লং পজিশনে যাওয়া হয়; যদি দাম long_1 এর নিচে থাকে, তাহলে দীর্ঘমেয়াদে কোনো নির্দিষ্ট প্রবণতা নেই, স্বল্পমেয়াদে যদি দাম long_2 এর উপরে উঠে যায়, তাহলে বোঝা যায় স্বল্পমেয়াদে একটি পুনরুদ্ধার হয়েছে, সেক্ষেত্রেও প্রবেশ করা যেতে পারে।
প্রবেশের পর, দুটি ট্রেইলিং স্টপ লস পয়েন্ট stoploss1 এবং stoploss2 সেট করা হয়, এবং এগুলোর সাথে profit1 এবং profit2 তুলনা করে সর্বোচ্চ মান নেওয়া হয়, ফলে মুনাফা লক করা হয়।
সুবিধা বিশ্লেষণ
- দ্বৈত ট্রেইলিং স্টপের মাধ্যমে কার্যকরভাবে ঝুঁকি নিয়ন্ত্রণ করা যায় এবং সর্বোচ্চ মুনাফা লক করা সম্ভব
- দীর্ঘ ও স্বল্পমেয়াদী দুই ধরনের সূচক একত্রিত করে কিছু শব্দ ফিল্টার করা যায় এবং স্পষ্ট প্রবণতার সময় প্রবেশ করা যায়
- প্যারামিটার সমন্বয়ের মাধ্যমে কৌশলের রক্ষণশীলতা স্বাধীনভাবে নিয়ন্ত্রণ করা যায়
ঝুঁকি বিশ্লেষণ
- কৌশলটি তুলনামূলকভাবে রক্ষণশীল, ফলে কিছু সুযোগ হাতছাড়া হতে পারে
- স্টপ লস পয়েন্ট ভুলভাবে সেট করলে অকালে স্টপ লস হতে পারে
- ট্রেডের সংখ্যা কম, ফলে একক লেনদেনের ক্ষতি বড় হতে পারে
long এবং profit এর প্যারামিটার যথাযথভাবে সামঞ্জস্য করে কৌশলটিকে আরও আক্রমণাত্মক করা যায় এবং ট্রেডের সংখ্যা বাড়ানো যায়। একই সাথে স্টপ লস পয়েন্ট অ্যালগরিদম অপ্টিমাইজ করে স্বয়ংক্রিয় সমন্বয় করা সম্ভব।
অপ্টিমাইজেশনের দিক
- long এবং profit এর প্যারামিটার অপ্টিমাইজ করে সর্বোত্তম প্যারামিটার কম্বিনেশন খুঁজে বের করা
- জিগ-জ্যাগ স্টপ লস বা শ্যাডো স্টপ লস অ্যালগরিদম ব্যবহার করে অপ্রয়োজনীয় স্টপ লস কমানো
- ওপেনিং শর্ত যোগ করে শব্দ ফিল্টার করা এবং আরও স্পষ্ট প্রবণতা খুঁজে বের করা
- ভলিউম ইন্ডিকেটর যুক্ত করে প্রকৃত ব্রেকআউট সনাক্ত করা
সারসংক্ষেপ
কৌশলটি সামগ্রিকভাবে তুলনামূলকভাবে রক্ষণশীল, যা স্থিতিশীল বৃদ্ধির জন্য উপযুক্ত বিনিয়োগকারীদের জন্য। প্যারামিটার সমন্বয় এবং স্টপ লস অ্যালগরিদম অপ্টিমাইজেশনের মাধ্যমে কৌশলটির আক্রমণাত্মকতা যথাযথভাবে বাড়ানো যায়। এছাড়াও, বাজারের শব্দ ফিল্টার করার ব্যবস্থা যোগ করাও পরবর্তী অপ্টিমাইজেশনের একটি দিক।
- 1