অভ্যন্তরীণ বার এবং চলমান গড়ের উপর ভিত্তি করে স্বয়ংক্রিয় পরিমাণগত ট্রেডিং কৌশল
ওভারভিউ
এই কৌশলটির মূল ধারণাগুলি হ’ল অভ্যন্তরীণ স্তম্ভের আকৃতি এবং চলমান গড়ের সূচকগুলির সাথে একত্রিত হয়ে স্বয়ংক্রিয়ভাবে ট্রেডিং করা। অভ্যন্তরীণ স্তম্ভের আকৃতি যখন বর্তমান প্রবণতাটি পরিবর্তিত হতে পারে, তখন আমরা চলমান গড়ের অবস্থানটি ব্যবহার করে চূড়ান্ত ট্রেডিংয়ের দিকনির্দেশনা নির্ধারণ করি।
কৌশল নীতি
অভ্যন্তরীণ স্তম্ভের আকৃতি খুঁজুন। অভ্যন্তরীণ স্তম্ভের আকৃতি হল একটি নির্দিষ্ট K- লাইনের সর্বোচ্চ এবং সর্বনিম্ন মূল্য পূর্ববর্তী K- লাইনের সত্তা অংশের মধ্যে। সত্তার রঙের উপর নির্ভর করে আমরা অভ্যন্তরীণ স্তম্ভকে বহু মাথা অভ্যন্তরীণ স্তম্ভ বা খালি মাথা অভ্যন্তরীণ স্তম্ভ হিসাবে বিচার করতে পারি।
চলমান গড়ের অবস্থান নির্ণয় করা। অভ্যন্তরীণ স্তম্ভের সন্ধান করার সময়, যদি দামটি চলমান গড়ের চেয়ে বেশি হয় তবে এটি একটি মাল্টি-হেড সংকেত, এবং যদি দামটি চলমান গড়ের চেয়ে কম হয় তবে এটি একটি খালি-হেড সংকেত।
অভ্যন্তরীণ স্তম্ভের আকৃতি এবং চলমান গড়ের সাথে মিলিত বহু-অভ্যন্তরীণ সংকেত, চূড়ান্ত লেনদেনের দিকটি পাওয়া যায়। অর্থাৎ, পতনের অভ্যন্তরীণ স্তম্ভের নীচে গড়ের ব্রেকডাউনটি শূন্য হয়ে যায় এবং পতিতাবৃত্তের অভ্যন্তরীণ স্তম্ভের উপরে গড়ের ব্রেকডাউনটি বেশি হয়।
কৌশলগত সুবিধা
প্রযুক্তিগত সূচক এবং মূল্য বিন্যাসের সাথে একত্রিত করে, লেনদেনের সিদ্ধান্তের নির্ভুলতা বাড়ানো।
অভ্যন্তরীণ স্তম্ভের আকৃতি নিজেই শক্তিশালী মূল্যের পাল্টানোর সংকেত ধারণ করে, যা প্রবণতা পাল্টানোর পয়েন্টটি নির্ধারণ করতে পারে।
চলমান গড়টি আংশিক শব্দ মুছে দেয়, যাতে ব্যাপ্তিগুলির মধ্যে কম্পনগুলি আটকে না যায়।
এটি সম্পূর্ণরূপে স্বয়ংক্রিয়ভাবে ট্রেডিংয়ের মাধ্যমে পরিচালিত হয়, যা মানুষের দ্বারা পরিচালিত ট্রেডিংয়ের সময় এবং প্রচেষ্টার খরচকে অনেকটা কমিয়ে দেয়।
কৌশলগত ঝুঁকি ও সমাধান
যখন দাম গড়ের কাছাকাছি থাকে, তখন বেশি ত্রুটিপূর্ণ সংকেত দেখা দেয়, যার ফলে অতিরিক্ত লেনদেন হয়। মুভিং এভারেজ প্যারামিটারগুলি অপ্টিমাইজ করে বা ফিল্টারিংয়ের শর্তগুলি যুক্ত করে ত্রুটিপূর্ণ সংকেত হ্রাস করা যেতে পারে।
এই কৌশলটি আরও স্পষ্ট প্রবণতাযুক্ত বাজারগুলির জন্য উপযুক্ত, এবং অস্থিরতার সময় কার্যকারিতাটি হ্রাস পেতে পারে। এটি প্রবণতা নির্ধারণের সূচক যেমন এডিএক্সের সাথে সংযুক্ত করা যেতে পারে যাতে অ্যালগরিদমটি চালু করা যায়।
একটি নির্দিষ্ট সময় বিলম্ব বিদ্যমান। প্যারামিটারগুলি যথাযথভাবে সংক্ষিপ্ত করা যেতে পারে, বা বিলম্ব হ্রাস করার জন্য চলমান গড়ের গণনা পদ্ধতিটি অপ্টিমাইজ করা যেতে পারে।
প্রত্যাহারের ঝুঁকি বেশি। ক্ষতির ঝুঁকি নিয়ন্ত্রণের জন্য স্টপ লস সেট করা যেতে পারে, এবং পজিশন ম্যানেজমেন্টের যথাযথ সমন্বয়ও প্রত্যাহারকে হ্রাস করতে সহায়তা করতে পারে।
কৌশল অপ্টিমাইজেশনের দিকনির্দেশনা
অভ্যন্তরীণ স্তম্ভের অপ্টিমাইজেশান, যা চক্রের প্যারামিটার নির্ধারণ করে এবং সর্বোত্তম প্যারামিটার সমন্বয় খুঁজে বের করে।
EMA, SMA, ইত্যাদির মতো বিভিন্ন ধরণের চলমান গড়ের সাথে পরীক্ষা করে দেখুন এবং সবচেয়ে উপযুক্ত চলমান গড়ের সূচকটি নির্ধারণ করুন।
MACD, KDJ, ইত্যাদির মতো সহায়ক সূচকগুলি যুক্ত করা হয়েছে, যা ফরেক্স ট্রেডিং ট্রেডিং ট্রেডিং ট্রেডিং ট্রেডিং ট্রেডিং ট্রেডিং ট্রেডিং ট্রেডিং ট্রেডিং ট্রেডিং ট্রেডিং ট্রেডিং ট্রেডিং ট্রেডিং ট্রেডিং ট্রেডিং ট্রেডিং ট্রেডিং ট্রেডিং ট্রেডিং ট্রেডিং ট্রেডিং ট্রেডিং ট্রেডিং ট্রেডিং ট্রেডিং ট্রেডিং ট্রেডিং ট্রেডিং ট্রেডিং ট্রেডিং ট্রেডিং ট্রেডিং ট্রেডিং ট্রেডিং ট্রেডিং ট্রেডিং ট্রেডিং ট্রেডিং ট্রেডিং ট্রেডিং ট্রেডিং ট্রেডিং ট্রেডিং ট্রেডিং ট্রেডিং ট্রেডিং ট্রেডিং ট্রেডিং ট্রেডিং ট্রেডিং ট্রেডিং ট্রেডিং ট্রেডিং ট্রেডিং ট্রেডিং ট্রেডিং ট্রেডিং ট্রেডিং ট্রেডিং ট্রেডিং ট্রেডিং ট্রেডিং ট্রেডিং ট্রেডিং ট্রেডিং ট্রেডিং ট্রেডিং ট্রেডিং ট্রেডিং ট্রেডিং ট্রেডিং ট্রেডিং ট্রেডিং ট্রেডিং ট্রে
ADX, ATR ইত্যাদির মতো ফিল্টারিং সূচক যুক্ত করুন, অ্যালগরিদম চালু পরিবেশ নিয়ন্ত্রণ করুন এবং অনুপযুক্ত বাজারে কাজ করা এড়িয়ে চলুন।
পজিশন ম্যানেজমেন্ট কৌশলগুলিকে অপ্টিমাইজ করুন, যেমন ঝুঁকিপূর্ণ পজিশন কন্ট্রোল, হারানো মুনাফা পুনরুদ্ধার পজিশন ইত্যাদি, ঝুঁকি নিয়ন্ত্রণ করতে এবং উচ্চতর রিটার্নের জন্য।
সারসংক্ষেপ
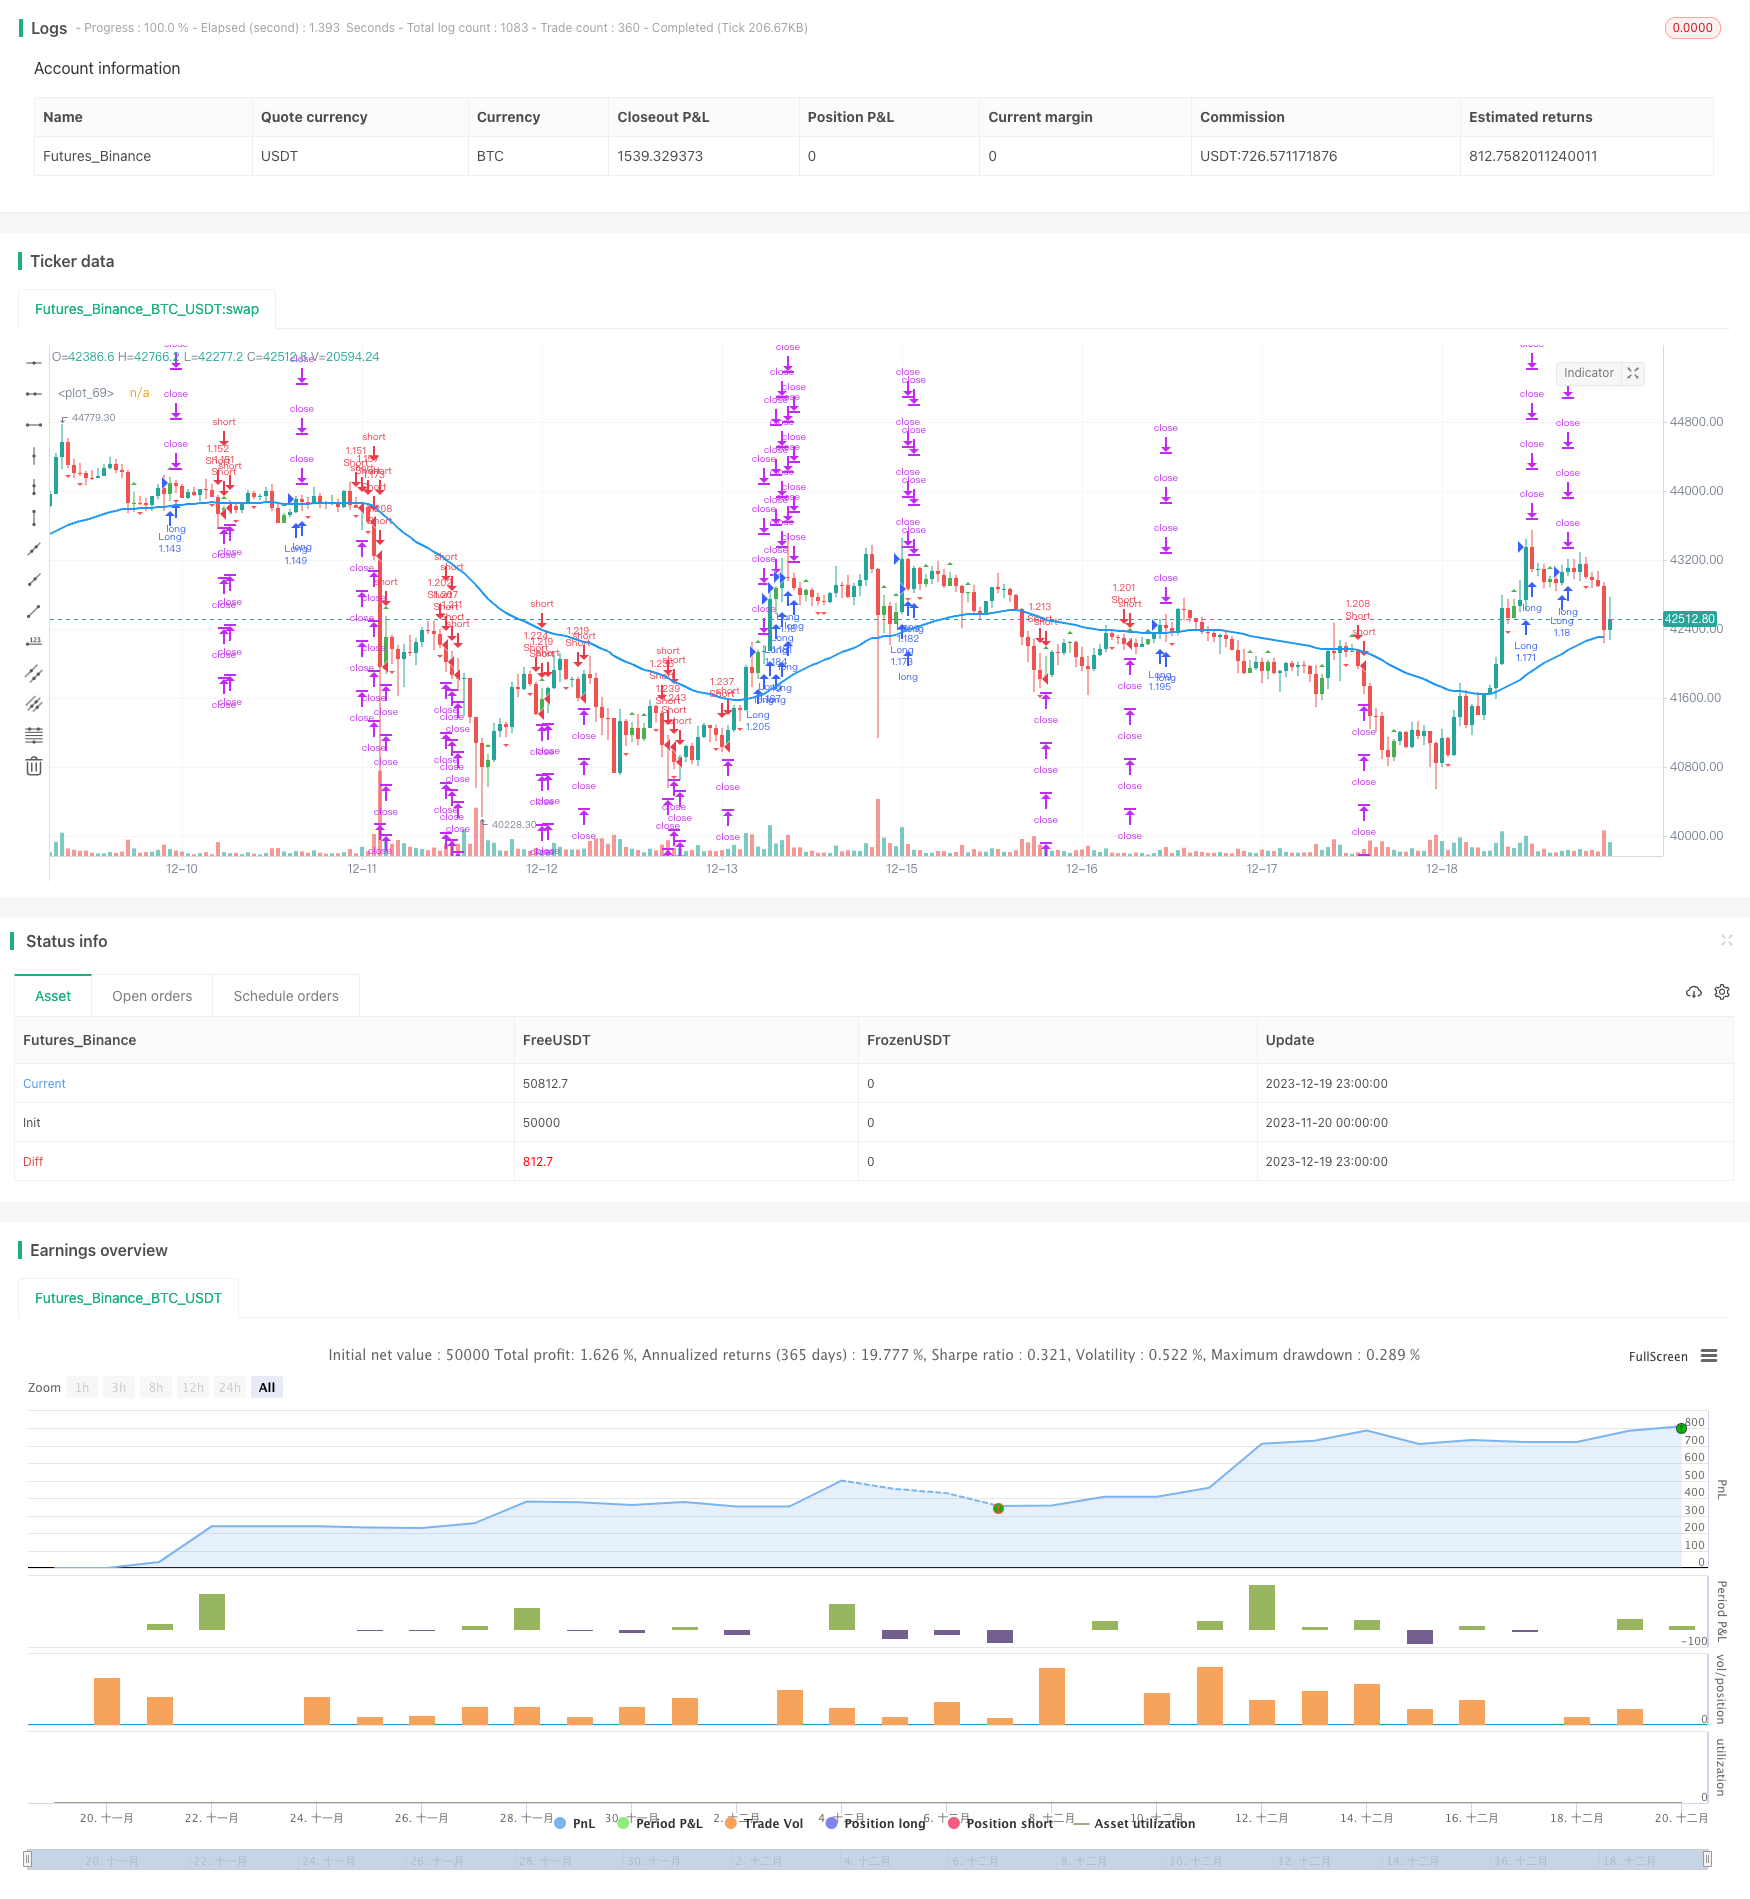
এই কৌশলটি অভ্যন্তরীণ স্তম্ভের সংকেত এবং চলমান গড়ের সূচকগুলিকে গতিশীলভাবে অনুসরণ করে একটি সম্পূর্ণ স্বয়ংক্রিয় পরিমাণে ট্রেডিং প্রোগ্রাম বাস্তবায়ন করে। কৌশল সংকেত উত্পাদন সহজ এবং পরিষ্কার, সহজে বোঝা এবং অনুসরণ করা যায়। প্রবণতা স্পষ্ট বাজারে এটি দুর্দান্ত কাজ করে। প্যারামিটার এবং নিয়মগুলি আরও অনুকূলিত করে কৌশলটির স্থায়িত্ব এবং লাভজনকতা আরও বাড়ানো যায়।
/*backtest
start: 2023-11-20 00:00:00
end: 2023-12-20 00:00:00
period: 1h
basePeriod: 15m
exchanges: [{"eid":"Futures_Binance","currency":"BTC_USDT"}]
*/

// This source code is subject to the terms of the Mozilla Public License 2.0 at https://mozilla.org/MPL/2.0/
// © myn

//@version=5
strategy('Strategy Myth-Busting #10 - InsideBar+EMA - [MYN]', max_bars_back=5000, overlay=true, pyramiding=0, initial_capital=20000, currency='USD', default_qty_type=strategy.percent_of_equity, default_qty_value=100.0, commission_value=0.075, use_bar_magnifier = false)

/////////////////////////////////////
//* Put your strategy logic below *//
/////////////////////////////////////
//short if: inside bar and bearish & below 50 ema & price falls below low of inside bar. Opposite for long. on 4H TF

// Inside Bar
//░░░░░░░░░░░░░░░░░░░░░░░░░░░░░░░░░░░░░░░░░░░░░░░░░░░░░░░░░░░░░░░░░░░░░░░░░░░░░░░░░░░░░░░░░░░░░░░░░░░░░░░░░░░░░░░░░░░░░░░░░░░░░░░░░░░░░░░░░░░░░░░░░░

f_priorBarsSatisfied(_objectToEval, _numOfBarsToLookBack) =>
    returnVal = false
    for i = 0 to _numOfBarsToLookBack
        if (_objectToEval[i] == true)
            returnVal = true

i_numLookbackBars = input(2,title="Lookback for Inside Bar")


// This source code is subject to the terms of the GNU License 2.0 at https://www.gnu.org/licenses/old-licenses/gpl-2.0.en.html
// © cma

//@version=5
//indicator('Inside Bar Ind/Alert', overlay=true)

bullishBar = 1
bearishBar = -1

isInside() =>
    previousBar = 1
    bodyStatus = close >= open ? 1 : -1
    isInsidePattern = high < high[previousBar] and low > low[previousBar]

    isInsidePattern ? bodyStatus : 0

barcolor(isInside() == bullishBar ? color.green : na)
barcolor(isInside() == bearishBar ? color.red : na)

// When is bullish bar paint green
plotshape(isInside() == bullishBar, style=shape.triangleup, location=location.abovebar, color=color.new(color.green, 0))

// When is bearish bar paint red
plotshape(isInside() == bearishBar, style=shape.triangledown, location=location.belowbar, color=color.new(color.red, 0))

isInsideBarMade = isInside() == bullishBar or isInside() == bearishBar

alertcondition(isInsideBarMade, title='Inside Bar', message='Inside Bar came up!')

i_srcInsideBarLong = input.source(close, title = "_____ falls above HIGH of inside bar (Long condition)")
i_srcInsideBarShort = input.source(close, title = "_____ falls below LOW of inside bar (Short condition)")


//if: inside bar and falls below low of inside bar. I think.
insideBarLongEntry = f_priorBarsSatisfied(isInside() == bullishBar,i_numLookbackBars) and i_srcInsideBarLong > high[i_numLookbackBars]     //isInside() == bullishBar
insideBarShortEntry = f_priorBarsSatisfied(isInside() == bearishBar,i_numLookbackBars)  and i_srcInsideBarShort < low[i_numLookbackBars]    //isInside() == bearishBar


// EMA
//░░░░░░░░░░░░░░░░░░░░░░░░░░░░░░░░░░░░░░░░░░░░░░░░░░░░░░░░░░░░░░░░░░░░░░░░░░░░░░░░░░░░░░░░░░░░░░░░░░░░░░░░░░░░░░░░░░░░░░░░░░░░░░░░░░░░░░░░░░░░░░░░░░

i_src = input.source(close, title = "EMA Source")
i_emaLength = input(50,title="EMA Length")
ema = ta.ema(i_src, i_emaLength)
emaPlot = plot(series=ema,color=color.blue, linewidth=2)

emaLongEntry = i_src > ema
emaShortEntry = i_src < ema

//////////////////////////////////////
//* Put your strategy rules below *//
/////////////////////////////////////

longCondition = insideBarLongEntry and emaLongEntry
shortCondition = insideBarShortEntry and emaShortEntry
//define as 0 if do not want to use
closeLongCondition = 0
closeShortCondition = 0


// ADX
//░░░░░░░░░░░░░░░░░░░░░░░░░░░░░░░░░░░░░░░░░░░░░░░░░░░░░░░░░░░░░░░░░░░░░░░░░░░░░░░░░░░░░░░░░░░░░░░░░░░░░░░░░░░░░░░░░░░░░░░░░░░░░░░░░░░░░░░░░░░░░░░░░░

adxEnabled = input.bool(defval = false , title = "Average Directional Index (ADX)", tooltip = "", group ="ADX" )
adxlen = input(14, title="ADX Smoothing", group="ADX")
adxdilen = input(14, title="DI Length", group="ADX")
adxabove = input(25, title="ADX Threshold", group="ADX")

adxdirmov(len) =>
	adxup = ta.change(high)
	adxdown = -ta.change(low)
	adxplusDM = na(adxup) ? na : (adxup > adxdown and adxup > 0 ? adxup : 0)
	adxminusDM = na(adxdown) ? na : (adxdown > adxup and adxdown > 0 ? adxdown : 0)
	adxtruerange = ta.rma(ta.tr, len)
	adxplus = fixnan(100 * ta.rma(adxplusDM, len) / adxtruerange)
	adxminus = fixnan(100 * ta.rma(adxminusDM, len) / adxtruerange)
	[adxplus, adxminus]
adx(adxdilen, adxlen) =>
	[adxplus, adxminus] = adxdirmov(adxdilen)
	adxsum = adxplus + adxminus
	adx = 100 * ta.rma(math.abs(adxplus - adxminus) / (adxsum == 0 ? 1 : adxsum), adxlen)

adxsig = adxEnabled ? adx(adxdilen, adxlen) : na
isADXEnabledAndAboveThreshold = adxEnabled ? (adxsig > adxabove) : true

//Backtesting Time Period (Input.time not working as expected as of 03/30/2021.  Giving odd start/end dates
//░░░░░░░░░░░░░░░░░░░░░░░░░░░░░░░░░░░░░░░░░░░░░░░░░░░░░░░░░░░░░░░░░░░░░░░░░░░░░░░░░░░░░░░░░░░░░░░░░░░░░░░░░░░░░░░░░░░░░░░░░░░░░░░░░░░░░░░░░░░░░░░░░░
useStartPeriodTime = input.bool(true, 'Start', group='Date Range', inline='Start Period')
startPeriodTime = input(timestamp('1 Jan 2019'), '', group='Date Range', inline='Start Period')
useEndPeriodTime = input.bool(true, 'End', group='Date Range', inline='End Period')
endPeriodTime = input(timestamp('31 Dec 2030'), '', group='Date Range', inline='End Period')

start = useStartPeriodTime ? startPeriodTime >= time : false
end = useEndPeriodTime ? endPeriodTime <= time : false
calcPeriod = true

// Trade Direction
// ░░░░░░░░░░░░░░░░░░░░░░░░░░░░░░░░░░░░░░░░░░░░░░░░░░░░░░░░░░░░░░░░░░░░░░░░░░░░░░░░░░░░░░░░░░░░░░░░░░░░░░░░░░░░░░░░░░░░░░░░░░░░░░░░░░░░░░░░░░░░░░░░░░
tradeDirection = input.string('Long and Short', title='Trade Direction', options=['Long and Short', 'Long Only', 'Short Only'], group='Trade Direction')

// Percent as Points
// ░░░░░░░░░░░░░░░░░░░░░░░░░░░░░░░░░░░░░░░░░░░░░░░░░░░░░░░░░░░░░░░░░░░░░░░░░░░░░░░░░░░░░░░░░░░░░░░░░░░░░░░░░░░░░░░░░░░░░░░░░░░░░░░░░░░░░░░░░░░░░░░░░░
per(pcnt) =>
    strategy.position_size != 0 ? math.round(pcnt / 100 * strategy.position_avg_price / syminfo.mintick) : float(na)

// Take profit 1
// ░░░░░░░░░░░░░░░░░░░░░░░░░░░░░░░░░░░░░░░░░░░░░░░░░░░░░░░░░░░░░░░░░░░░░░░░░░░░░░░░░░░░░░░░░░░░░░░░░░░░░░░░░░░░░░░░░░░░░░░░░░░░░░░░░░░░░░░░░░░░░░░░░░
tp1 = input.float(title='Take Profit 1 - Target %', defval=10.5, minval=0.0, step=0.5, group='Take Profit', inline='Take Profit 1')
q1 = input.int(title='% Of Position', defval=25, minval=0, group='Take Profit', inline='Take Profit 1')

// Take profit 2
// ░░░░░░░░░░░░░░░░░░░░░░░░░░░░░░░░░░░░░░░░░░░░░░░░░░░░░░░░░░░░░░░░░░░░░░░░░░░░░░░░░░░░░░░░░░░░░░░░░░░░░░░░░░░░░░░░░░░░░░░░░░░░░░░░░░░░░░░░░░░░░░░░░░
tp2 = input.float(title='Take Profit 2 - Target %', defval=11, minval=0.0, step=0.5, group='Take Profit', inline='Take Profit 2')
q2 = input.int(title='% Of Position', defval=25, minval=0, group='Take Profit', inline='Take Profit 2')

// Take profit 3
// ░░░░░░░░░░░░░░░░░░░░░░░░░░░░░░░░░░░░░░░░░░░░░░░░░░░░░░░░░░░░░░░░░░░░░░░░░░░░░░░░░░░░░░░░░░░░░░░░░░░░░░░░░░░░░░░░░░░░░░░░░░░░░░░░░░░░░░░░░░░░░░░░░░
tp3 = input.float(title='Take Profit 3 - Target %', defval=11.5, minval=0.0, step=0.5, group='Take Profit', inline='Take Profit 3')
q3 = input.int(title='% Of Position', defval=25, minval=0, group='Take Profit', inline='Take Profit 3')

// Take profit 4
// ░░░░░░░░░░░░░░░░░░░░░░░░░░░░░░░░░░░░░░░░░░░░░░░░░░░░░░░░░░░░░░░░░░░░░░░░░░░░░░░░░░░░░░░░░░░░░░░░░░░░░░░░░░░░░░░░░░░░░░░░░░░░░░░░░░░░░░░░░░░░░░░░░░
tp4 = input.float(title='Take Profit 4 - Target %', defval=12, minval=0.0, step=0.5, group='Take Profit')

/// Stop Loss
// ░░░░░░░░░░░░░░░░░░░░░░░░░░░░░░░░░░░░░░░░░░░░░░░░░░░░░░░░░░░░░░░░░░░░░░░░░░░░░░░░░░░░░░░░░░░░░░░░░░░░░░░░░░░░░░░░░░░░░░░░░░░░░░░░░░░░░░░░░░░░░░░░░░
stoplossPercent = input.float(title='Stop Loss (%)', defval=4, minval=0.01, group='Stop Loss') * 0.01
slLongClose = close < strategy.position_avg_price * (1 - stoplossPercent)
slShortClose = close > strategy.position_avg_price * (1 + stoplossPercent)

/// Leverage
// ░░░░░░░░░░░░░░░░░░░░░░░░░░░░░░░░░░░░░░░░░░░░░░░░░░░░░░░░░░░░░░░░░░░░░░░░░░░░░░░░░░░░░░░░░░░░░░░░░░░░░░░░░░░░░░░░░░░░░░░░░░░░░░░░░░░░░░░░░░░░░░░░░░
leverage = input.float(1, 'Leverage', step=.5, group='Leverage')
contracts = math.min(math.max(.000001, strategy.equity / close * leverage), 1000000000)


/// Trade State Management
// ░░░░░░░░░░░░░░░░░░░░░░░░░░░░░░░░░░░░░░░░░░░░░░░░░░░░░░░░░░░░░░░░░░░░░░░░░░░░░░░░░░░░░░░░░░░░░░░░░░░░░░░░░░░░░░░░░░░░░░░░░░░░░░░░░░░░░░░░░░░░░░░░░░

isInLongPosition = strategy.position_size > 0
isInShortPosition = strategy.position_size < 0

/// ProfitView Alert Syntax String Generation
// ░░░░░░░░░░░░░░░░░░░░░░░░░░░░░░░░░░░░░░░░░░░░░░░░░░░░░░░░░░░░░░░░░░░░░░░░░░░░░░░░░░░░░░░░░░░░░░░░░░░░░░░░░░░░░░░░░░░░░░░░░░░░░░░░░░░░░░░░░░░░░░░░░░

alertSyntaxPrefix = input.string(defval='CRYPTANEX_99FTX_Strategy-Name-Here', title='Alert Syntax Prefix', group='ProfitView Alert Syntax')
alertSyntaxBase = alertSyntaxPrefix + '\n#' + str.tostring(open) + ',' + str.tostring(high) + ',' + str.tostring(low) + ',' + str.tostring(close) + ',' + str.tostring(volume) + ','


/// Trade Execution
// ░░░░░░░░░░░░░░░░░░░░░░░░░░░░░░░░░░░░░░░░░░░░░░░░░░░░░░░░░░░░░░░░░░░░░░░░░░░░░░░░░░░░░░░░░░░░░░░░░░░░░░░░░░░░░░░░░░░░░░░░░░░░░░░░░░░░░░░░░░░░░░░░░░

longConditionCalc = (longCondition and isADXEnabledAndAboveThreshold)
shortConditionCalc = (shortCondition and isADXEnabledAndAboveThreshold)

if calcPeriod
    if longConditionCalc and tradeDirection != 'Short Only' and isInLongPosition == false
        strategy.entry('Long', strategy.long, qty=contracts)

        alert(message=alertSyntaxBase + 'side:long', freq=alert.freq_once_per_bar_close)

    if shortConditionCalc and tradeDirection != 'Long Only' and isInShortPosition == false
        strategy.entry('Short', strategy.short, qty=contracts)

        alert(message=alertSyntaxBase + 'side:short', freq=alert.freq_once_per_bar_close)

    //Inspired from Multiple %% profit exits example by adolgo https://www.tradingview.com/script/kHhCik9f-Multiple-profit-exits-example/
    strategy.exit('TP1', qty_percent=q1, profit=per(tp1))
    strategy.exit('TP2', qty_percent=q2, profit=per(tp2))
    strategy.exit('TP3', qty_percent=q3, profit=per(tp3))
    strategy.exit('TP4', profit=per(tp4))

    strategy.close('Long', qty_percent=100, comment='SL Long', when=slLongClose)
    strategy.close('Short', qty_percent=100, comment='SL Short', when=slShortClose)

    strategy.close_all(when=closeLongCondition or closeShortCondition, comment='Close Postion')

/// Dashboard
// ░░░░░░░░░░░░░░░░░░░░░░░░░░░░░░░░░░░░░░░░░░░░░░░░░░░░░░░░░░░░░░░░░░░░░░░░░░░░░░░░░░░░░░░░░░░░░░░░░░░░░░░░░░░░░░░░░░░░░░░░░░░░░░░░░░░░░░░░░░░░░░░░░░
// Inspired by https://www.tradingview.com/script/uWqKX6A2/ - Thanks VertMT

showDashboard = input.bool(group="Dashboard", title="Show Dashboard", defval=false)

f_fillCell(_table, _column, _row, _title, _value, _bgcolor, _txtcolor) =>
    _cellText = _title + "\n" + _value
    table.cell(_table, _column, _row, _cellText, bgcolor=_bgcolor, text_color=_txtcolor, text_size=size.auto)

// Draw dashboard table
if showDashboard
    var bgcolor = color.new(color.black,0)

    // Keep track of Wins/Losses streaks
    newWin  = (strategy.wintrades  > strategy.wintrades[1]) and (strategy.losstrades == strategy.losstrades[1]) and (strategy.eventrades == strategy.eventrades[1])
    newLoss = (strategy.wintrades == strategy.wintrades[1]) and (strategy.losstrades  > strategy.losstrades[1]) and (strategy.eventrades == strategy.eventrades[1])

    varip int winRow     = 0
    varip int lossRow    = 0
    varip int maxWinRow  = 0
    varip int maxLossRow = 0

    if newWin
        lossRow := 0
        winRow := winRow + 1
    if winRow > maxWinRow
        maxWinRow := winRow

    if newLoss
        winRow := 0
        lossRow := lossRow + 1
    if lossRow > maxLossRow
        maxLossRow := lossRow


    // Prepare stats table
    var table dashTable = table.new(position.bottom_right, 1, 15, border_width=1)


    if barstate.islastconfirmedhistory
        // Update table
        dollarReturn = strategy.netprofit
        f_fillCell(dashTable, 0, 0, "Start:", str.format("{0,date,long}", strategy.closedtrades.entry_time(0)) , bgcolor, color.white) // + str.format(" {0,time,HH:mm}", strategy.closedtrades.entry_time(0))
        f_fillCell(dashTable, 0, 1, "End:", str.format("{0,date,long}", strategy.opentrades.entry_time(0)) , bgcolor, color.white) // + str.format(" {0,time,HH:mm}", strategy.opentrades.entry_time(0))
        _profit = (strategy.netprofit / strategy.initial_capital) * 100
        f_fillCell(dashTable, 0, 2, "Net Profit:", str.tostring(_profit, '##.##') + "%", _profit > 0 ? color.green : color.red, color.white)
        _numOfDaysInStrategy = (strategy.opentrades.entry_time(0) - strategy.closedtrades.entry_time(0)) / (1000 * 3600 * 24)
        f_fillCell(dashTable, 0, 3, "Percent Per Day", str.tostring(_profit / _numOfDaysInStrategy, '#########################.#####')+"%", _profit > 0 ? color.green : color.red, color.white)
        _winRate = ( strategy.wintrades / strategy.closedtrades ) * 100
        f_fillCell(dashTable, 0, 4, "Percent Profitable:", str.tostring(_winRate, '##.##') + "%", _winRate < 50 ? color.red : _winRate < 75 ? #999900 : color.green, color.white)
        f_fillCell(dashTable, 0, 5, "Profit Factor:", str.tostring(strategy.grossprofit / strategy.grossloss,  '##.###'), strategy.grossprofit > strategy.grossloss ? color.green : color.red, color.white)
        f_fillCell(dashTable, 0, 6, "Total Trades:", str.tostring(strategy.closedtrades), bgcolor, color.white)
        f_fillCell(dashTable, 0, 8, "Max Wins In A Row:", str.tostring(maxWinRow, '######') , bgcolor, color.white)
        f_fillCell(dashTable, 0, 9, "Max Losses In A Row:", str.tostring(maxLossRow, '######') , bgcolor, color.white)