গতিশীল ফিল্টার পরিমাণগত ট্রেডিং কৌশল
কৌশল ওভারভিউ
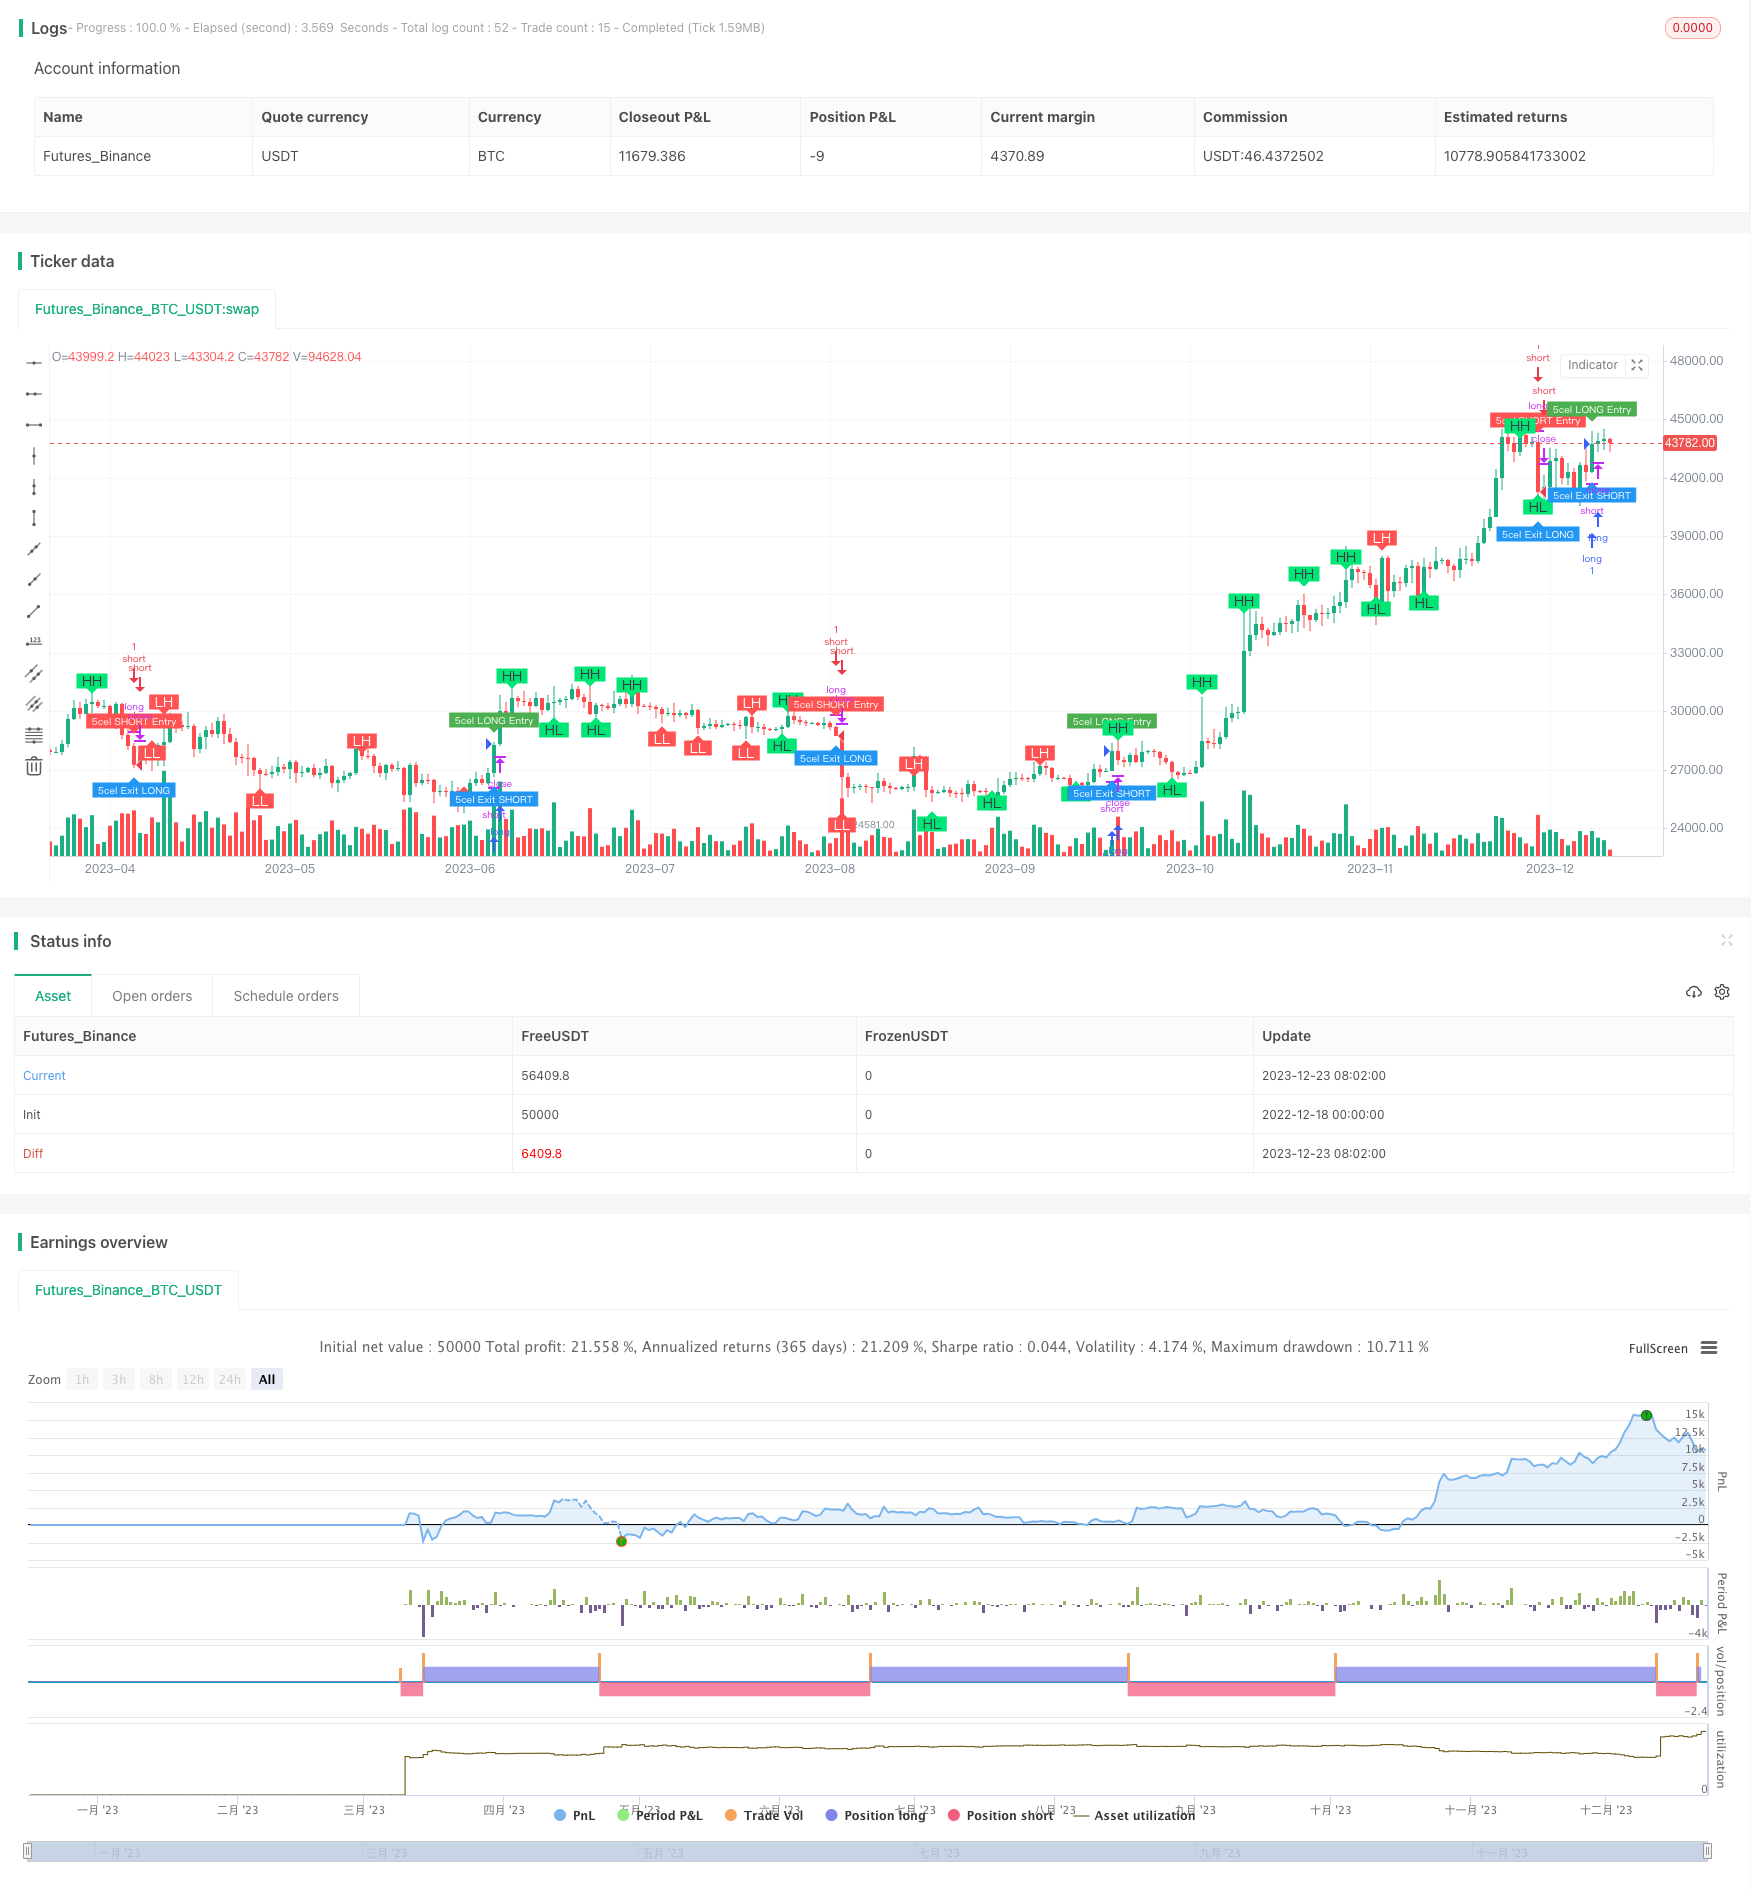
এই কৌশলটি ডায়নামিক ফিল্টার কোয়ান্ট ট্রেডিং কৌশল নামে পরিচিত, এটি মূলত বিভিন্ন প্রযুক্তিগত সূচকগুলির সাথে একত্রে পরিসীমা ফিল্টার সূচক ব্যবহার করে, যা ক্রিপ্টোকারেন্সি বিটিসি ইউএসডিটির স্বয়ংক্রিয় প্রবণতা ট্র্যাকিংয়ের জন্য ট্রেডিং করে। কৌশলটি উচ্চ-ফ্রিকোয়েন্সি কোয়ান্ট ট্রেডিংয়ের জন্য প্রযোজ্য, গতিশীলভাবে স্টপ লস স্টপকে সামঞ্জস্য করে মুনাফা লক করতে এবং প্রত্যাহার হ্রাস করতে।
কৌশল নীতি
এই কৌশলটির কেন্দ্রীয় সূচক হল পরিসীমা ফিল্টার, যা পরিসংখ্যানগত মূল্য পরিবর্তনের পরিসরের উপর ভিত্তি করে একটি মধ্যম লাইন তৈরি করে। যখন দামটি মধ্যম লাইনটি ভেঙে দেয় তখন একটি লেনদেনের সংকেত তৈরি করে। এছাড়াও, কৌশলটি আরও বেশি নির্ভরযোগ্য লেনদেনের সংকেত তৈরি করার জন্য RSI সূচককে অতিরিক্ত ওভারসেলিং, গড় লাইন ট্রেন্ডিং এবং MACD গতিশীলতা নির্ধারণের মতো সূচকগুলির সাথে সংযুক্ত করে।
বিশেষ করে, পরিসীমা ফিল্টারের মধ্যরেখাটি দামের পরিবর্তনের পরিসরের সূচকীয় চলমান গড়ের উপর ভিত্তি করে প্রাপ্ত হয়, এবং দিকনির্দেশনাটি এই মধ্যরেখার বিঘ্নের শক্তি এবং গতির উপর ভিত্তি করে নির্ধারিত হয়। যখন দাম ক্রমাগত কয়েক কে লাইন মধ্যরেখা অতিক্রম করে তখন একটি শক্তিশালী বিঘ্ন সংকেত তৈরি হয়।
RSI সূচকটি ওভার-বই ওভার-সেলের অবস্থা নির্ধারণ করে ফিল্টার সংকেত নিশ্চিত করার জন্য ব্যবহৃত হয়। গড় লাইনটি যখন উপরে যায় তখন এটিকে ট্রেন্ড আপ হিসাবে বিবেচনা করা হয়, যখন এটি নীচে যায় তখন এটিকে ট্রেন্ড ডাউন হিসাবে বিবেচনা করা হয়। MACD সূচকটি নির্ধারণ করে যে বাজারের গতিশীলতা যথেষ্ট প্রবণতা তৈরি করতে পারে কিনা।
এই সূচকগুলির সমন্বয়ে, আপনি ট্রেন্ড ব্রেকিং পয়েন্টগুলিকে একটি নির্ভরযোগ্য সময় হিসাবে চিহ্নিত করতে পারেন।
সামর্থ্য বিশ্লেষণ
এই কৌশলটির সবচেয়ে বড় সুবিধা হ’ল একক প্রযুক্তিগত সূচকের উপর নির্ভর না করে সিদ্ধান্ত নেওয়ার জন্য একাধিক সূচকের সংমিশ্রণ কার্যকরভাবে ভুল লেনদেনের সম্ভাবনা হ্রাস করতে পারে এবং ট্রেডিং সিগন্যালকে আরও নির্ভরযোগ্য করে তোলে। তদুপরি, গতিশীল সমন্বয় প্যারামিটারগুলি কৌশলটিকে বাজারের পরিবর্তনের সাথে খাপ খাইয়ে নিতে সক্ষম করে।
আরেকটি সুবিধা হল উচ্চ-ফ্রিকোয়েন্সি ট্রেডিং করা যায়। পরিসীমা ফিল্টার সূচকগুলি ছোট-চক্রের মূল্য পরিবর্তনের প্রতি সংবেদনশীল, যার অর্থ এই কৌশলটি স্বল্প সময়ের মধ্যে শান্তিপূর্ণ অবস্থান খুলতে পারে, তাই উচ্চ-ফ্রিকোয়েন্সির জন্য খুব উপযুক্ত এবং বৃহত্তর ওঠানামার ক্রিপ্টোকারেন্সি বাজারে লাভের অনুমতি দেয়।
ঝুঁকি বিশ্লেষণ
এই কৌশলটির কিছু ঝুঁকি রয়েছে। প্রথমত, প্রযুক্তিগত ফর্ম্যাট বিচার ব্যর্থ হওয়ার ঝুঁকি, কারণ সূচকগুলি 100% নিশ্চিত নয় যে দামের গতিপথ রয়েছে। যখন দামটি বিপরীত হয়, তখন স্টপ লস হতে পারে।
আরেকটি প্রধান ঝুঁকি হল যে পরিসীমা ফিল্টারের মধ্যবর্তী লাইনটি পুরোপুরি মূল্যের ঝাঁকুনিগুলিকে ফিল্টার করতে পারে না। যখন মধ্যবর্তী সীমার চেয়ে বড় দামের অস্থিরতা দেখা দেয়, তখন মধ্যবর্তী লাইনটি কার্যকর হবে না, যার ফলে ভুল সংকেত তৈরি হওয়ার ঝুঁকি রয়েছে। এই ক্ষেত্রে, প্যারামিটারগুলি যথাযথভাবে শিথিল করা এবং মধ্যবর্তী সীমার প্রসারিত করা যেতে পারে।
শেষ অবধি, উচ্চ-ফ্রিকোয়েন্সি ট্রেডিংয়ের নিজস্ব কিছু ঝুঁকি রয়েছে। যখন ট্রেডিং ফ্রিকোয়েন্সি খুব বেশি হয়, তখন ট্রেডিংয়ের ব্যয় বেশি হয়, যা মুনাফার কিছু অংশকে অফসেট করতে পারে। এই ক্ষেত্রে, ট্রেডিং ফ্রিকোয়েন্সি এবং পজিশন হোল্ডিংয়ের সময়কে যথাযথভাবে হ্রাস করা যেতে পারে।
কৌশল অপ্টিমাইজেশন
এই কৌশলটির আরও অপ্টিমাইজেশনের জায়গা রয়েছে। উদাহরণস্বরূপ, আরও সূচক যুক্ত করার কথা বিবেচনা করা যেতে পারে, যেমন প্রবণতা নিশ্চিত করার জন্য অস্থিরতার সূচক, ট্রেডিং সংকেতগুলি আরও নির্ভুল হওয়ার জন্য আরও কঠোর ফিল্টারিং শর্তাদি বাস্তবায়ন করা। বা বিভিন্ন ক্রিপ্টোকারেন্সি এবং স্টকগুলির দামের আচরণের নিয়মগুলি অধ্যয়ন করুন এবং তাদের জন্য সবচেয়ে উপযুক্ত সূচক প্যারামিটার সেট করুন।
ট্রেডিং লজিকের দিক থেকে, আপনি গতিশীল স্টপ লস এবং স্টপ লস প্রস্থও সেট করতে পারেন। অর্থাৎ, যখন আপনার অবস্থান বড় হয় তখন আপনার স্টপ লস প্রসারিত করুন এবং আরও বেশি মুনাফা লক করুন। অথবা যখন আপনার মুনাফা বেশি হয় তখন আপনার স্টপ লস গতি বাড়ান। এটি কিছুটা পরিমাণে প্রত্যাহার হ্রাস করতে পারে।
অবশেষে, ফিল্টার প্যারামিটারগুলিকে অপ্টিমাইজ করা যেতে পারে, এমন একটি প্যারামিটার খুঁজে বের করা যায় যাতে মধ্যম লাইন পরিসীমাটি কার্যকরভাবে ঝাঁকুনিগুলি ফিল্টার করতে পারে এবং প্রবণতা বিপরীত পয়েন্টগুলিকে যথাসম্ভব ধরা যায়। এর জন্য প্রচুর পরিমাণে পুনরাবৃত্তিমূলক ডেটা প্রয়োজন।
সারসংক্ষেপ
এই কৌশলটি একাধিক সূচকের সাথে বিচার করার জন্য সফলভাবে সংযুক্ত করা হয়েছে, উচ্চ নির্ভরযোগ্যতার ট্রেডিং কৌশল তৈরি করেছে, যা উচ্চ-ফ্রিকোয়েন্সি পরিমাণের ব্যবসায়ের জন্য উপযুক্ত। ক্রমাগত অপ্টিমাইজেশন এবং উন্নতির পরে, বিশ্বাস করা হয় যে স্থিতিশীল আয় অর্জন করা যেতে পারে, এটি আরও বিকাশের জন্য উপযুক্ত।
/*backtest
start: 2022-12-18 00:00:00
end: 2023-12-24 00:00:00
period: 1d
basePeriod: 1h
exchanges: [{"eid":"Futures_Binance","currency":"BTC_USDT"}]
*/

//@version=5
strategy(title='5cel Scalp Strategy BTCUSDT Long & Short 30 Min', shorttitle='BTCUSDT Long & Short Scalp 30m', precision=1, overlay=true)

//Swing Call - Based on RSI Overbought & Oversold
//#### Starts Here #####
ema_value = input(5)
sma_value = input(50)
ema1 = ta.ema(close, ema_value)
sma2 = ta.sma(close, sma_value)
rs = ta.rsi(close, 14)

iff_1 = high < sma2 ? color.red : color.yellow
iff_2 = low > sma2 ? color.lime : iff_1
mycolor = rs >= 85 or rs <= 15 ? color.yellow : iff_2

//For Main Strategy
bool swingCallGreen = false
bool swingCallRed = false
bool swingCallYellow = false

if rs >= 85 or rs <= 15
    //color.yellow
    swingCallGreen := false
    swingCallRed := false
    swingCallYellow := true
    swingCallYellow
else
    if low > sma2
        //color.lime
        swingCallGreen := true
        swingCallRed := false
        swingCallYellow := false
        swingCallYellow
        //color.red
    else if high < sma2
        swingCallGreen := false
        swingCallRed := true
        swingCallYellow := false
        swingCallYellow
    else
        //color.yellow
        swingCallGreen := false
        swingCallRed := false
        swingCallYellow := true
        swingCallYellow

hlong = input.int(80, title='Overbought limit of RSI', step=1)
ll = input.int(20, title='Oversold limit of RSI', step=1)

buyexit = ta.crossunder(rs, hlong)
sellexit = ta.crossover(rs, ll)

sellcall = ta.crossover(sma2, ema1) and open > close
buycall = ta.crossunder(sma2, ema1) and high > sma2
//#### Ends Here #####


//Parabolic SAR -  Trend Circles
//#### Starts Here #####
start = input.int(2, minval=0, maxval=10, title='Start - Default = 2 - Multiplied by .01')
increment = input.int(2, minval=0, maxval=10, title='Step Setting (Sensitivity) - Default = 2 - Multiplied by .01')
maximum = input.int(2, minval=1, maxval=10, title='Maximum Step (Sensitivity) - Default = 2 - Multiplied by .10')
sus = input(true, 'Show Up Trending Parabolic Sar')
sds = input(true, 'Show Down Trending Parabolic Sar')
disc = input(false, title='Start and Step settings are *.01 so 2 = .02 etc, Maximum Step is *.10 so 2 = .2')

startCalc = start * .01
incrementCalc = increment * .01
maximumCalc = maximum * .10

sarUp = ta.sar(startCalc, incrementCalc, maximumCalc)
sarDown = ta.sar(startCalc, incrementCalc, maximumCalc)

colUp = close >= sarDown ? color.lime : na
colDown = close <= sarUp ? color.red : na

parabolicSARGreen = ta.sar(startCalc, incrementCalc, maximumCalc)
parabolicSARRed = ta.sar(startCalc, incrementCalc, maximumCalc)
//#### Ends Here #####


//EMA Line
//#### Starts Here #####
ema100 = ta.ema(close, 100)
//#### Ends Here #####


// Ichimoku Cloud
//#### Starts Here #####
sCloud = input(false, 'Show Ichimoku lines')

// Colors
colorGreen = #00ff00
colorRed = #ff0000
colorTenkanViolet = #9400D3
colorKijun = #fdd8a0
colorLime = #006400
colorMaroon = #8b0000

//Periods are set to standard
tenkanPeriods = input.int(9, minval=1, title='Tenkan')
kijunPeriods = input.int(26, minval=1, title='Kijun')
chikouPeriods = input.int(52, minval=1, title='Chikou')
displacement = input.int(26, minval=1, title='Offset')

donchian(len) =>
    math.avg(ta.lowest(len), ta.highest(len))

tenkan = donchian(tenkanPeriods)
kijun = donchian(kijunPeriods)
senkouA = math.avg(tenkan, kijun)
senkouB = donchian(chikouPeriods)
displacedSenkouA = senkouA[displacement]
displacedSenkouB = senkouB[displacement]

bullishSignal = ta.crossover(tenkan, kijun)
bearishSignal = ta.crossunder(tenkan, kijun)

bullishSignalValues = bullishSignal ? tenkan : na
bearishSignalValues = bearishSignal ? tenkan : na


strongBullishSignal = bullishSignalValues > displacedSenkouA and bullishSignalValues > displacedSenkouB
neutralBullishSignal = bullishSignalValues > displacedSenkouA and bullishSignalValues < displacedSenkouB or bullishSignalValues < displacedSenkouA and bullishSignalValues > displacedSenkouB
weakBullishSignal = bullishSignalValues < displacedSenkouA and bullishSignalValues < displacedSenkouB

strongBearishSignal = bearishSignalValues < displacedSenkouA and bearishSignalValues < displacedSenkouB
neutralBearishSignal = bearishSignalValues > displacedSenkouA and bearishSignalValues < displacedSenkouB or bearishSignalValues < displacedSenkouA and bearishSignalValues > displacedSenkouB
weakBearishSignal = bearishSignalValues > displacedSenkouA and bearishSignalValues > displacedSenkouB
//#### Ends Here #####


//Higher High Lower Low Strategy
//#### Starts Here #####
lb = input.int(5, title='Left Bars', minval=1)
rb = input.int(5, title='Right Bars', minval=1)
showsupres = input.bool(true, title='Support/Resistance', inline='srcol')
supcol = input.color(color.lime, title='', inline='srcol')
rescol = input.color(color.red, title='', inline='srcol')
// srlinestyle = input.string(line.style_dotted, title='Line Style/Width', options=[line.style_solid, line.style_dashed, line.style_dotted], inline='style')
srlinewidth = input.int(3, title='', minval=1, maxval=5, inline='style')
changebarcol = input.bool(true, title='Change Bar Color', inline='bcol')
bcolup = input.color(color.blue, title='', inline='bcol')
bcoldn = input.color(color.black, title='', inline='bcol')

ph = ta.pivothigh(lb, rb)
pl = ta.pivotlow(lb, rb)

iff_3 = pl ? -1 : na  // Trend direction
hl = ph ? 1 : iff_3
iff_4 = pl ? pl : na  // similar to zigzag but may have multiple highs/lows
zz = ph ? ph : iff_4
valuewhen_1 = ta.valuewhen(hl, hl, 1)
valuewhen_2 = ta.valuewhen(zz, zz, 1)
zz := pl and hl == -1 and valuewhen_1 == -1 and pl > valuewhen_2 ? na : zz
valuewhen_3 = ta.valuewhen(hl, hl, 1)
valuewhen_4 = ta.valuewhen(zz, zz, 1)
zz := ph and hl == 1 and valuewhen_3 == 1 and ph < valuewhen_4 ? na : zz

valuewhen_5 = ta.valuewhen(hl, hl, 1)
valuewhen_6 = ta.valuewhen(zz, zz, 1)
hl := hl == -1 and valuewhen_5 == 1 and zz > valuewhen_6 ? na : hl
valuewhen_7 = ta.valuewhen(hl, hl, 1)
valuewhen_8 = ta.valuewhen(zz, zz, 1)
hl := hl == 1 and valuewhen_7 == -1 and zz < valuewhen_8 ? na : hl
zz := na(hl) ? na : zz

findprevious() =>  // finds previous three points (b, c, d, e)
    ehl = hl == 1 ? -1 : 1
    loc1 = 0.0
    loc2 = 0.0
    loc3 = 0.0
    loc4 = 0.0
    xx = 0
    for x = 1 to 1000 by 1
        if hl[x] == ehl and not na(zz[x])
            loc1 := zz[x]
            xx := x + 1
            break
    ehl := hl
    for x = xx to 1000 by 1
        if hl[x] == ehl and not na(zz[x])
            loc2 := zz[x]
            xx := x + 1
            break
    ehl := hl == 1 ? -1 : 1
    for x = xx to 1000 by 1
        if hl[x] == ehl and not na(zz[x])
            loc3 := zz[x]
            xx := x + 1
            break
    ehl := hl
    for x = xx to 1000 by 1
        if hl[x] == ehl and not na(zz[x])
            loc4 := zz[x]
            break
    [loc1, loc2, loc3, loc4]

float a = na
float b = na
float c = na
float d = na
float e = na
if not na(hl)
    [loc1, loc2, loc3, loc4] = findprevious()
    a := zz
    b := loc1
    c := loc2
    d := loc3
    e := loc4

_hh = zz and a > b and a > c and c > b and c > d
_ll = zz and a < b and a < c and c < b and c < d
_hl = zz and (a >= c and b > c and b > d and d > c and d > e or a < b and a > c and b < d)
_lh = zz and (a <= c and b < c and b < d and d < c and d < e or a > b and a < c and b > d)

plotshape(_hl, text='HL', title='Higher Low', style=shape.labelup, color=color.new(color.lime, 0), textcolor=color.new(color.black, 0), location=location.belowbar, offset=-rb)
plotshape(_hh, text='HH', title='Higher High', style=shape.labeldown, color=color.new(color.lime, 0), textcolor=color.new(color.black, 0), location=location.abovebar, offset=-rb)
plotshape(_ll, text='LL', title='Lower Low', style=shape.labelup, color=color.new(color.red, 0), textcolor=color.new(color.white, 0), location=location.belowbar, offset=-rb)
plotshape(_lh, text='LH', title='Lower High', style=shape.labeldown, color=color.new(color.red, 0), textcolor=color.new(color.white, 0), location=location.abovebar, offset=-rb)

float res = na
float sup = na
res := _lh ? zz : res[1]
sup := _hl ? zz : sup[1]

int trend = na
iff_5 = close < sup ? -1 : nz(trend[1])
trend := close > res ? 1 : iff_5

res := trend == 1 and _hh or trend == -1 and _lh ? zz : res
sup := trend == 1 and _hl or trend == -1 and _ll ? zz : sup
rechange = res != res[1]
suchange = sup != sup[1]

var line resline = na
var line supline = na
//#### Ends Here #####


//Range Filter 5Min
//#### Starts Here #####

src = input(defval=close, title='Source')
per = input.int(defval=100, minval=1, title='Sampling Period')

// Range Multiplier
mult = input.float(defval=3.0, minval=0.1, title='Range Multiplier')

// Smooth Average Range
smoothrng(x, t, m) =>
    wper = t * 2 - 1
    avrng = ta.ema(math.abs(x - x[1]), t)
    smoothrng = ta.ema(avrng, wper) * m
    smoothrng
smrng = smoothrng(src, per, mult)

// Range Filter
rngfilt(x, r) =>
    rngfilt = x
    rngfilt := x > nz(rngfilt[1]) ? x - r < nz(rngfilt[1]) ? nz(rngfilt[1]) : x - r : x + r > nz(rngfilt[1]) ? nz(rngfilt[1]) : x + r
    rngfilt
filt = rngfilt(src, smrng)

// Filter Direction
upward = 0.0
upward := filt > filt[1] ? nz(upward[1]) + 1 : filt < filt[1] ? 0 : nz(upward[1])
downward = 0.0
downward := filt < filt[1] ? nz(downward[1]) + 1 : filt > filt[1] ? 0 : nz(downward[1])

// Target Bands
hband = filt + smrng
lband = filt - smrng

// Colors
filtcolor = upward > 0 ? color.lime : downward > 0 ? color.red : color.orange
barcolor = src > filt and src > src[1] and upward > 0 ? color.lime : src > filt and src < src[1] and upward > 0 ? color.green : src < filt and src < src[1] and downward > 0 ? color.red : src < filt and src > src[1] and downward > 0 ? color.maroon : color.orange

// Break Outs
longCond = bool(na)
shortCond = bool(na)
longCond := src > filt and src > src[1] and upward > 0 or src > filt and src < src[1] and upward > 0
shortCond := src < filt and src < src[1] and downward > 0 or src < filt and src > src[1] and downward > 0

CondIni = 0
CondIni := longCond ? 1 : shortCond ? -1 : CondIni[1]
longCondition = longCond and CondIni[1] == -1
shortCondition = shortCond and CondIni[1] == 1
//#### Ends Here #####


//#### Starts Here #####
source = close
useCurrentRes = input(true, title='Use Current Chart Resolution?')
resCustom = input.timeframe(title='Use Different Timeframe? Uncheck Box Above', defval='60')
smd = input(true, title='Show MacD & Signal Line? Also Turn Off Dots Below')
sd = input(true, title='Show Dots When MacD Crosses Signal Line?')
sh = input(true, title='Show Histogram?')
macd_colorChange = input(true, title='Change MacD Line Color-Signal Line Cross?')
hist_colorChange = input(true, title='MacD Histogram 4 Colors?')

res1 = useCurrentRes ? timeframe.period : resCustom

fastLength = input.int(12, minval=1)
slowLength = input.int(26, minval=1)
signalLength = input.int(9, minval=1)

fastMA = ta.ema(source, fastLength)
slowMA = ta.ema(source, slowLength)

macd = fastMA - slowMA
signal = ta.sma(macd, signalLength)
hist = macd - signal

outMacD = request.security(syminfo.tickerid, res1, macd)
outSignal = request.security(syminfo.tickerid, res1, signal)
outHist = request.security(syminfo.tickerid, res1, hist)

histA_IsUp = outHist > outHist[1] and outHist > 0
histA_IsDown = outHist < outHist[1] and outHist > 0
histB_IsDown = outHist < outHist[1] and outHist <= 0
histB_IsUp = outHist > outHist[1] and outHist <= 0

//MacD Color Definitions
macd_IsAbove = outMacD >= outSignal
macd_IsBelow = outMacD < outSignal

plot_color = hist_colorChange ? histA_IsUp ? color.aqua : histA_IsDown ? color.blue : histB_IsDown ? color.red : histB_IsUp ? color.maroon : color.yellow : color.gray
macd_color = macd_colorChange ? macd_IsAbove ? color.lime : color.red : color.red
signal_color = macd_colorChange ? macd_IsAbove ? color.yellow : color.yellow : color.lime

circleYPosition = outSignal
//#### Ends Here #####


//////////////////
// Main Strategy
/////////////////
//#### Starts Here #####
var bottomText = 'Something is not ok'

bool rangeBuy = false
if longCondition
    rangeBuy := true
else
    rangeBuy := false

bool rangeSell = false
if shortCondition
    rangeSell := true
else
    rangeSell := false

bool ema100Bullish = false
bool ema100Bearish = false
bool ichimokuBearish = false
bool ichimokuBullish = false
string statusChance = 'Who knows what will happen'
string futureIchimokuTrend = 'Anything can happen'

if close > ema100
    ema100Bullish := true
    ema100Bearish := false
else
    ema100Bullish := false
    ema100Bearish := true

if displacedSenkouA > displacedSenkouB
    ichimokuBearish := false
    futureIchimokuTrend := 'Green - chance to go up'
    ichimokuBullish := true
else
    ichimokuBearish := true
    futureIchimokuTrend := 'Red - chance to go down'
    ichimokuBullish := false
    ichimokuBullish

if ema100Bullish and parabolicSARGreen
    if ichimokuBullish
        statusChance := '100%'
    else
        statusChance := '95%'
else
    if ema100Bullish and parabolicSARRed
        statusChance := '75%'
    else if ema100Bearish and parabolicSARGreen
        statusChance := '65%'
    else
        statusChance := '55%'

bool longTradePosition = false
bool shortTradePosition = false
string longTradeText = 'Now cannot say anything'

if (swingCallGreen or swingCallYellow) and ichimokuBullish and longCondition and ema100Bullish and parabolicSARGreen
    longTradePosition := true
    longTradeText := 'Bullish'

bottomText := longTradeText + ' Chance: ' + statusChance + '\n Future Trend: ' + futureIchimokuTrend
// Bottom Text

var tLog = table.new(position=position.bottom_right, rows=1, columns=2, bgcolor=color.blue, border_width=1)
table.cell(tLog, row=0, column=0, text=bottomText, text_color=color.white)
table.cell_set_text(tLog, row=0, column=0, text=bottomText)
//#### Ends Here #####

bool entryLongPosition = false
bool exitLongPosition = false

bool entryShortPosition = false
bool exitShortPosition = false

bool longPositionCount = false
bool shortPositionCount = false


if (strategy.position_size > 0)
    longPositionCount := true

if (strategy.position_size < 0)
    shortPositionCount := true

// Entry LONG
if (longCondition) and (not longPositionCount)
    entryLongPosition := true

// Exit LONG
if (shortCondition) and (longPositionCount)
    exitLongPosition := true

// Entry SHORT
if (shortCondition) and (not shortPositionCount)
    entryShortPosition := true

// Exit SHORT
if (longCondition) and (shortPositionCount)
    exitShortPosition := true

// LONG Entry & Exit
plotshape(entryLongPosition, style=shape.labeldown, location=location.abovebar, color=color.new(color.green, 0), size=size.tiny, title='buy label', text='5cel\nLONG Entry', textcolor=color.new(color.white, 0))
plotshape(exitLongPosition, style=shape.labelup, location=location.belowbar, color=color.new(color.blue, 0), size=size.tiny, title='sell label', text='5cel\nExit LONG', textcolor=color.new(color.white, 0))

//SHORT Entry & Exit
plotshape(entryShortPosition, style=shape.labeldown, location=location.abovebar, color=color.new(color.red, 0), size=size.tiny, title='buy label', text='5cel\nSHORT Entry', textcolor=color.new(color.white, 0))
plotshape(exitShortPosition, style=shape.labelup, location=location.belowbar, color=color.new(color.blue, 0), size=size.tiny, title='sell label', text='5cel\nExit SHORT', textcolor=color.new(color.white, 0))

//Get the Current Value
heikinashi_close = request.security(ticker.heikinashi(syminfo.tickerid), timeframe.period, close)

if entryLongPosition
    longLabel = label.new(bar_index, high, text=str.tostring(heikinashi_close, '0.00'), color=color.orange, style=label.style_label_down, yloc=yloc.abovebar)

if entryShortPosition
    shortLabel = label.new(bar_index, high, text=str.tostring(heikinashi_close, '0.00'), color=color.orange, style=label.style_label_down, yloc=yloc.abovebar)

/// SHORT Exit
strategy.close("short", when=exitShortPosition, comment="close_short_position")

/// LONG Exit
strategy.close("long", when=exitLongPosition, comment = "close_long_position")

/// LONG Enter
strategy.entry("long", strategy.long, when=entryLongPosition, comment="open_long_position")

/// SHORT Enter
strategy.entry("short", strategy.short, when = entryShortPosition, comment="open_short_position")