RSI সূচকের উপর ভিত্তি করে দীর্ঘ ট্রেন্ড অনুসরণকারী কৌশল
ওভারভিউ
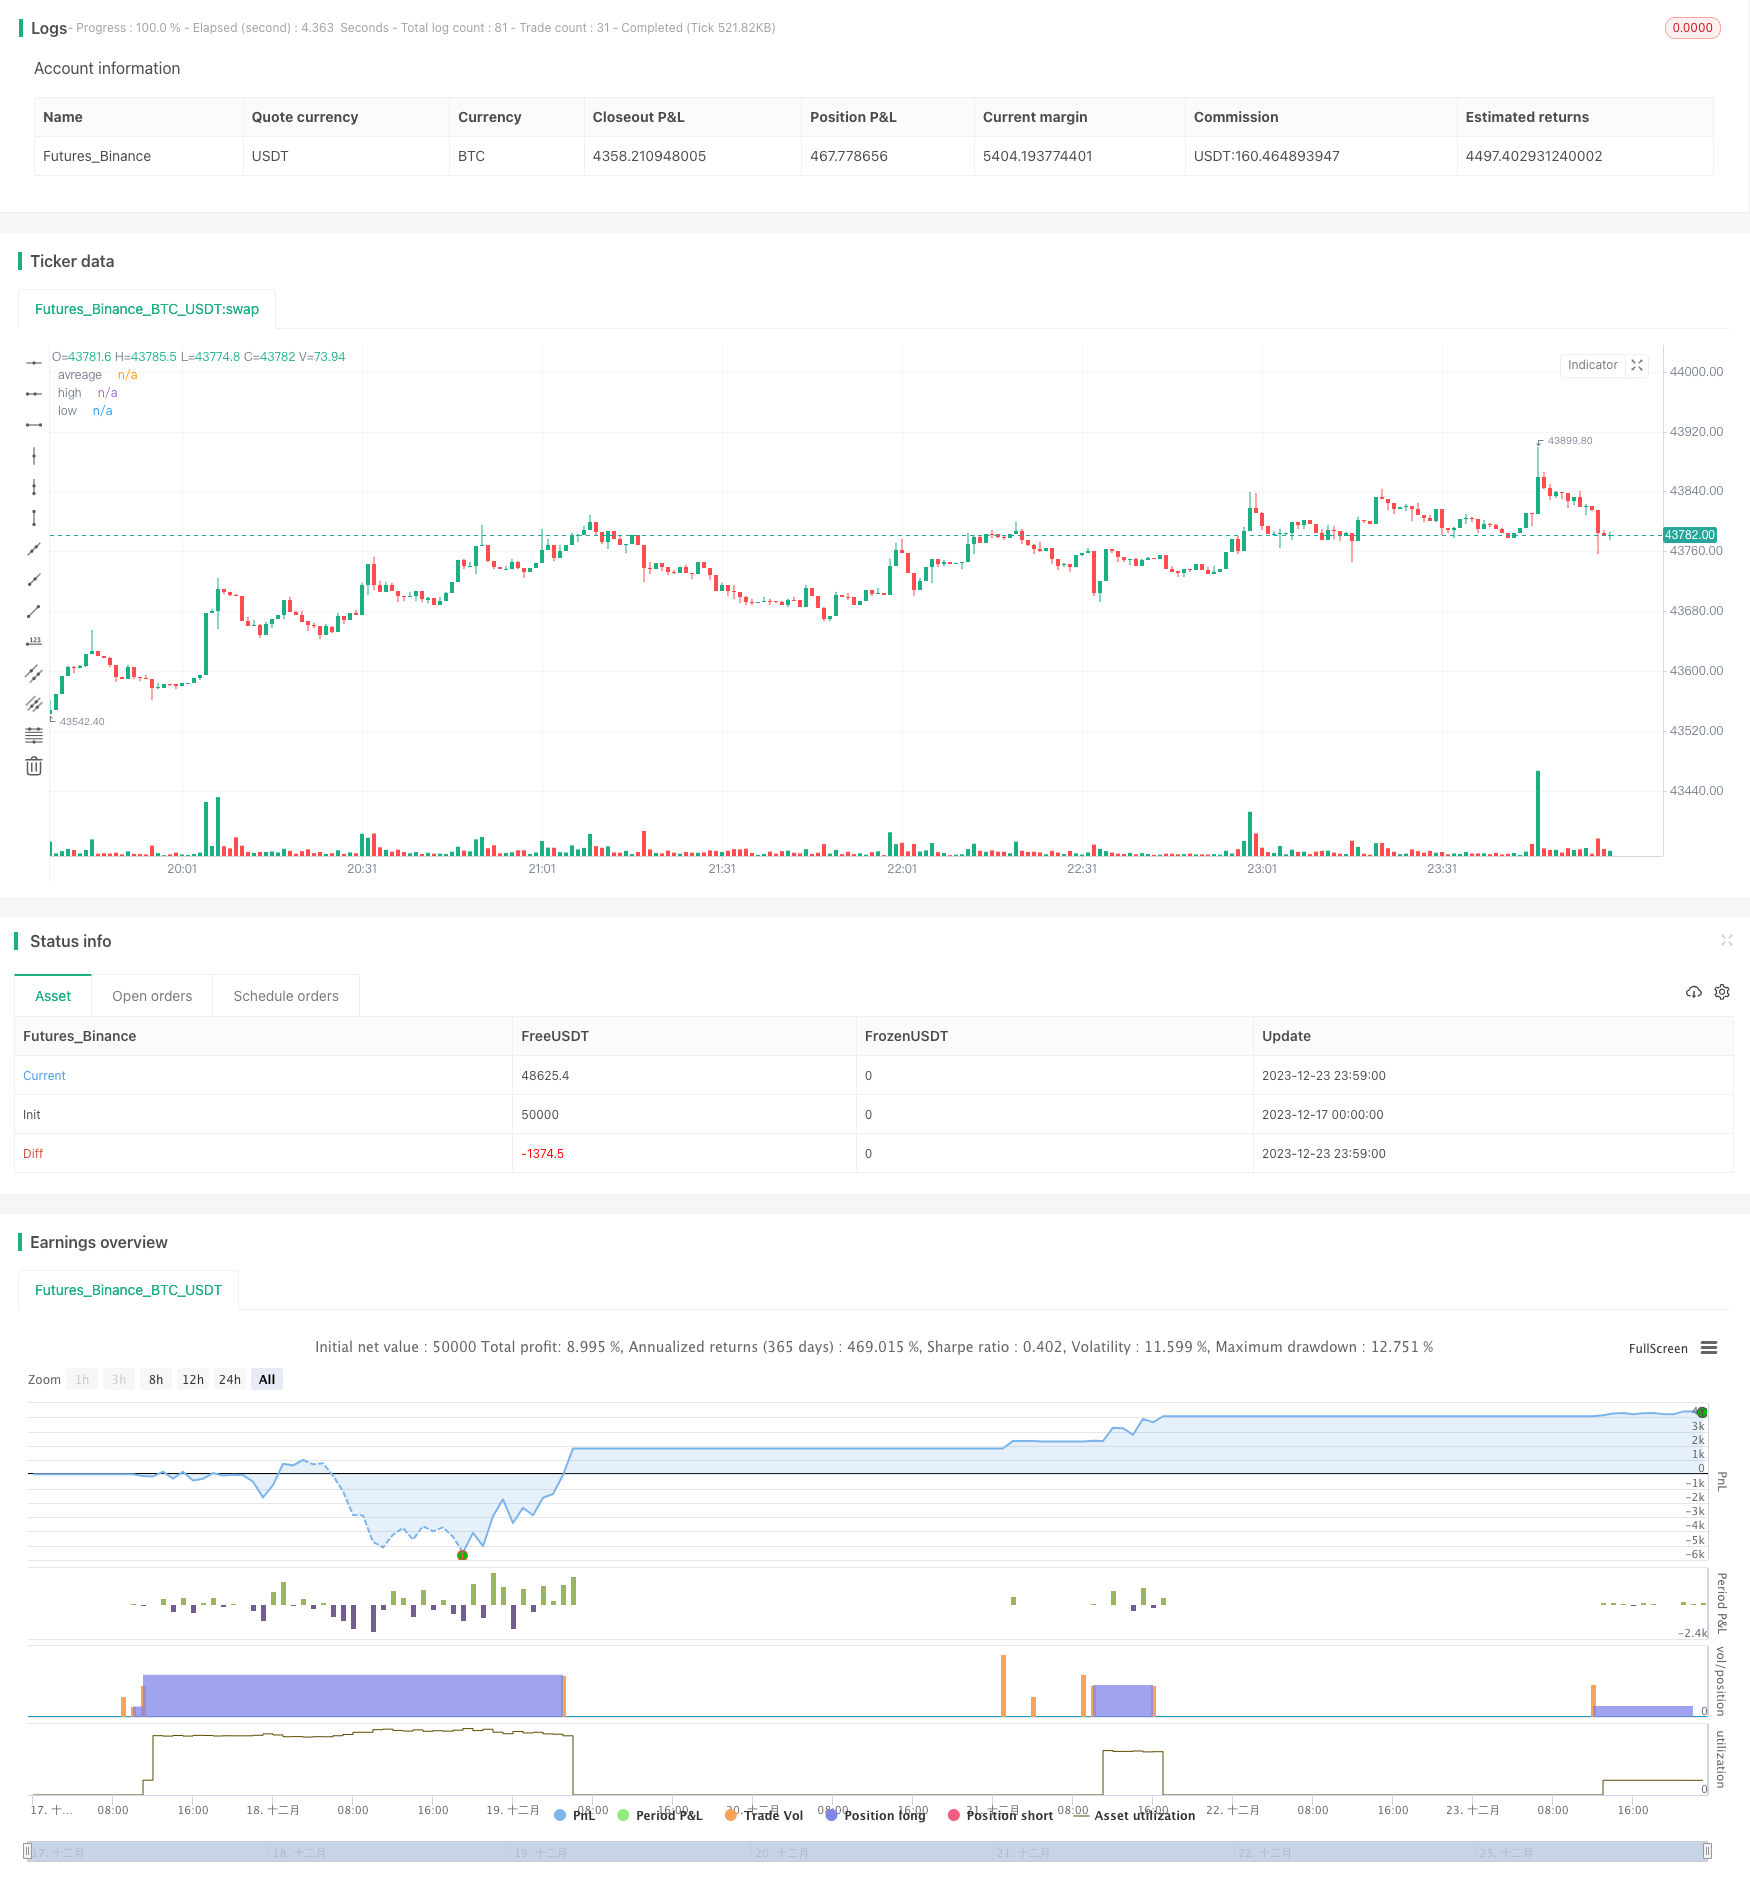
এই কৌশলটি তুলনামূলকভাবে দুর্বল সূচক ((আরএসআই) সূচকের উপর ভিত্তি করে ডিজাইন করা হয়েছে, আরএসআই নিম্নস্থানে কেনা, উচ্চস্থানে স্টপ লস স্টপগুলির জন্য মাল্টি-হেড ট্রেন্ড ট্র্যাকিং ট্রেডিং কৌশল। যখন আরএসআই সূচকটি ওভার-বই লাইনের নীচে থাকে তখন একটি কেনার সংকেত উত্পন্ন করে এবং যখন আরএসআই সূচকটি ওভার-বিক্রয় লাইনের উপরে থাকে তখন একটি বিক্রয় সংকেত উত্পন্ন করে। কৌশলটি ট্রেন্ড ট্র্যাকিংয়ের কার্যকারিতা অনুকূলিত করে, কার্যকরভাবে ট্রেডিং ঝুঁকি নিয়ন্ত্রণ করতে পারে।
কৌশল নীতি
এই কৌশলটি শেয়ারের দাম অত্যধিক বা অবমূল্যায়িত কিনা তা নির্ধারণের জন্য আরএসআই ব্যবহার করে। আরএসআই সূচকটি ওভারব্রিড ওভারসেল লাইনের সাথে মিলিত হয়ে একটি ক্রয় এবং বিক্রয় সংকেত তৈরি করে। বিশেষত, যদি আরএসআই সূচকটি 20 এর ওভারব্রিড লাইনটি অতিক্রম করে তবে এটি একটি ক্রয় সংকেত তৈরি করে; যদি আরএসআই সূচকটি 80 এর ওভারব্রিড লাইনটি অতিক্রম করে তবে এটি একটি বিক্রয় সংকেত তৈরি করে।
একাধিক পজিশনে প্রবেশের পরে, কৌশলটি নেমে যাওয়ার ঝুঁকি নিয়ন্ত্রণের জন্য একটি প্রাথমিক স্টপ লিন্ড সেট করে। একই সাথে দুটি ভিন্ন অনুপাতের স্টপ লিন্ড সেট করে, মুনাফা লক করার জন্য স্টপগুলিকে ব্যাপ্ত করে। বিশেষত, প্রথমে 50% স্টপ করুন, স্টপ মূল্যটি ক্রয় মূল্যের 3%; তারপরে অবশিষ্ট 50% স্টপ করুন, স্টপ মূল্যটি ক্রয় মূল্যের 5%।
এই কৌশলটি আরএসআই সূচকগুলিকে সংক্ষিপ্তভাবে এবং কার্যকরভাবে ব্যবহার করে বাজারে প্রবেশের সময় নির্ধারণ করে। স্টপ-অফ-লস সেটিংটি যুক্তিসঙ্গত এবং ঝুঁকি কার্যকরভাবে নিয়ন্ত্রণ করতে পারে।
কৌশলগত সুবিধা
- আরএসআই ব্যবহার করে খালি স্থান নির্ণয় করুন, অন্ধভাবে অতিরিক্ত কাজ করবেন না
- RSI সূচক প্যারামিটারগুলি অনুকূলিতকরণ করা হয়েছে, সূচকটি আরও কার্যকর
- ডাবল স্টপ স্টপগুলি যুক্তিসঙ্গতভাবে ডিজাইন করা হয়েছে যাতে আরও বেশি মুনাফা লক করতে পারে
- প্রাথমিক ও ধারাবাহিক বন্ধন বড় ক্ষতির প্রতিরোধ করে
ঝুঁকি বিশ্লেষণ
- মাল্টি-হ্যান্ড স্ট্র্যাটেজি, টিকতে পারে না সুদ বাজার
- RSI সূচকটি ভুল সংকেত প্রেরণের সম্ভাবনা রয়েছে, সংকেতটি ভুলভাবে বিচার করা ক্ষতি বাড়িয়ে তুলতে পারে
- স্টপপয়েন্টের গভীরতা অপ্রতিরোধ্য ঝুঁকি সৃষ্টি করে
- হারের মাত্রা বাড়ানোর জন্য হারের সংখ্যা এবং অনুপাতের সীমাবদ্ধতার অভাব
অপ্টিমাইজেশান দিক
- RSI সংকেত ফিল্টার করুন, অন্যান্য সূচকগুলির সাথে মিলিত হয়ে, সংকেতের নির্ভুলতা বাড়ান
- সংযোজন করা হয়েছে কতবার এবং কত শতাংশ জমা করা হবে তার উপর সীমাবদ্ধতা
- বিভিন্ন RSI প্যারামিটারের প্রভাব পরীক্ষা করা
- স্টপ লস স্টপ পয়েন্ট অপ্টিমাইজ করুন, ঝুঁকি হ্রাস করুন
সারসংক্ষেপ
এই কৌশলটি আরএসআই সূচক ব্যবহার করে ট্রেডিংয়ের সিদ্ধান্ত নেয়, স্টপ-অফ-লস সেটিংটি যুক্তিসঙ্গত। ট্রেডিংয়ের প্রবণতা কার্যকরভাবে বিচার করতে পারে, ট্রেডিংয়ের ঝুঁকি নিয়ন্ত্রণ করতে পারে, একাধিক হেড ট্র্যাকিং কৌশল হিসাবে ব্যবহারের জন্য উপযুক্ত। সংকেত ফিল্টারিং, প্যারামিটার টেস্টিং, স্টপ-অফ অপ্টিমাইজেশন ইত্যাদির মাধ্যমে কৌশলটির স্থায়িত্ব আরও বাড়ানো যায়।
/*backtest
start: 2023-12-17 00:00:00
end: 2023-12-24 00:00:00
period: 1m
basePeriod: 1m
exchanges: [{"eid":"Futures_Binance","currency":"BTC_USDT"}]
*/

// This source code is subject to the terms of the Mozilla Public License 2.0 at https://mozilla.org/MPL/2.0/

//@version=5

strategy(title='RSI Long Strategy', overlay=true, pyramiding=5, initial_capital=10000, default_qty_type=strategy.percent_of_equity, default_qty_value=100, calc_on_order_fills=false, slippage=0, commission_type=strategy.commission.percent, commission_value=0.075)
strat_dir_input = input.string(title='Strategy Direction', defval='long', options=['long', 'short', 'all'])
strat_dir_value = strat_dir_input == 'long' ? strategy.direction.long : strat_dir_input == 'short' ? strategy.direction.short : strategy.direction.all
strategy.risk.allow_entry_in(strat_dir_value)
//INPUTS


length = input(21)
overSold = input(20)
overBought = input(80)
p = close

vrsi = ta.rsi(p, length)
price = close
var bool long = na
var bool short = na

long := ta.crossover(vrsi, overSold)
short := ta.crossunder(vrsi, overBought)

var float last_open_long = na
var float last_open_short = na

last_open_long := long ? close : nz(last_open_long[1])
last_open_short := short ? close : nz(last_open_short[1])
mpoint=(last_open_long+last_open_short)/2

entry_value = last_open_long
entry_value1 = last_open_short

// Rounding levels to min tick
nround(x) =>
    n = math.round(x / syminfo.mintick) * syminfo.mintick
    n
//
disp_panels = input(true, title='Display info panels?')
fibs_label_off = input(40, title='fibs label offset')
fibs_label_size = input.string(size.normal, options=[size.tiny, size.small, size.normal, size.large, size.huge], title='fibs label size')
r1_x = timenow + math.round(ta.change(time) * fibs_label_off)
r1_y = last_open_short
text1 = 'High : ' + str.tostring(nround(last_open_short))
s1_y = last_open_long
text3 = 'low : ' + str.tostring(nround(last_open_long))

R1_label = disp_panels ? label.new(x=r1_x, y=r1_y, text=text1, xloc=xloc.bar_time, yloc=yloc.price, color=color.orange, style=label.style_label_down, textcolor=color.black, size=fibs_label_size) : na
S1_label = disp_panels ? label.new(x=r1_x, y=s1_y, text=text3, xloc=xloc.bar_time, yloc=yloc.price, color=color.lime, style=label.style_label_up, textcolor=color.black, size=fibs_label_size) : na

label.delete(R1_label[1])
label.delete(S1_label[1])
//
plot(mpoint, title='avreage', color=color.new(color.red, 40), style=plot.style_linebr, linewidth=3, trackprice=true, offset=-9999)
plot(last_open_short, title='high', color=color.new(color.red, 40), style=plot.style_linebr, linewidth=3, trackprice=true, offset=-9999)
plot(last_open_long, title='low', color=color.new(color.blue, 40), style=plot.style_linebr, linewidth=3, trackprice=true, offset=-9999)
//
trend = input(false)
if barstate.islast and trend == true
    line z = line.new(bar_index[1], last_open_short[1], bar_index, last_open_short, extend=extend.both, color=color.red, style=line.style_dashed, width=1)
    line f = line.new(bar_index[1], mpoint[1], bar_index, mpoint, extend=extend.both, color=color.blue, style=line.style_dashed, width=1)
    line w = line.new(bar_index[1], last_open_long[1], bar_index, last_open_long, extend=extend.both, color=color.green, style=line.style_dashed, width=1)
    line.delete(z[1])
    line.delete(f[1])
    line.delete(w[1])

//bu = ta.crossover(close, mpoint)
//sz = ta.crossunder(close, mpoint)
//bu1 = ta.crossover(close, last_open_short)
sz1 = ta.crossunder(close, last_open_short)
bu2 = ta.crossover(close, last_open_long)
//sz2 = ta.crossunder(close, last_open_long)
//plotshape(sz, style=shape.triangledown, location=location.abovebar, color=color.new(color.orange, 0), size=size.tiny)
//plotshape(bu, style=shape.triangleup, location=location.belowbar, color=color.new(color.blue, 0), size=size.tiny)
//plotshape(sz1, style=shape.triangledown, location=location.abovebar, color=color.new(color.red, 0), size=size.tiny)
//plotshape(bu1, style=shape.triangleup, location=location.belowbar, color=color.new(color.green, 0), size=size.tiny)
//plotshape(sz2, style=shape.triangledown, location=location.abovebar, color=color.new(color.red, 0), size=size.tiny)
//plotshape(bu2, style=shape.triangleup, location=location.belowbar, color=color.new(color.green, 0), size=size.tiny)

l = bu2
s = sz1
if l
    strategy.entry('buy', strategy.long)
if s
    strategy.entry('sell', strategy.short)
per(pcnt) =>
    strategy.position_size != 0 ? math.round(pcnt / 100 * strategy.position_avg_price / syminfo.mintick) : float(na)
stoploss = input.float(title=' stop loss', defval=5, minval=0.01)
los = per(stoploss)
q1 = input.int(title=' qty_percent1', defval=50, minval=1)
q2 = input.int(title=' qty_percent2', defval=50, minval=1)
tp1 = input.float(title=' Take profit1', defval=3, minval=0.01)
tp2 = input.float(title=' Take profit2', defval=5, minval=0.01)
//tp4 = input.float(title=' Take profit4', defval=5, minval=0.01)
strategy.exit('x1', qty_percent=q1, profit=per(tp1), loss=los)
strategy.exit('x2', qty_percent=q2, profit=per(tp2), loss=los)