পরিমাণগত সূচকের উপর ভিত্তি করে বিটকয়েন ট্রেডিং কৌশল
ওভারভিউ
এই কৌশলটি বিটকয়েন কেনার সময় নির্ধারণের জন্য বিভিন্ন পরিমাণগত সূচক ব্যবহার করে, স্বয়ংক্রিয় লেনদেনের জন্য। প্রধানত হুল সূচক ((Hull), তুলনামূলকভাবে দুর্বল সূচক ((RSI), বুলিন ব্যান্ড ((BB) এবং লেনদেনের পরিমাণ ওসিলার ((VO)) ।
কৌশল নীতি
সংশোধিত হের চলমান গড় ব্যবহার করে বাজারের প্রধান প্রবণতা দিক নির্ণয় করা হয়, ব্রিনের বন্ডের সহায়তায় ক্রস-বিক্রয়-বিক্রয় পয়েন্ট নির্ণয় করা হয়।
আরএসআই সূচকটি ওভার-বই ওভার-সোল্ড অঞ্চল নির্ধারণের জন্য স্ব-অনুকূলিতকরণ পরিসরের সাথে একত্রিত হয়ে একটি লেনদেনের সংকেত দেয়। একই সাথে ডুপ্লিকেট সংকেত যাচাইকরণের জন্য দুটি প্যারামিটার সেট করা হয়েছে।
স্টপ লস / স্টপ লস অনুপাত প্যারামিটার অনুযায়ী স্টপ লস স্টপ সেট করুন এবং ঝুঁকি ব্যবস্থাপনা করুন।
সামর্থ্য বিশ্লেষণ
হেরের বক্ররেখা ট্রেন্ডের রূপান্তরকে আরও দ্রুত ধরতে পারে, এবং ব্রিনের সহায়ক বিচারটি মিথ্যা সংকেত হ্রাস করতে পারে।
RSI সূচক প্যারামিটার অপ্টিমাইজেশন সেট এবং ডুপ্লিকেট সংকেত যাচাইকরণ, উচ্চ নির্ভরযোগ্যতা।
লেনদেনের পরিমাণ ওজিলার প্রবণতা এবং সূচক সংকেত একত্রিত করে, যা অযৌক্তিক লেনদেন এড়াতে পারে।
প্রিসেট স্টপ লস স্টপ পদ্ধতি স্বয়ংক্রিয়ভাবে একক ক্ষতি নিয়ন্ত্রণ করে এবং সামগ্রিক ঝুঁকি কার্যকরভাবে নিয়ন্ত্রণ করে।
ঝুঁকি বিশ্লেষণ
প্যারামিটার সেটিং ভুল হলে ট্রেডিং ফ্রিকোয়েন্সি বা সিগন্যাল ইফেক্টের ত্রুটি হতে পারে।
হঠাৎ কোনো ঘটনা বাজারকে তীব্রভাবে ওঠানামা করার ফলে, স্টপ লস অতিক্রম করা হতে পারে, যার ফলে বড় ধরনের ক্ষতি হতে পারে।
ট্রেডিং জাতের বিনিময়ে অন্যান্য মুদ্রায়, প্যারামিটারগুলি পুনরায় পরীক্ষা এবং অপ্টিমাইজ করার প্রয়োজন।
যখন লেনদেনের পরিমাণের তথ্য অনুপস্থিত থাকে, লেনদেনের পরিমাণের ওসিলারটি ব্যর্থ হয়।
অপ্টিমাইজেশান দিক
আরএসআই প্যারামিটারগুলির জন্য আরও সমন্বয় পরীক্ষা করুন এবং সর্বোত্তম প্যারামিটারগুলি সন্ধান করুন।
আরএসআই এর সাথে ম্যাকড, কেডি ইত্যাদির মতো অন্যান্য সূচকগুলি চেষ্টা করুন, যা সংকেতের নির্ভুলতা বাড়ায়।
মডেল পূর্বাভাস মডিউল যোগ করা হয়েছে, যা মেশিন লার্নিংয়ের সাথে মার্কেটের দিকনির্দেশনা নির্ধারণ করে।
অন্যান্য ট্রেডিং প্রজাতির পরামিতিগুলির প্রভাব পরীক্ষা করুন।
“অতিরিক্ত ক্ষতিগ্রস্তদের জন্য, আমরা আমাদের কর্মজীবনকে আরও উন্নত করতে পারি।
সারসংক্ষেপ
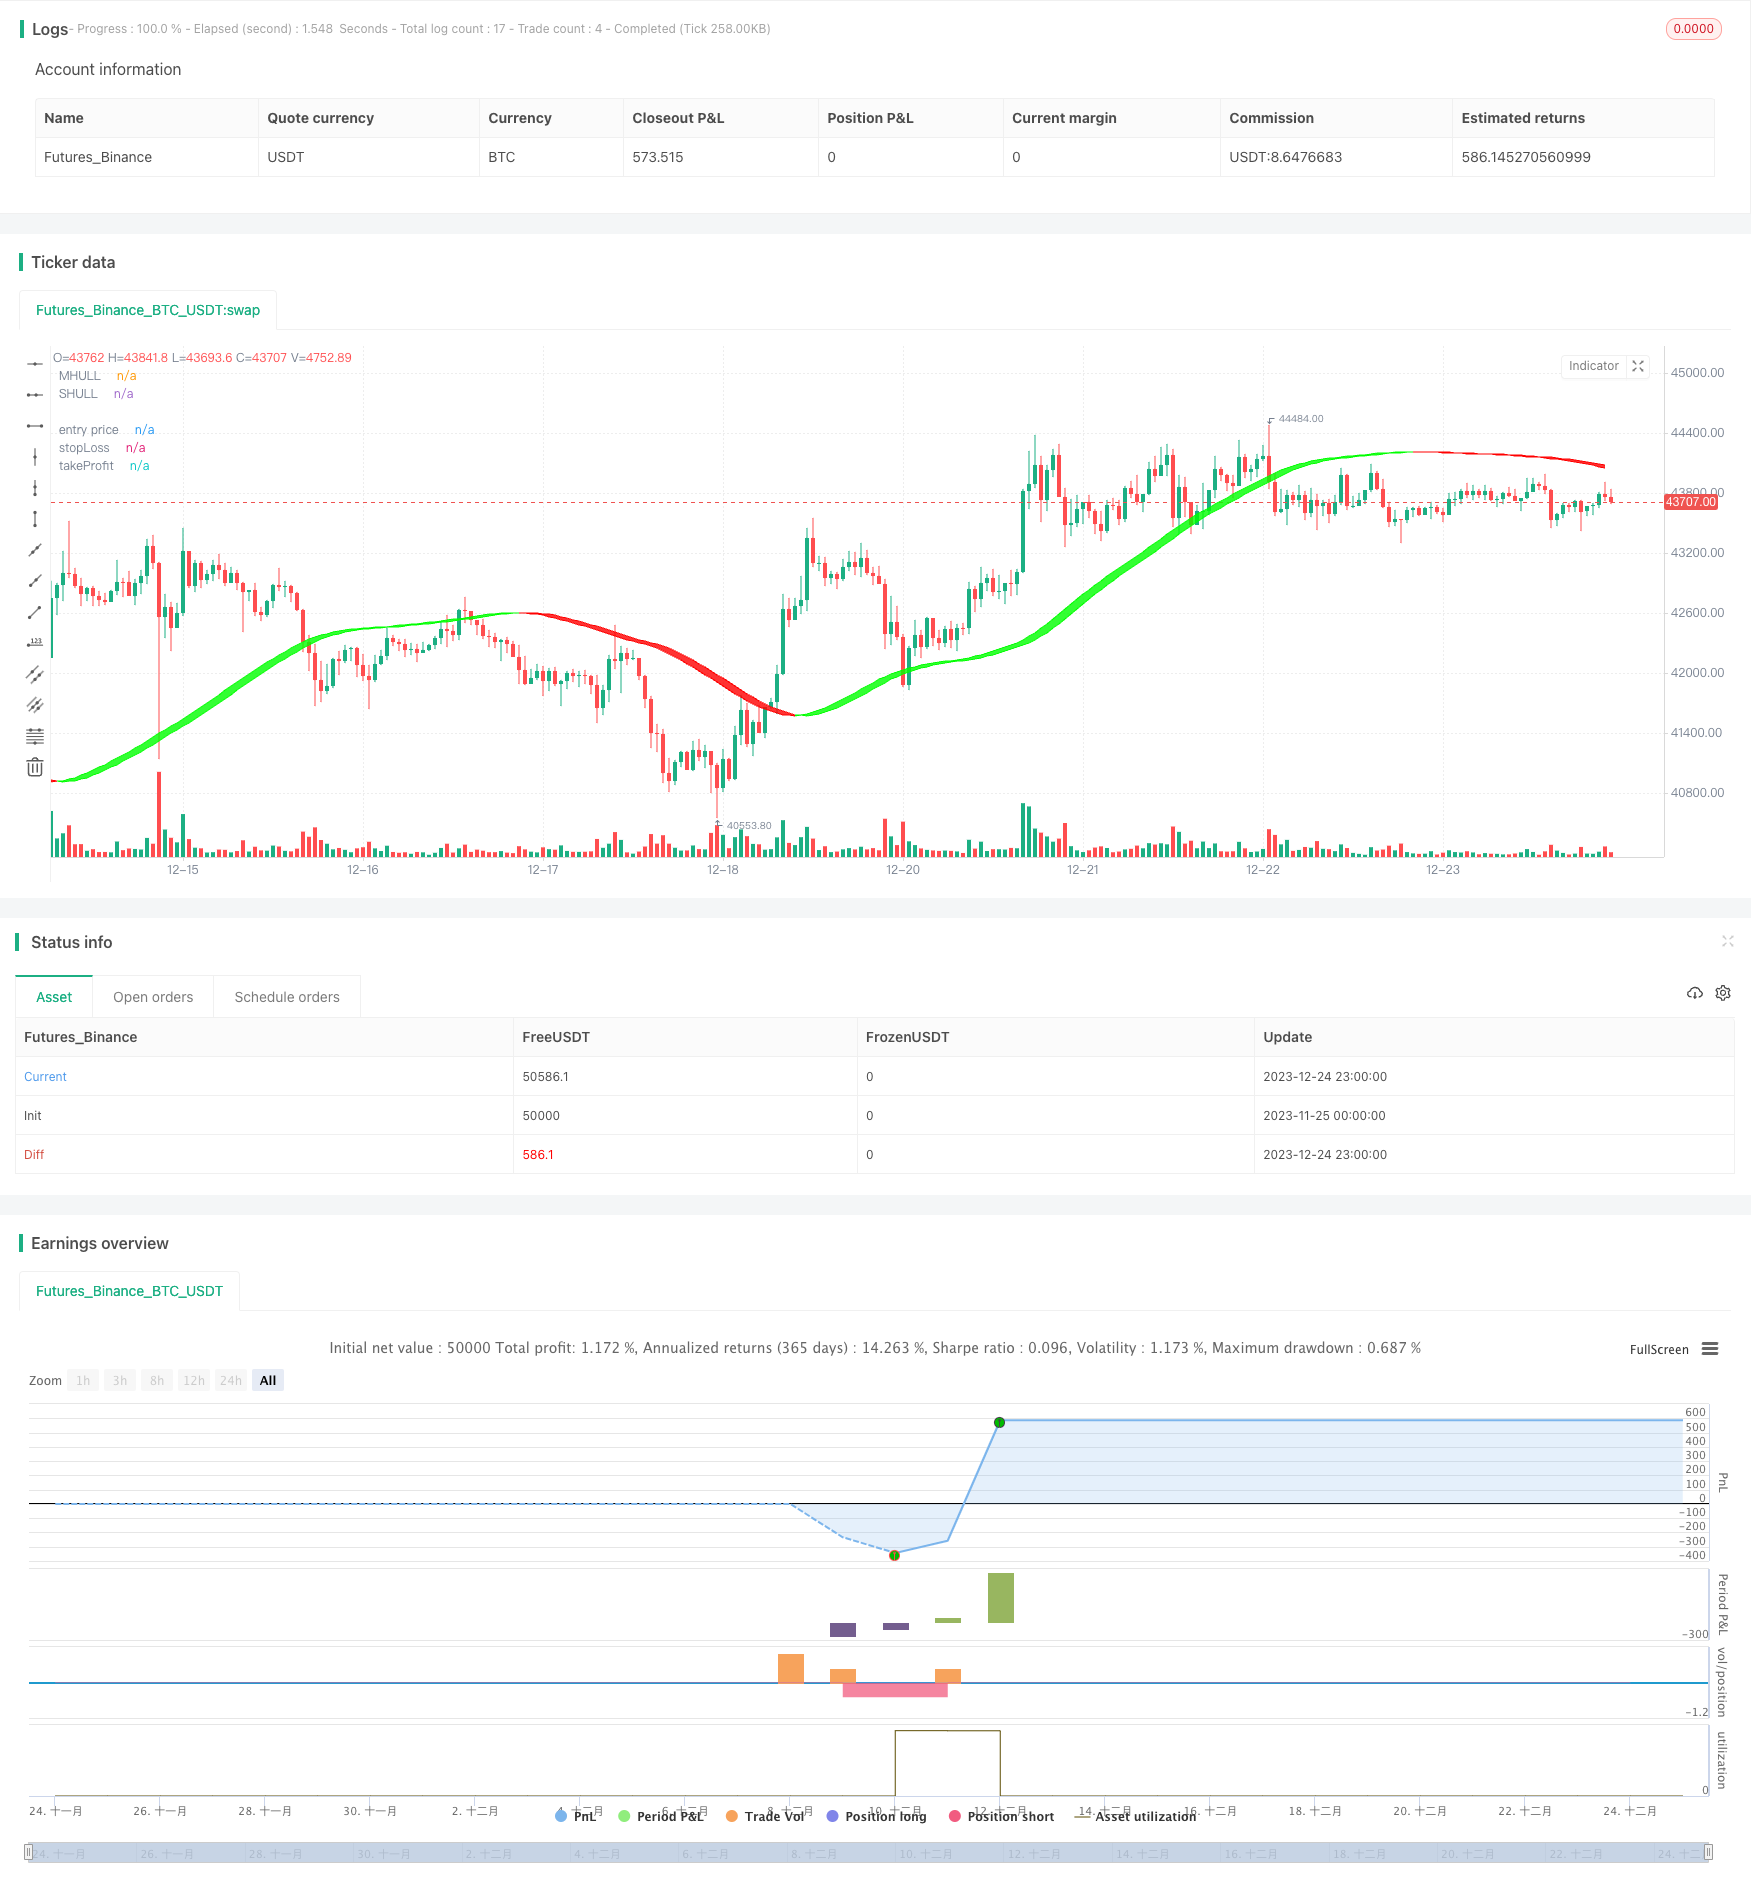
এই কৌশলটি ক্রয়-বিক্রয় সময় নির্ধারণের জন্য একাধিক পরিমাণগত প্রযুক্তিগত সূচক ব্যবহার করে। প্যারামিটার অপ্টিমাইজেশন, ঝুঁকি নিয়ন্ত্রণ এবং অন্যান্য পদ্ধতির মাধ্যমে বিটকয়েনের স্বয়ংক্রিয় লেনদেন বাস্তবায়িত হয়েছে। কার্যকারিতা ভাল, তবে বাজারের পরিবর্তনের সাথে খাপ খাইয়ে নিতে ক্রমাগত পরীক্ষা এবং অপ্টিমাইজেশন প্রয়োজন। বিনিয়োগকারীদের জন্য রেফারেন্স সরবরাহ করতে পারে, লেনদেনের সিদ্ধান্তে সহায়তা করতে পারে।
/*backtest
start: 2023-11-25 00:00:00
end: 2023-12-25 00:00:00
period: 1h
basePeriod: 15m
exchanges: [{"eid":"Futures_Binance","currency":"BTC_USDT"}]
*/


// © maxencetajet

//@version=5
strategy("Strategy Crypto", overlay=true, initial_capital=1000, default_qty_type=strategy.fixed, default_qty_value=0.5, slippage=25)

src1 = input.source(close, title="Source")
target_stop_ratio = input.float(title='Risk/Reward', defval=1.5, minval=0.5, maxval=100)

startDate = input.int(title='Start Date', defval=1, minval=1, maxval=31, group="beginning Backtest")
startMonth = input.int(title='Start Month', defval=5, minval=1, maxval=12, group="beginning Backtest")
startYear = input.int(title='Start Year', defval=2022, minval=2000, maxval=2100, group="beginning Backtest")

inDateRange = time >= timestamp(syminfo.timezone, startYear, startMonth, startDate, 0, 0)

swingHighV = input.int(7, title="Swing High", group="number of past candles")
swingLowV = input.int(7, title="Swing Low", group="number of past candles")

//Hull Suite

modeSwitch = input.string("Hma", title="Hull Variation", options=["Hma", "Thma", "Ehma"], group="Hull Suite")
length = input(60, title="Length", group="Hull Suite")
lengthMult = input(3, title="Length multiplier", group="Hull Suite")

HMA(_src1, _length) =>
    ta.wma(2 * ta.wma(_src1, _length / 2) - ta.wma(_src1, _length), math.round(math.sqrt(_length)))

EHMA(_src1, _length) =>
    ta.ema(2 * ta.ema(_src1, _length / 2) - ta.ema(_src1, _length), math.round(math.sqrt(_length)))

THMA(_src1, _length) =>
    ta.wma(ta.wma(_src1, _length / 3) * 3 - ta.wma(_src1, _length / 2) - ta.wma(_src1, _length), _length)

Mode(modeSwitch, src1, len) =>
    modeSwitch == 'Hma' ? HMA(src1, len) : modeSwitch == 'Ehma' ? EHMA(src1, len) : modeSwitch == 'Thma' ? THMA(src1, len / 2) : na

_hull = Mode(modeSwitch, src1, int(length * lengthMult))
HULL = _hull
MHULL = HULL[0]
SHULL = HULL[2]

hullColor = HULL > HULL[2] ? #00ff00 : #ff0000

Fi1 = plot(MHULL, title='MHULL', color=hullColor, linewidth=1, transp=50)
Fi2 = plot(SHULL, title='SHULL', color=hullColor, linewidth=1, transp=50)
fill(Fi1, Fi2, title='Band Filler', color=hullColor, transp=40)

//QQE MOD

RSI_Period = input(6, title='RSI Length', group="QQE MOD")
SF = input(5, title='RSI Smoothing', group="QQE MOD")
QQE = input(3, title='Fast QQE Factor', group="QQE MOD")
ThreshHold = input(3, title='Thresh-hold', group="QQE MOD")

src = input(close, title='RSI Source', group="QQE MOD")

Wilders_Period = RSI_Period * 2 - 1

Rsi = ta.rsi(src, RSI_Period)
RsiMa = ta.ema(Rsi, SF)
AtrRsi = math.abs(RsiMa[1] - RsiMa)
MaAtrRsi = ta.ema(AtrRsi, Wilders_Period)
dar = ta.ema(MaAtrRsi, Wilders_Period) * QQE

longband = 0.0
shortband = 0.0
trend = 0

DeltaFastAtrRsi = dar
RSIndex = RsiMa
newshortband = RSIndex + DeltaFastAtrRsi
newlongband = RSIndex - DeltaFastAtrRsi
longband := RSIndex[1] > longband[1] and RSIndex > longband[1] ? math.max(longband[1], newlongband) : newlongband
shortband := RSIndex[1] < shortband[1] and RSIndex < shortband[1] ? math.min(shortband[1], newshortband) : newshortband
cross_1 = ta.cross(longband[1], RSIndex)
trend := ta.cross(RSIndex, shortband[1]) ? 1 : cross_1 ? -1 : nz(trend[1], 1)
FastAtrRsiTL = trend == 1 ? longband : shortband

length1 = input.int(50, minval=1, title='Bollinger Length', group="QQE MOD")
mult = input.float(0.35, minval=0.001, maxval=5, step=0.1, title='BB Multiplier', group="QQE MOD")
basis = ta.sma(FastAtrRsiTL - 50, length1)
dev = mult * ta.stdev(FastAtrRsiTL - 50, length1)
upper = basis + dev
lower = basis - dev
color_bar = RsiMa - 50 > upper ? #00c3ff : RsiMa - 50 < lower ? #ff0062 : color.gray

QQEzlong = 0
QQEzlong := nz(QQEzlong[1])
QQEzshort = 0
QQEzshort := nz(QQEzshort[1])
QQEzlong := RSIndex >= 50 ? QQEzlong + 1 : 0
QQEzshort := RSIndex < 50 ? QQEzshort + 1 : 0

RSI_Period2 = input(6, title='RSI Length', group="QQE MOD")
SF2 = input(5, title='RSI Smoothing', group="QQE MOD")
QQE2 = input(1.61, title='Fast QQE2 Factor', group="QQE MOD")
ThreshHold2 = input(3, title='Thresh-hold', group="QQE MOD")

src2 = input(close, title='RSI Source', group="QQE MOD")

Wilders_Period2 = RSI_Period2 * 2 - 1

Rsi2 = ta.rsi(src2, RSI_Period2)
RsiMa2 = ta.ema(Rsi2, SF2)
AtrRsi2 = math.abs(RsiMa2[1] - RsiMa2)
MaAtrRsi2 = ta.ema(AtrRsi2, Wilders_Period2)
dar2 = ta.ema(MaAtrRsi2, Wilders_Period2) * QQE2
longband2 = 0.0
shortband2 = 0.0
trend2 = 0

DeltaFastAtrRsi2 = dar2
RSIndex2 = RsiMa2
newshortband2 = RSIndex2 + DeltaFastAtrRsi2
newlongband2 = RSIndex2 - DeltaFastAtrRsi2
longband2 := RSIndex2[1] > longband2[1] and RSIndex2 > longband2[1] ? math.max(longband2[1], newlongband2) : newlongband2
shortband2 := RSIndex2[1] < shortband2[1] and RSIndex2 < shortband2[1] ? math.min(shortband2[1], newshortband2) : newshortband2
cross_2 = ta.cross(longband2[1], RSIndex2)
trend2 := ta.cross(RSIndex2, shortband2[1]) ? 1 : cross_2 ? -1 : nz(trend2[1], 1)
FastAtrRsi2TL = trend2 == 1 ? longband2 : shortband2

QQE2zlong = 0
QQE2zlong := nz(QQE2zlong[1])
QQE2zshort = 0
QQE2zshort := nz(QQE2zshort[1])
QQE2zlong := RSIndex2 >= 50 ? QQE2zlong + 1 : 0
QQE2zshort := RSIndex2 < 50 ? QQE2zshort + 1 : 0

hcolor2 = RsiMa2 - 50 > ThreshHold2 ? color.silver : RsiMa2 - 50 < 0 - ThreshHold2 ? color.silver : na

Greenbar1 = RsiMa2 - 50 > ThreshHold2
Greenbar2 = RsiMa - 50 > upper

Redbar1 = RsiMa2 - 50 < 0 - ThreshHold2
Redbar2 = RsiMa - 50 < lower

//Volume Oscillator

var cumVol = 0.
cumVol += nz(volume)
if barstate.islast and cumVol == 0
    runtime.error("No volume is provided by the data vendor.")
shortlen = input.int(5, minval=1, title = "Short Length", group="Volume Oscillator")
longlen = input.int(10, minval=1, title = "Long Length", group="Volume Oscillator")
short = ta.ema(volume, shortlen)
long = ta.ema(volume, longlen)
osc = 100 * (short - long) / long

//strategy

enterLong   =  '    {  "message_type": "bot",  "bot_id": 4635591,  "email_token": "25byourtefcodeuufyd2-43314-ab98-bjorg224",  "delay_seconds": 1}  ' //start long deal

ExitLong    =  '    {  "message_type": "bot",  "bot_id": 4635591,  "email_token": "25byourtefcodeuufyd2-43314-ab98-bjorg224",  "delay_seconds": 0,  "action": "close_at_market_price"}  ' // close long deal market

enterShort  =  '    {  "message_type": "bot",  "bot_id": 4635690,  "email_token": "25byourtefcodeuufyd2-43314-ab98-bjorg224",  "delay_seconds": 1}  ' // start short deal

ExitShort   =  '    {  "message_type": "bot",  "bot_id": 4635690,  "email_token": "25byourtefcodeuufyd2-43314-ab98-bjorg224",  "delay_seconds": 0,  "action": "close_at_market_price"}  ' // close short deal market

longcondition = close > MHULL and HULL > HULL[2] and osc > 0 and Greenbar1 and Greenbar2 and not Greenbar1[1] and not Greenbar2[1]
shortcondition = close < SHULL and HULL < HULL[2] and osc > 0 and Redbar1 and Redbar2 and not Redbar1[1] and not Redbar2[1]

float risk_long = na
float risk_short = na
float stopLoss = na
float takeProfit = na
float entry_price = na

risk_long := risk_long[1]
risk_short := risk_short[1]

swingHigh = ta.highest(high, swingHighV)
swingLow = ta.lowest(low, swingLowV)

if strategy.position_size == 0 and longcondition and inDateRange
    risk_long := (close - swingLow) / close
    strategy.entry("long", strategy.long, comment="Buy", alert_message=enterLong)

if strategy.position_size == 0 and shortcondition and inDateRange
    risk_short := (swingHigh - close) / close
    strategy.entry("short", strategy.short, comment="Sell", alert_message=enterShort)

if strategy.position_size > 0

    stopLoss := strategy.position_avg_price * (1 - risk_long)
    takeProfit := strategy.position_avg_price * (1 + target_stop_ratio * risk_long)
    entry_price := strategy.position_avg_price
    strategy.exit("long exit", "long", stop = stopLoss, limit = takeProfit, alert_message=ExitLong)

if strategy.position_size < 0

    stopLoss := strategy.position_avg_price * (1 + risk_short)
    takeProfit := strategy.position_avg_price * (1 - target_stop_ratio * risk_short)
    entry_price := strategy.position_avg_price
    strategy.exit("short exit", "short", stop = stopLoss, limit = takeProfit, alert_message=ExitShort)

p_ep = plot(entry_price, color=color.new(color.white, 0), linewidth=2, style=plot.style_linebr, title='entry price')
p_sl = plot(stopLoss, color=color.new(color.red, 0), linewidth=2, style=plot.style_linebr, title='stopLoss')
p_tp = plot(takeProfit, color=color.new(color.green, 0), linewidth=2, style=plot.style_linebr, title='takeProfit')
fill(p_sl, p_ep, color.new(color.red, transp=85))
fill(p_tp, p_ep, color.new(color.green, transp=85))