ট্র্যাকিং সুপার ট্রেন্ড কৌশল
ওভারভিউ
এই কৌশলটি একটি ট্র্যাকিং-টাইপ সুপারট্রেন্ড কৌশল, যার মূল ধারণাটি হল বিভিন্ন প্যারামিটার সেটিংয়ের সাথে সুপারট্রেন্ড সূচকগুলিকে একত্রিত করে ট্র্যাকিংয়ের প্রভাব অর্জন করা এবং ফিল্টার সূচকগুলি ব্যবহার করে ঝুঁকি নিয়ন্ত্রণের জন্য। কৌশলটির মূল ধারণাটি সহজ, সহজেই বোঝা যায় এবং শিক্ষানবিসদের জন্য উপযুক্ত।
কৌশল নীতি
এই কৌশলটি মূলত তিনটি গ্রুপের বিভিন্ন প্যারামিটার সেট করা সুপারট্রেন্ডিং সূচক নিয়ে গঠিত। প্রথম গ্রুপের প্রধান সুপারট্রেন্ডিং সূচকগুলি মূলত বাজারের প্রবণতার দিকনির্দেশের জন্য ডিফল্ট প্যারামিটারগুলি গ্রহণ করে; দ্বিতীয় গ্রুপের উপ-সুপারট্রেন্ডিং সূচকগুলি এটিআর চক্র হ্রাস করে এবং এটিআর গুণক বাড়িয়ে আরও সংবেদনশীলভাবে দামের পরিবর্তনগুলি ট্র্যাক করতে সক্ষম হয়। তৃতীয় গ্রুপের ফিল্টার সুপারট্রেন্ডিং সূচকগুলি যথাযথভাবে এটিআর চক্র এবং এটিআর গুণক বাড়িয়ে মিথ্যা বিরতিগুলি ফিল্টার করার জন্য ব্যবহৃত হয়।
যখন প্রধান সুপারট্রেন্ডটি একটি কেনার সংকেত দেয়, তখন যদি সাব-সুপারট্রেন্ডটিও একই সাথে সংকেত দেয় এবং ফিল্টার সুপারট্রেন্ডের দিকটি উত্থান হয় তবে কৌশলটি অনুসরণ করে কেনা; যখন প্রধান সুপারট্রেন্ডটি একটি বিক্রয় সংকেত দেয়, তখন যদি সাব-সুপারট্রেন্ডটিও একই সাথে সংকেত দেয় এবং ফিল্টার সুপারট্রেন্ডের দিকটি হ্রাস পায়, তবে কৌশলটি অনুসরণ করে বিক্রি করা হয়। এটি মূল প্রবণতা ক্যাপচার করার নিশ্চয়তা দেওয়ার সাথে সাথে সাব-সুপারট্রেন্ডের সূচকটি ব্যবহার করে সূক্ষ্মভাবে সূক্ষ্ম সামঞ্জস্যের ট্র্যাকিং করতে পারে, যাতে সময়মতো প্রবেশ এবং স্টপ লস করা যায়।
কৌশলগত সুবিধা
- কৌশলগুলি সহজ, স্পষ্ট এবং সহজেই বোঝা যায়, যা নতুনদের জন্য উপযুক্ত
- কৌশলগত প্যারামিটারগুলি যুক্তিসঙ্গতভাবে সেট করা যাতে কার্যকরভাবে ট্রেডিং এবং ঝুঁকি নিয়ন্ত্রণ করা যায়
- কৌশলগত সংকেত বেশি নির্ভুল, বিজয়ী হার বেশি
- বিভিন্ন প্যারামিটার সমন্বয় দ্বারা ট্র্যাকিং
- ফিল্টার ব্যবস্থা যুক্ত করা হয়েছে যাতে ভুয়া সংকেতগুলি কার্যকরভাবে ফিল্টার করা যায় এবং ঝুঁকি নিয়ন্ত্রণ করা যায়
কৌশলগত ঝুঁকি
- শেয়ারের সিস্টেমিক ঝুঁকি
- সুপার ট্রেন্ডিং সূচক কিছু বাজারে পিছিয়ে থাকতে পারে
- এটিআর সূচক দ্বারা ব্যবহৃত প্যারামিটারগুলির ভুল সেটিং কৌশলগত সংকেতকে বিভ্রান্ত করতে পারে
- কৌশলগত লেনদেনের পরিমাণ কম হলে, সম্পূর্ণ পজিশন বন্ধ করা কঠিন হতে পারে
প্রধান ঝুঁকি প্রতিরোধ ব্যবস্থাঃ
- ভাল লিকুইডিটি এবং উচ্চ অস্থিরতা সহ স্টক নির্বাচন করুন
- উপযুক্ত অপ্টিমাইজেশান প্যারামিটার, সম্ভাব্য পিছিয়ে পড়া হ্রাস
- প্যারামিটার টেস্টিং অপ্টিমাইজ করা হয়েছে, সিগন্যালের নির্ভুলতা উন্নত করা হয়েছে
- ট্রেডিং ভলিউম যথাযথভাবে বৃদ্ধি করুন এবং স্টপ লস স্পেস নিশ্চিত করুন
কৌশল অপ্টিমাইজেশনের দিকনির্দেশনা
- বিভিন্ন ATR চক্রের প্যারামিটার সমন্বয় পরীক্ষা করুন, ট্র্যাকিং কার্যকারিতা অপ্টিমাইজ করুন
- ATR এর পরিবর্তে অন্য কোন volatility indicator ব্যবহার করুন
- সুপারট্রেন্ডের সমন্বয় বৃদ্ধি বা হ্রাস, পরীক্ষার ফলাফল
- অন্যান্য পরিমাপের সাথে সংকেত ফিল্টারিং অপ্টিমাইজ করার চেষ্টা করুন
- বিভিন্ন ক্ষতি প্রতিরোধ পদ্ধতি পরীক্ষা করে সেরা সমাধান খুঁজুন
সারসংক্ষেপ
এই কৌশলটির সামগ্রিক ধারণাটি পরিষ্কার এবং সহজ, বিভিন্ন প্যারামিটার সেট করা একাধিক সুপার ট্রেন্ড সূচকগুলি একে অপরের সাথে সমন্বয় করে, প্রবেশের ট্র্যাকিং এবং ঝুঁকি নিয়ন্ত্রণের জন্য। কৌশল সংকেতগুলি আরও সুনির্দিষ্ট, রিয়েল-ডিস্কে আরও ভাল পারফরম্যান্স করে, শিক্ষানবিসদের জন্য উপযুক্ত এবং বিভিন্ন সূচক এবং প্যারামিটারগুলির পরীক্ষার অপ্টিমাইজেশনের জন্য টেমপ্লেট হিসাবেও ব্যবহার করা যেতে পারে। এটি একটি সুপার ট্রেন্ড কৌশল যা সুপারিশ করা হয়।
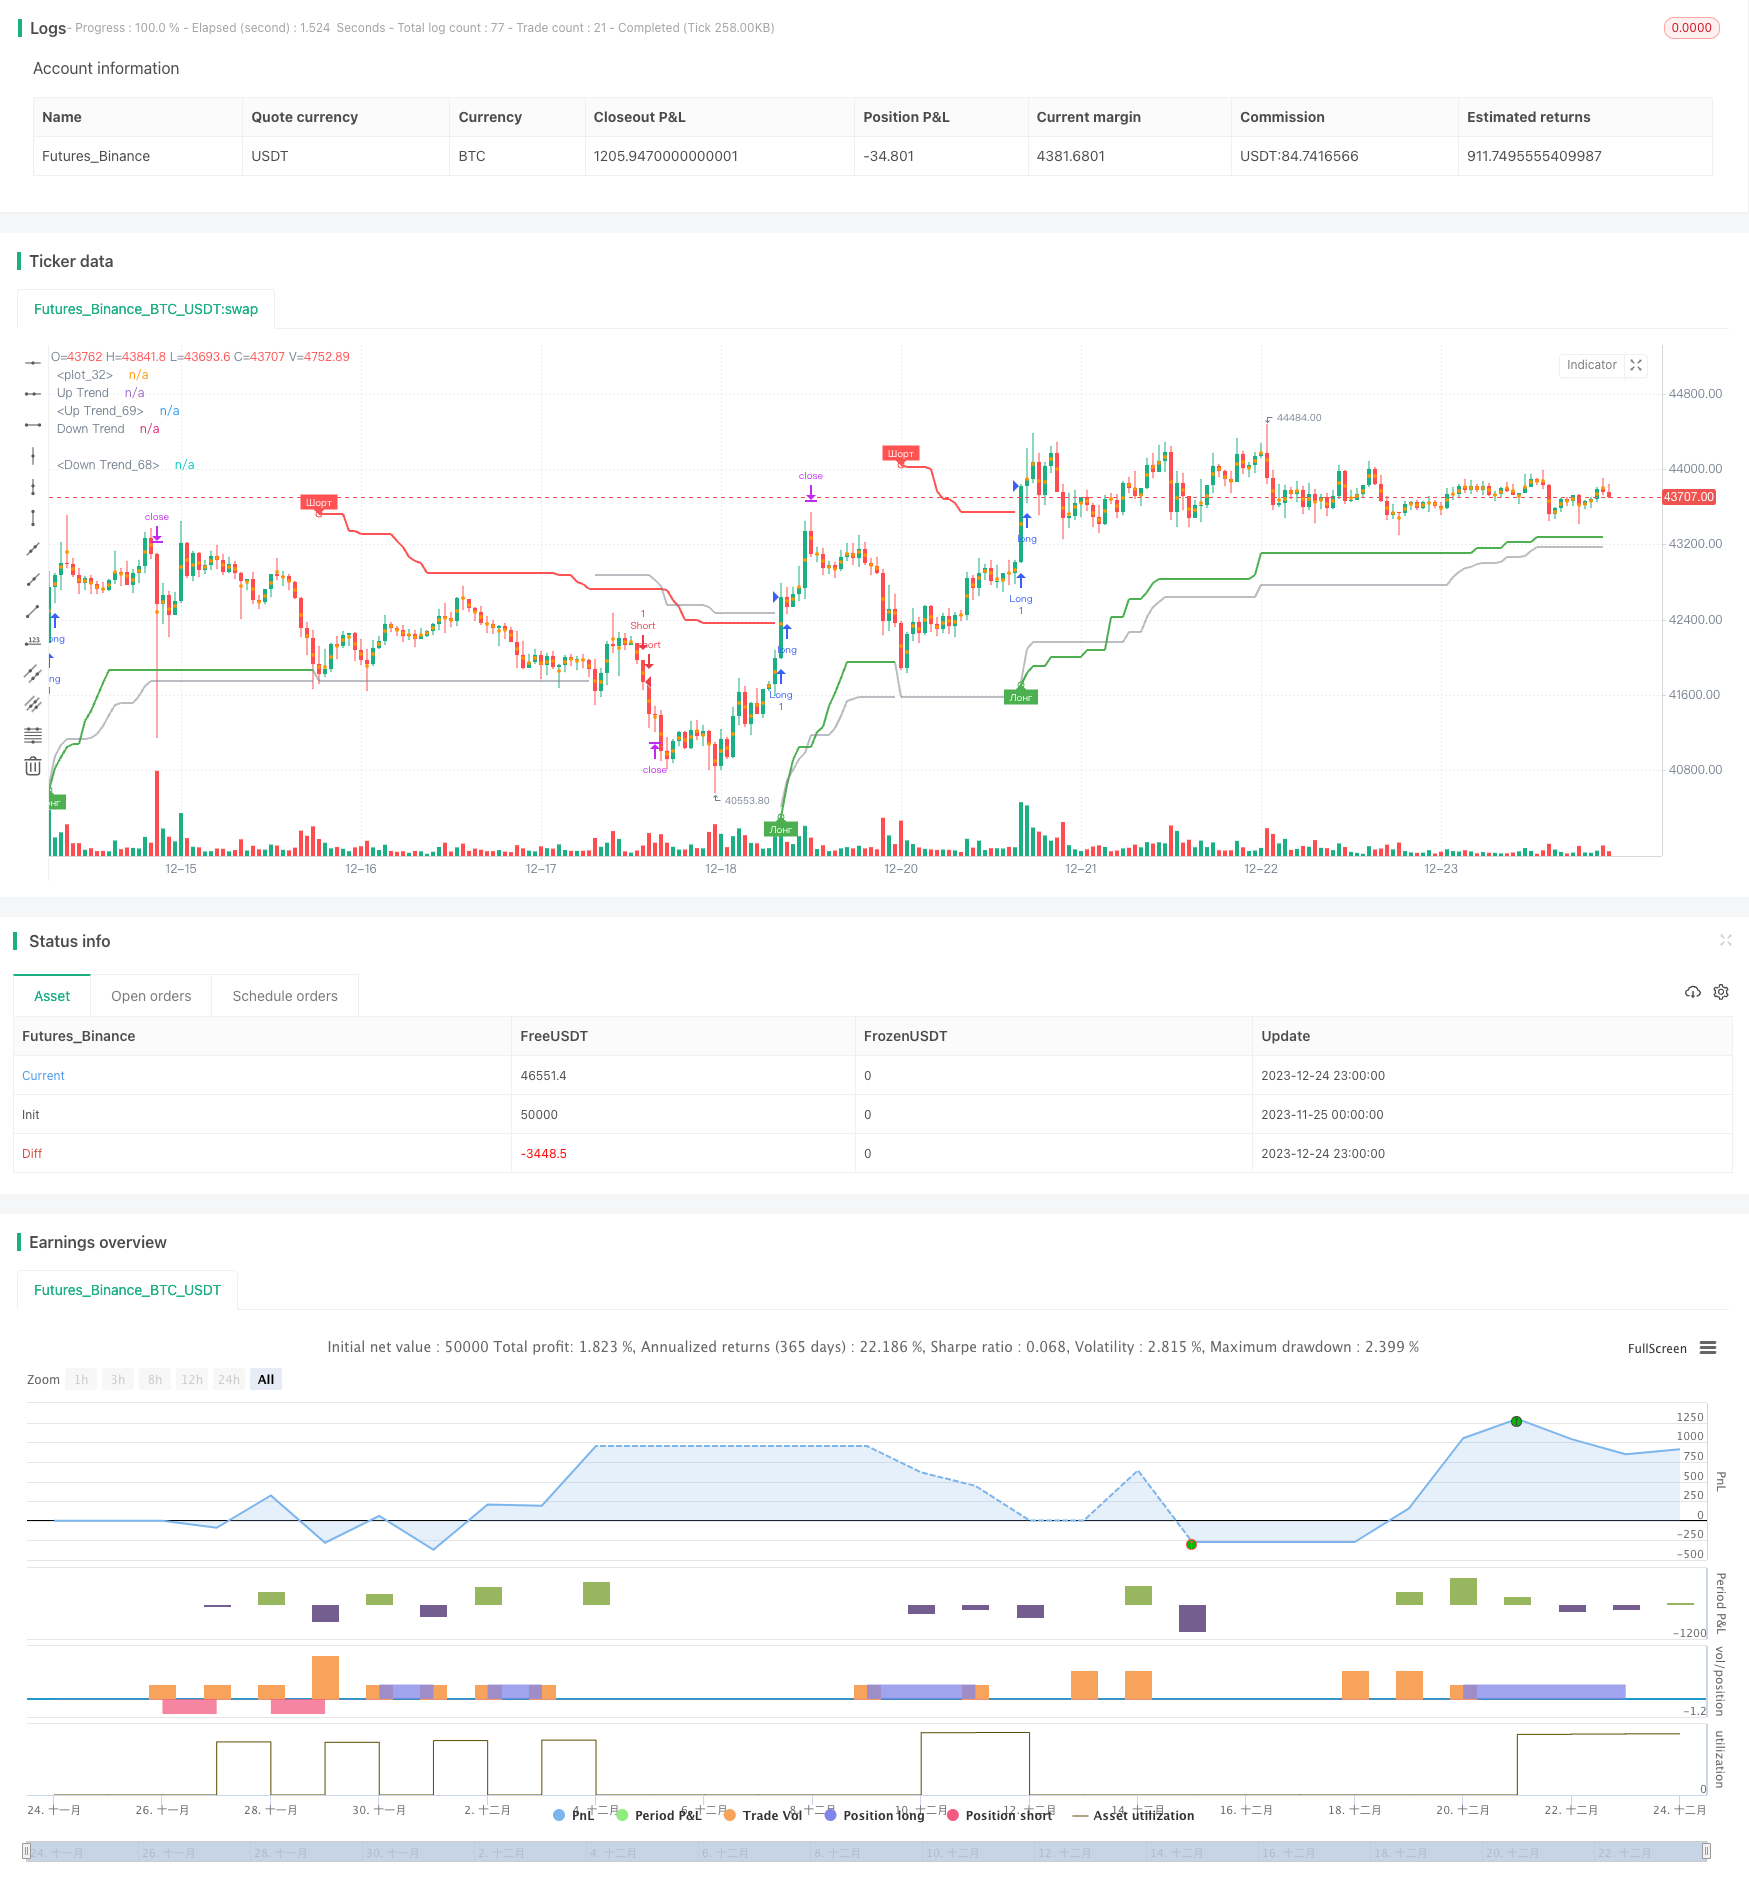
/*backtest
start: 2023-11-25 00:00:00
end: 2023-12-25 00:00:00
period: 1h
basePeriod: 15m
exchanges: [{"eid":"Futures_Binance","currency":"BTC_USDT"}]
*/

//@version=4
strategy("Supertrend TEST 2 Strategy", overlay = true, format=format.price, precision=2)

Periods = input(title="ATR Period", type=input.integer, defval=4)
src = input(hl2, title="Source")
Multiplier = input(title="ATR Multiplier", type=input.float, step=0.1, defval=4.7)
changeATR= input(title="Change ATR Calculation Method ?", type=input.bool, defval=true)
showsignals = input(title="Show Buy/Sell Signals ?", type=input.bool, defval=true)
highlighting = input(title="Highlighter On/Off ?", type=input.bool, defval=true)
tp=close
sl=close

atr2 = sma(tr, Periods)
atr= changeATR ? atr(Periods) : atr2
up=src-(Multiplier*atr)
up1 = nz(up[1],up)
up := close[1] > up1 ? max(up,up1) : up
dn=src+(Multiplier*atr)
dn1 = nz(dn[1], dn)
dn := close[1] < dn1 ? min(dn, dn1) : dn
trend = 1
trend := nz(trend[1], trend)
trend := trend == -1 and close > dn1 ? 1 : trend == 1 and close < up1 ? -1 : trend
upPlot = plot(trend == 1 ? up : na, title="Up Trend", style=plot.style_linebr, linewidth=2, color=color.green)
buySignal = trend == 1 and trend[1] == -1
plotshape(buySignal ? up : na, title="UpTrend Begins", location=location.absolute, style=shape.circle, size=size.tiny, color=color.green )
plotshape(buySignal and showsignals ? up : na, title="Лонг", text="Лонг", location=location.absolute, style=shape.labelup, size=size.tiny, color=color.green, textcolor=color.white )
dnPlot = plot(trend == 1 ? na : dn, title="Down Trend", style=plot.style_linebr, linewidth=2, color=color.red)
sellSignal = trend == -1 and trend[1] == 1
plotshape(sellSignal ? dn : na, title="DownTrend Begins", location=location.absolute, style=shape.circle, size=size.tiny, color=color.red )
plotshape(sellSignal and showsignals ? dn : na, title="Шорт", text="Шорт", location=location.absolute, style=shape.labeldown, size=size.tiny, color=color.red, textcolor=color.white )
mPlot = plot(ohlc4, title="", style=plot.style_circles, linewidth=0)
longFillColor = highlighting ? (trend == 1 ? color.green : color.white) : color.white
shortFillColor = highlighting ? (trend == -1 ? color.red : color.white) : color.white

sPeriods=input(title="ATR Period", type=input.integer, defval=8)
sMultiplier=input(title="dop ATR Multiplier", type=input.float, step=0.1, defval=1.5)
satr2 = sma(tr, sPeriods)
satr= changeATR ? atr(sPeriods) : satr2
ssup=ohlc4-(sMultiplier*satr)
ssup1 = nz(ssup[1],ssup)
ssup := close[1] > ssup1 ? max(ssup,ssup1) : ssup
sdn=ohlc4+(sMultiplier*satr)
sdn1 = nz(sdn[1], sdn)
sdn := close[1] < sdn1 ? min(sdn, sdn1) : sdn
strend = 1
strend := nz(strend[1], strend)
strend := strend == -1 and close > sdn1 ? 1 : strend == 1 and close < ssup1 ? -1 : strend
sbuySignal = strend == 1 and strend[1] == -1
ssellSignal = strend == -1 and strend[1] == 1

fPeriods=input(title="ATR Period", type=input.integer, defval=10)
fMultiplier=input(title="filter ATR Multiplier", type=input.float, step=0.1, defval=5)
fatr2 = sma(tr, fPeriods)
fatr= changeATR ? atr(fPeriods) : fatr2
fup=ohlc4-(fMultiplier*fatr)
fup1 = nz(fup[1],fup)
fup := close[1] > fup1 ? max(fup,fup1) : fup
fdn=ohlc4+(fMultiplier*fatr)
fdn1 = nz(fdn[1], fdn)
fdn := close[1] < fdn1 ? min(fdn, fdn1) : fdn
ftrend = 1
ftrend := nz(ftrend[1], ftrend)
ftrend := ftrend == -1 and close > fdn1 ? 1 : ftrend == 1 and close < fup1 ? -1 : ftrend
fbuySignal = ftrend == 1 and ftrend[1] == -1
fsellSignal = ftrend == -1 and ftrend[1] == 1
tcolor=color.new(color.gray,50)
fdnPlot = plot(ftrend == 1 ? na : fdn, title="Down Trend", style=plot.style_linebr, linewidth=2, color=tcolor)
fupPlot = plot(ftrend == 1 ? fup : na, title="Up Trend", style=plot.style_linebr, linewidth=2, color=tcolor)


if (strategy.position_size > 0)
	tp:=tp[1]
	sl:=up
	strategy.exit("Long_TP/SL","Long",limit=tp, stop=sl)

if (strategy.position_size < 0)
	tp:=tp[1]
	sl:=dn
	strategy.exit("Short_TP/SL","Short",limit=tp, stop=sl)


if ((buySignal and  ftrend==1) or (sbuySignal and trend==1 and  ftrend==1))
	tp:=close+(close-up)*0.382
    strategy.entry("Long", strategy.long,  limit=tp, comment=tostring(round(tp)))
if ((sellSignal and ftrend==-1) or (ssellSignal and trend==-1 and  ftrend==-1))
	tp:=close-(dn-close)*0.382
    strategy.entry("Short", strategy.short, limit=tp, comment=tostring(round(tp)))