পিভট পয়েন্ট গোল্ডেন বিভাগের উপর ভিত্তি করে উচ্চ কিনুন, কম কৌশল বিক্রি করুন
ওভারভিউ
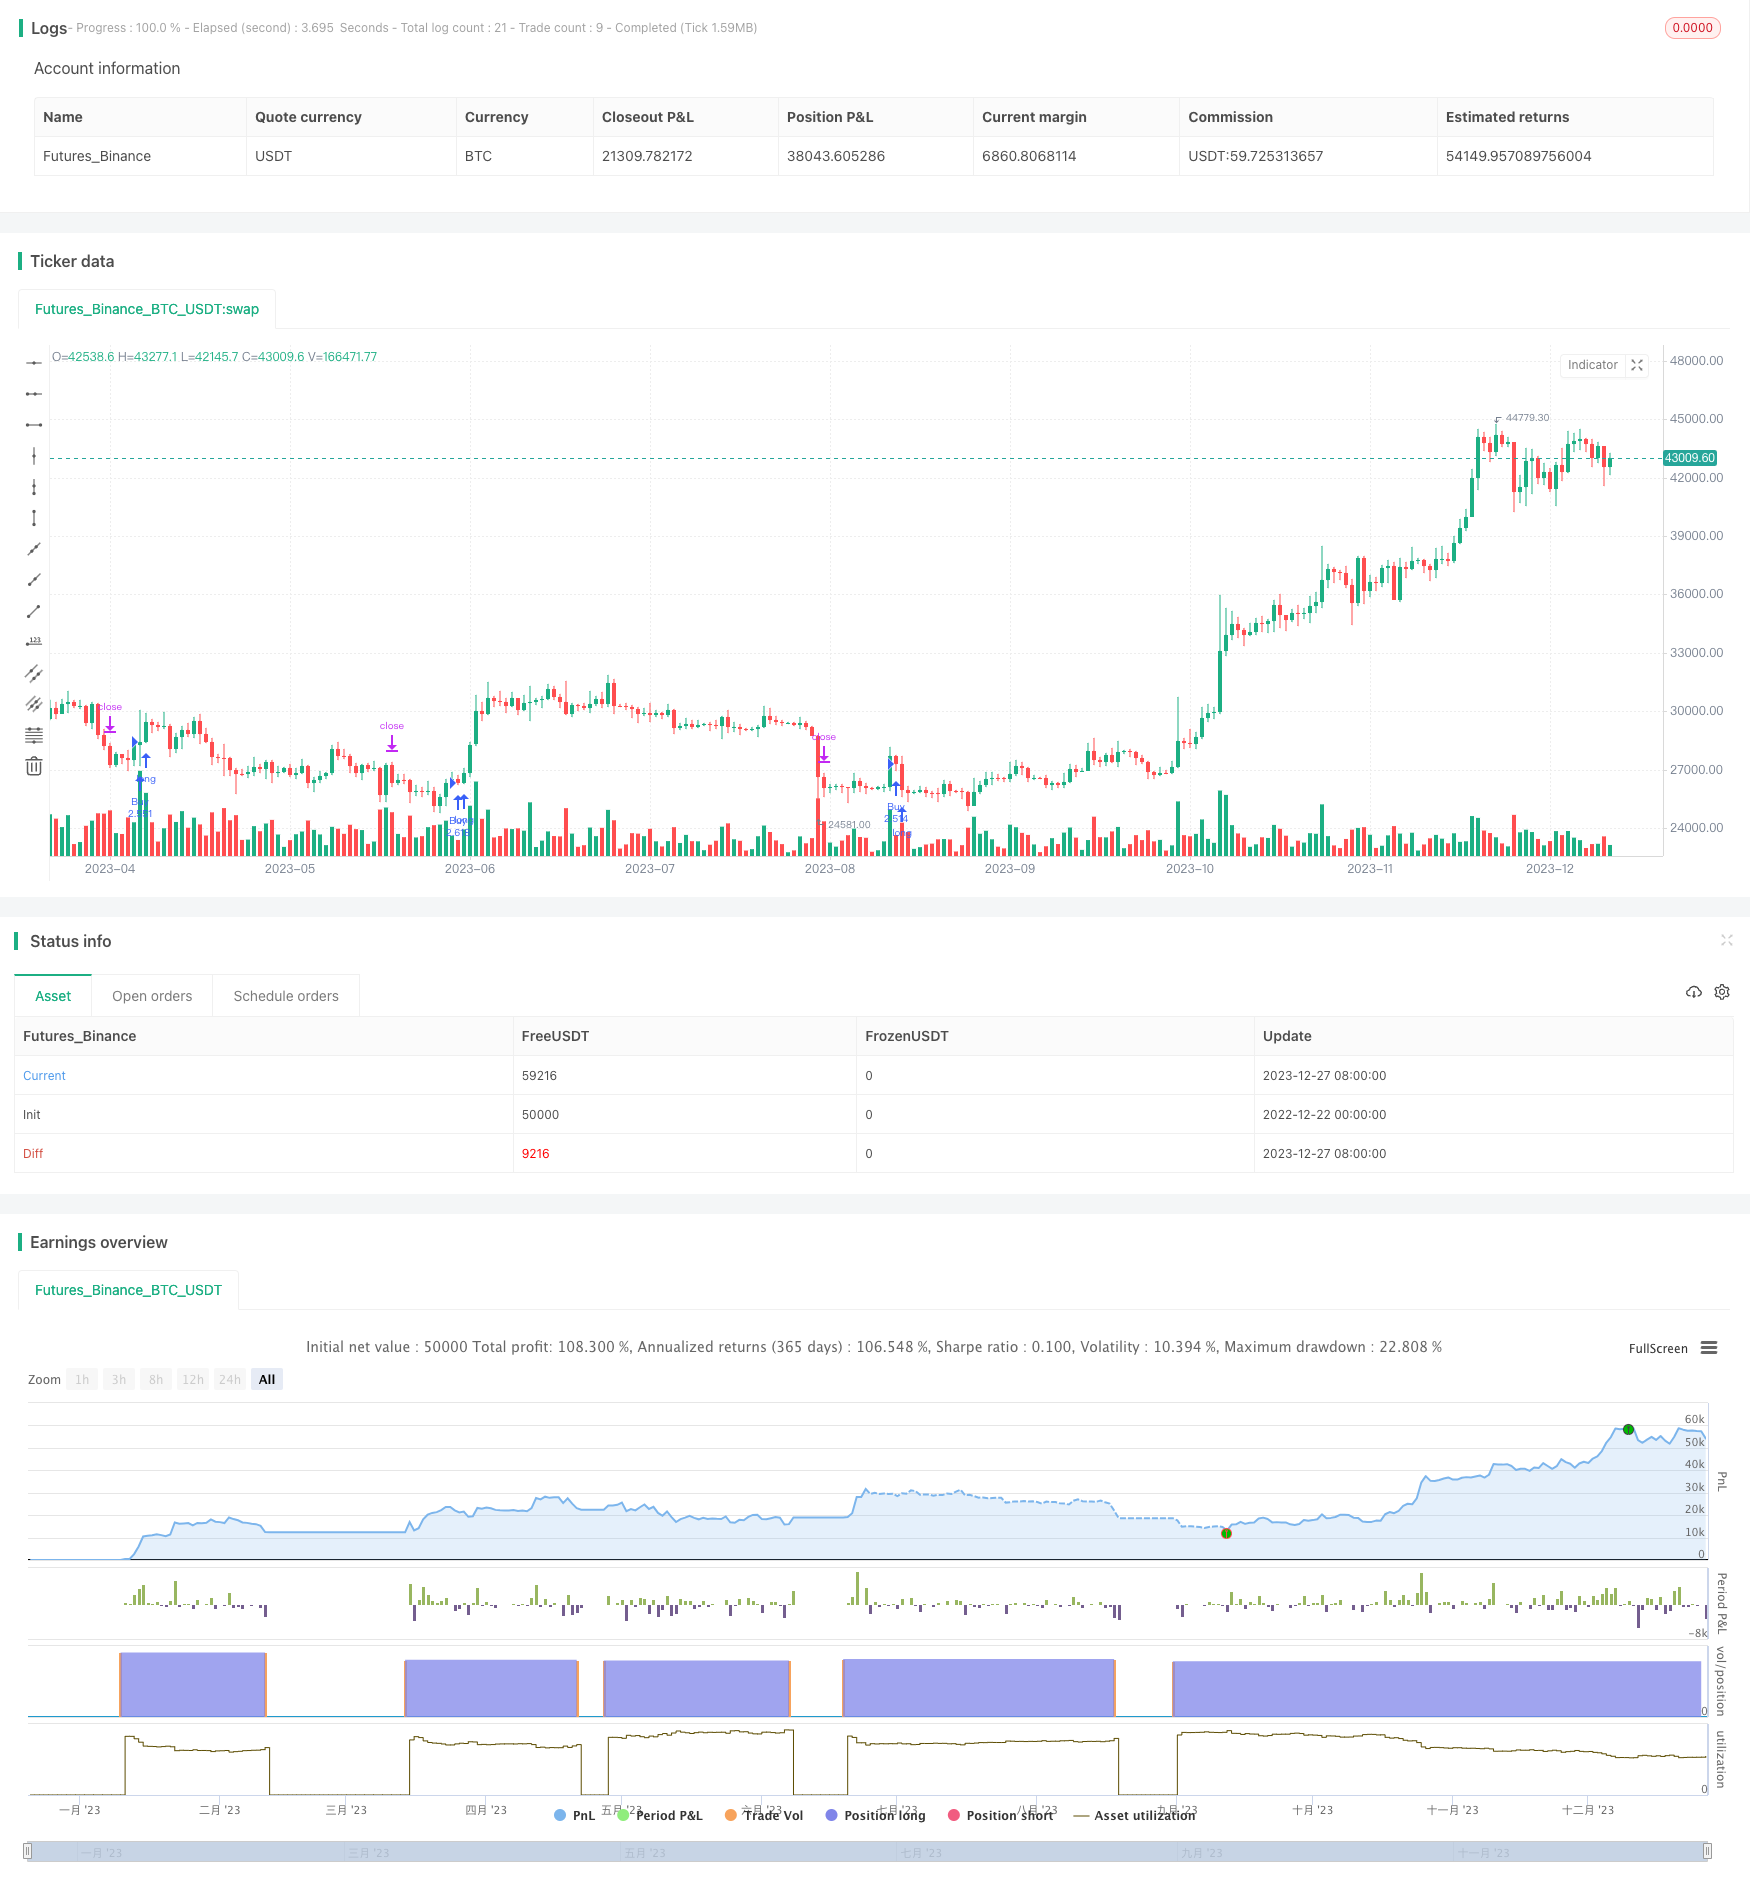
এই কৌশলটি বিভিন্ন সময়কালের স্তম্ভগুলিকে মূল মূল্য অঞ্চল হিসাবে গণনা করে এবং স্বর্ণের বিভাজক নীতির সাথে মিলিত হয়ে প্রবণতার দিকনির্দেশের জন্য উচ্চ মূল্যের এবং কম মূল্যের ট্রেডিং কৌশলগুলি অর্জন করে।
কৌশল নীতি
ক্লাসিকাল বেস এবং গোল্ড বিভাজন বেস সহ বিভিন্ন সময়কালের জন্য সমাপ্তি মূল্য, সর্বোচ্চ মূল্য এবং সর্বনিম্ন মূল্যের বেসগুলি গণনা করুন।
দামের উর্ধ্বগামী এবং নিম্নগামী ট্র্যাকের উপর ভিত্তি করে, বর্তমান মূল্য অঞ্চলটি বিচার করুন। এটি 5 টি ক্রয় অঞ্চল এবং 5 টি বিক্রয় অঞ্চল হিসাবে বিভক্ত।
ক্রয় এলাকায় ক্রয় সংকেত, বিক্রয় এলাকায় বিক্রয় সংকেত, উচ্চ ক্রয় এবং নিম্ন বিক্রয় কৌশল গ্রহণ করুন।
সামর্থ্য বিশ্লেষণ
মার্কেট শব্দ দ্বারা বিভ্রান্ত না হয়ে, প্রবণতা নির্ধারণের জন্য একাধিক সময়কাল ব্যবহার করুন।
একই সময়ে, ক্লাসিক বেস এবং গোল্ডেন বিভাজন বেসগুলির সাথে মিলিত, বেসগুলির নির্ভরযোগ্যতা বাড়ায়।
ট্রেডিং এর নিয়ম মেনে চলার জন্য উচ্চ মূল্যের বা কম মূল্যের ক্রয়-বিক্রয় কৌশল অবলম্বন করুন।
ঝুঁকি বিশ্লেষণ
এই পয়েন্টটি ভেঙে গেলে, এটি ক্ষতিগ্রস্ত হতে পারে।
স্টপ লস ট্র্যাকিংকে ক্ষতিগ্রস্ত হতে দেওয়া উচিত নয়।
লেনদেনের খরচও চূড়ান্ত মুনাফা প্রভাবিত করে।
অপ্টিমাইজেশান দিক
বিভিন্ন প্যারামিটার পরীক্ষা করা যায়, যেমন সময়কালের প্যারামিটার, ট্রেডিং দিকের প্যারামিটার ইত্যাদি, অপ্টিমাইজেশন কৌশল।
অন্যান্য সূচকগুলির সাথে মিলিত হয়ে ট্রেন্ডগুলি চিহ্নিত করা যায়, যাতে ভুয়া ব্রেকডাউনগুলি এড়ানো যায়।
একক ক্ষতি নিয়ন্ত্রণের জন্য স্টপ লস ব্যবস্থা যোগ করা যেতে পারে।
সারসংক্ষেপ
এই কৌশলটি প্রচলিত প্রযুক্তিগত বিশ্লেষণ পদ্ধতি এবং প্রবণতা ট্রেডিং কৌশলকে একত্রিত করে, বাজারে প্রবেশের সময় নির্ধারণের জন্য বেসিক অঞ্চল ব্যবহার করে এবং উচ্চ ক্রয় এবং কম বিক্রয়ের নীতি গ্রহণ করে, যা কার্যকরভাবে লেনদেনের ঝুঁকি নিয়ন্ত্রণ করতে পারে, যা রিয়েল-স্টোর যাচাইকরণ এবং অপ্টিমাইজেশনের জন্য উপযুক্ত।
/*backtest
start: 2022-12-22 00:00:00
end: 2023-12-28 00:00:00
period: 1d
basePeriod: 1h
exchanges: [{"eid":"Futures_Binance","currency":"BTC_USDT"}]
*/

// This source code is subject to the terms of the Mozilla Public License 2.0 at https://mozilla.org/MPL/2.0/
// © HeWhoMustNotBeNamed

//@version=4
strategy("BuyHighSellLow - Pivot points", overlay=true, initial_capital = 100000, default_qty_type = strategy.percent_of_equity, default_qty_value = 100, commission_type = strategy.commission.percent, pyramiding = 1, commission_value = 0.01, calc_on_order_fills = true)
Source = input(close)
resolution = input("4D", type=input.resolution)
HTFMultiplier = input(4, title="Higher Timeframe multiplier (Used when resolution is set to Same as Symbol)", minval=2, step=1)
//ppType = input(title="Pivot points type", defval="classic", options=["classic", "fib"])
ppType = "fib"
tradeDirection = input(title="Trade Direction", defval=strategy.direction.long, options=[strategy.direction.all, strategy.direction.long, strategy.direction.short])
backtestBars = input(title="Backtest from ", defval=10, minval=1, maxval=30)
backtestFrom = input(title="Timeframe", defval="years", options=["days", "months", "years"])
hideBands = input(true)
f_multiple_resolution(HTFMultiplier) =>
    target_Res_In_Min = timeframe.multiplier * HTFMultiplier * (
      timeframe.isseconds   ? 1. / 60. :
      timeframe.isminutes   ? 1. :
      timeframe.isdaily     ? 1440. :
      timeframe.isweekly    ? 7. * 24. * 60. :
      timeframe.ismonthly   ? 30.417 * 24. * 60. : na)

    target_Res_In_Min     <= 0.0417       ? "1S"  :
      target_Res_In_Min   <= 0.167        ? "5S"  :
      target_Res_In_Min   <= 0.376        ? "15S" :
      target_Res_In_Min   <= 0.751        ? "30S" :
      target_Res_In_Min   <= 1440         ? tostring(round(target_Res_In_Min)) :
      tostring(round(min(target_Res_In_Min / 1440, 365))) + "D"

f_getBackTestTimeFrom(backtestFrom, backtestBars)=>
    byDate = backtestFrom == "days"
    byMonth = backtestFrom == "months"
    byYear = backtestFrom == "years"

    date = dayofmonth(timenow)
    mth = month(timenow)
    yr = year(timenow)

    leapYearDaysInMonth = array.new_int(12,0)
    array.set(leapYearDaysInMonth,0,31)
    array.set(leapYearDaysInMonth,1,29)
    nonleapYearDaysInMonth = array.new_int(12,0)
    array.set(leapYearDaysInMonth,0,31)
    array.set(leapYearDaysInMonth,1,28)

    restMonths = array.new_int(10,0)
    array.set(leapYearDaysInMonth,0,31)
    array.set(leapYearDaysInMonth,1,30)
    array.set(leapYearDaysInMonth,2,31)
    array.set(leapYearDaysInMonth,3,30)
    array.set(leapYearDaysInMonth,4,31)
    array.set(leapYearDaysInMonth,5,31)
    array.set(leapYearDaysInMonth,6,30)
    array.set(leapYearDaysInMonth,7,31)
    array.set(leapYearDaysInMonth,8,30)
    array.set(leapYearDaysInMonth,9,31)

    array.concat(leapYearDaysInMonth,restMonths)
    array.concat(nonleapYearDaysInMonth,restMonths)
    isLeapYear = yr % 4 == 0 and (year%100 != 0 or year%400 == 0)
    numberOfDaysInCurrentMonth = isLeapYear ? array.get(leapYearDaysInMonth, mth-2) : array.get(nonleapYearDaysInMonth, mth-2)
    if(byDate)
        mth := (date - backtestBars) < 0 ? mth - 1 : mth
        yr := mth < 1 ? yr - 1 : yr
        mth := mth < 1 ? 1 : mth
        date := (date - backtestBars) < 0 ? numberOfDaysInCurrentMonth - backtestBars + date + 1 : date - backtestBars + 1
    if(byMonth)
        date := 1
        yr := (mth - (backtestBars%12)) < 0 ? yr - int(backtestBars/12) - 1 : yr - int(backtestBars/12)
        mth := mth - (backtestBars%12) + 1
    if(byYear)
        date := 1
        mth := 1
        yr := yr - backtestBars
    [date, mth, yr]

f_secureSecurity(_symbol, _res, _src) => security(_symbol, _res, _src[1], lookahead = barmerge.lookahead_on)

f_getClassicPivots(HIGHprev, LOWprev, CLOSEprev)=>
    PP = (HIGHprev + LOWprev + CLOSEprev) / 3
    R1 = PP * 2 - LOWprev
    S1 = PP * 2 - HIGHprev
    R2 = PP + (HIGHprev - LOWprev)
    S2 = PP - (HIGHprev - LOWprev)
    R3 = PP * 2 + (HIGHprev - 2 * LOWprev)
    S3 = PP * 2 - (2 * HIGHprev - LOWprev)
    R4 = PP * 3 + (HIGHprev - 3 * LOWprev)
    S4 = PP * 3 - (3 * HIGHprev - LOWprev)
    R5 = PP * 4 + (HIGHprev - 4 * LOWprev)
    S5 = PP * 4 - (4 * HIGHprev - LOWprev)
    [R5, R4, R3, R2, R1, PP, S1, S2, S3, S4, S5]

f_getFibPivots(HIGHprev, LOWprev, CLOSEprev)=>
    PP = (HIGHprev + LOWprev + CLOSEprev) / 3
    R1 = PP + 0.382 * (HIGHprev - LOWprev)
    S1 = PP - 0.382 * (HIGHprev - LOWprev)
    R2 = PP + 0.618 * (HIGHprev - LOWprev)
    S2 = PP - 0.618 * (HIGHprev - LOWprev)
    R3 = PP + (HIGHprev - LOWprev)
    S3 = PP - (HIGHprev - LOWprev)
    R4 = PP + 1.41 * (HIGHprev - LOWprev)
    S4 = PP - 1.41 * (HIGHprev - LOWprev)
    R5 = PP + 1.65 * (HIGHprev - LOWprev)
    S5 = PP - 1.65 * (HIGHprev - LOWprev)
    [R5, R4, R3, R2, R1, PP, S1, S2, S3, S4, S5]

f_getPivotPoints(HTFMultiplier, resolution, ppType)=>
    derivedResolution = resolution == ""? f_multiple_resolution(HTFMultiplier) : resolution
    HIGHprev = f_secureSecurity(syminfo.tickerid, derivedResolution, high)
    LOWprev = f_secureSecurity(syminfo.tickerid, derivedResolution, low)
    CLOSEprev = f_secureSecurity(syminfo.tickerid, derivedResolution, close)
    [R5, R4, R3, R2, R1, PP, S1, S2, S3, S4, S5] = f_getClassicPivots(HIGHprev, LOWprev, CLOSEprev)
    [Rf5, Rf4, Rf3, Rf2, Rf1, PPf, Sf1, Sf2, Sf3, Sf4, Sf5] = f_getFibPivots(HIGHprev, LOWprev, CLOSEprev)
    [R5, R4, R3, R2, R1, PP, S1, S2, S3, S4, S5]

f_getState(Source, R5, R4, R3, R2, R1, PP, S1, S2, S3, S4, S5)=>
    state =
     Source > R5 ? 5 :
     Source > R4 ? 4 :
     Source > R3 ? 3 :
     Source > R2 ? 2 :
     Source > R1 ? 1 :
     Source > PP ? 0 :
     Source > S1 ? -1 :
     Source > S2 ? -2 :
     Source > S3 ? -3 :
     Source > S4 ? -4 :
     Source > S5 ? -5 : -6
    state

[R5, R4, R3, R2, R1, PP, S1, S2, S3, S4, S5] = f_getPivotPoints(HTFMultiplier, resolution, ppType)

[date, mth, yr] = f_getBackTestTimeFrom(backtestFrom, backtestBars)
inDateRange = time >= timestamp(syminfo.timezone, yr, mth, date, 0, 0)

BBU5 = plot(not hideBands ? R5: na, title="R5", color=color.orange, linewidth=1, transp=50, style=plot.style_linebr)
BBU4 = plot(not hideBands ? R4: na, title="R4", color=color.yellow, linewidth=1, transp=50, style=plot.style_linebr)
BBU3 = plot(not hideBands ? R3: na, title="R3", color=color.navy, linewidth=1, transp=50, style=plot.style_linebr)
BBU2 = plot(not hideBands ? R2: na, title="R2", color=color.olive, linewidth=1, transp=50, style=plot.style_linebr)
BBU1 = plot(not hideBands ? R1: na, title="R1", color=color.lime, linewidth=1, transp=50, style=plot.style_linebr)
BBM4 = plot(not hideBands ? PP:na, title="PP", color=color.black, linewidth=2, style=plot.style_linebr)
BBL1 = plot(not hideBands ? S1: na, title="S1", color=color.lime, linewidth=1, transp=50, style=plot.style_linebr)
BBL2 = plot(not hideBands ? S2: na, title="S2", color=color.olive, linewidth=1, transp=50, style=plot.style_linebr)
BBL3 = plot(not hideBands ? S3: na, title="S3", color=color.navy, linewidth=1, transp=50, style=plot.style_linebr)
BBL4 = plot(not hideBands ? S4: na, title="S4", color=color.yellow, linewidth=1, transp=50, style=plot.style_linebr)
BBL5 = plot(not hideBands ? S5: na, title="S5", color=color.orange, linewidth=1, transp=50, style=plot.style_linebr)


fill(BBU5, BBU4, title="RZ5", color=color.green, transp=90)
fill(BBU4, BBU3, title="RZ4", color=color.lime, transp=90)
fill(BBU3, BBU2, title="RZ3", color=color.olive, transp=90)
fill(BBU2, BBU1, title="RZ2", color=color.navy, transp=90)
fill(BBU1, BBM4, title="RZ1", color=color.yellow, transp=90)
fill(BBM4, BBL1, title="SZ1", color=color.orange, transp=90)
fill(BBL1, BBL2, title="SZ2", color=color.red, transp=90)
fill(BBL2, BBL3, title="SZ3", color=color.maroon, transp=90)
fill(BBL3, BBL4, title="SZ4", color=color.maroon, transp=90)
fill(BBL4, BBL5, title="SZ5", color=color.maroon, transp=90)

strategy.risk.allow_entry_in(tradeDirection)
longCondition = crossover(Source[1],R1) and inDateRange
shortCondition = crossunder(Source[1], S2) and inDateRange

strategy.entry("Buy", strategy.long, when=longCondition, oca_name="oca")
strategy.entry("Sell", strategy.short, when=shortCondition, oca_name="oca")