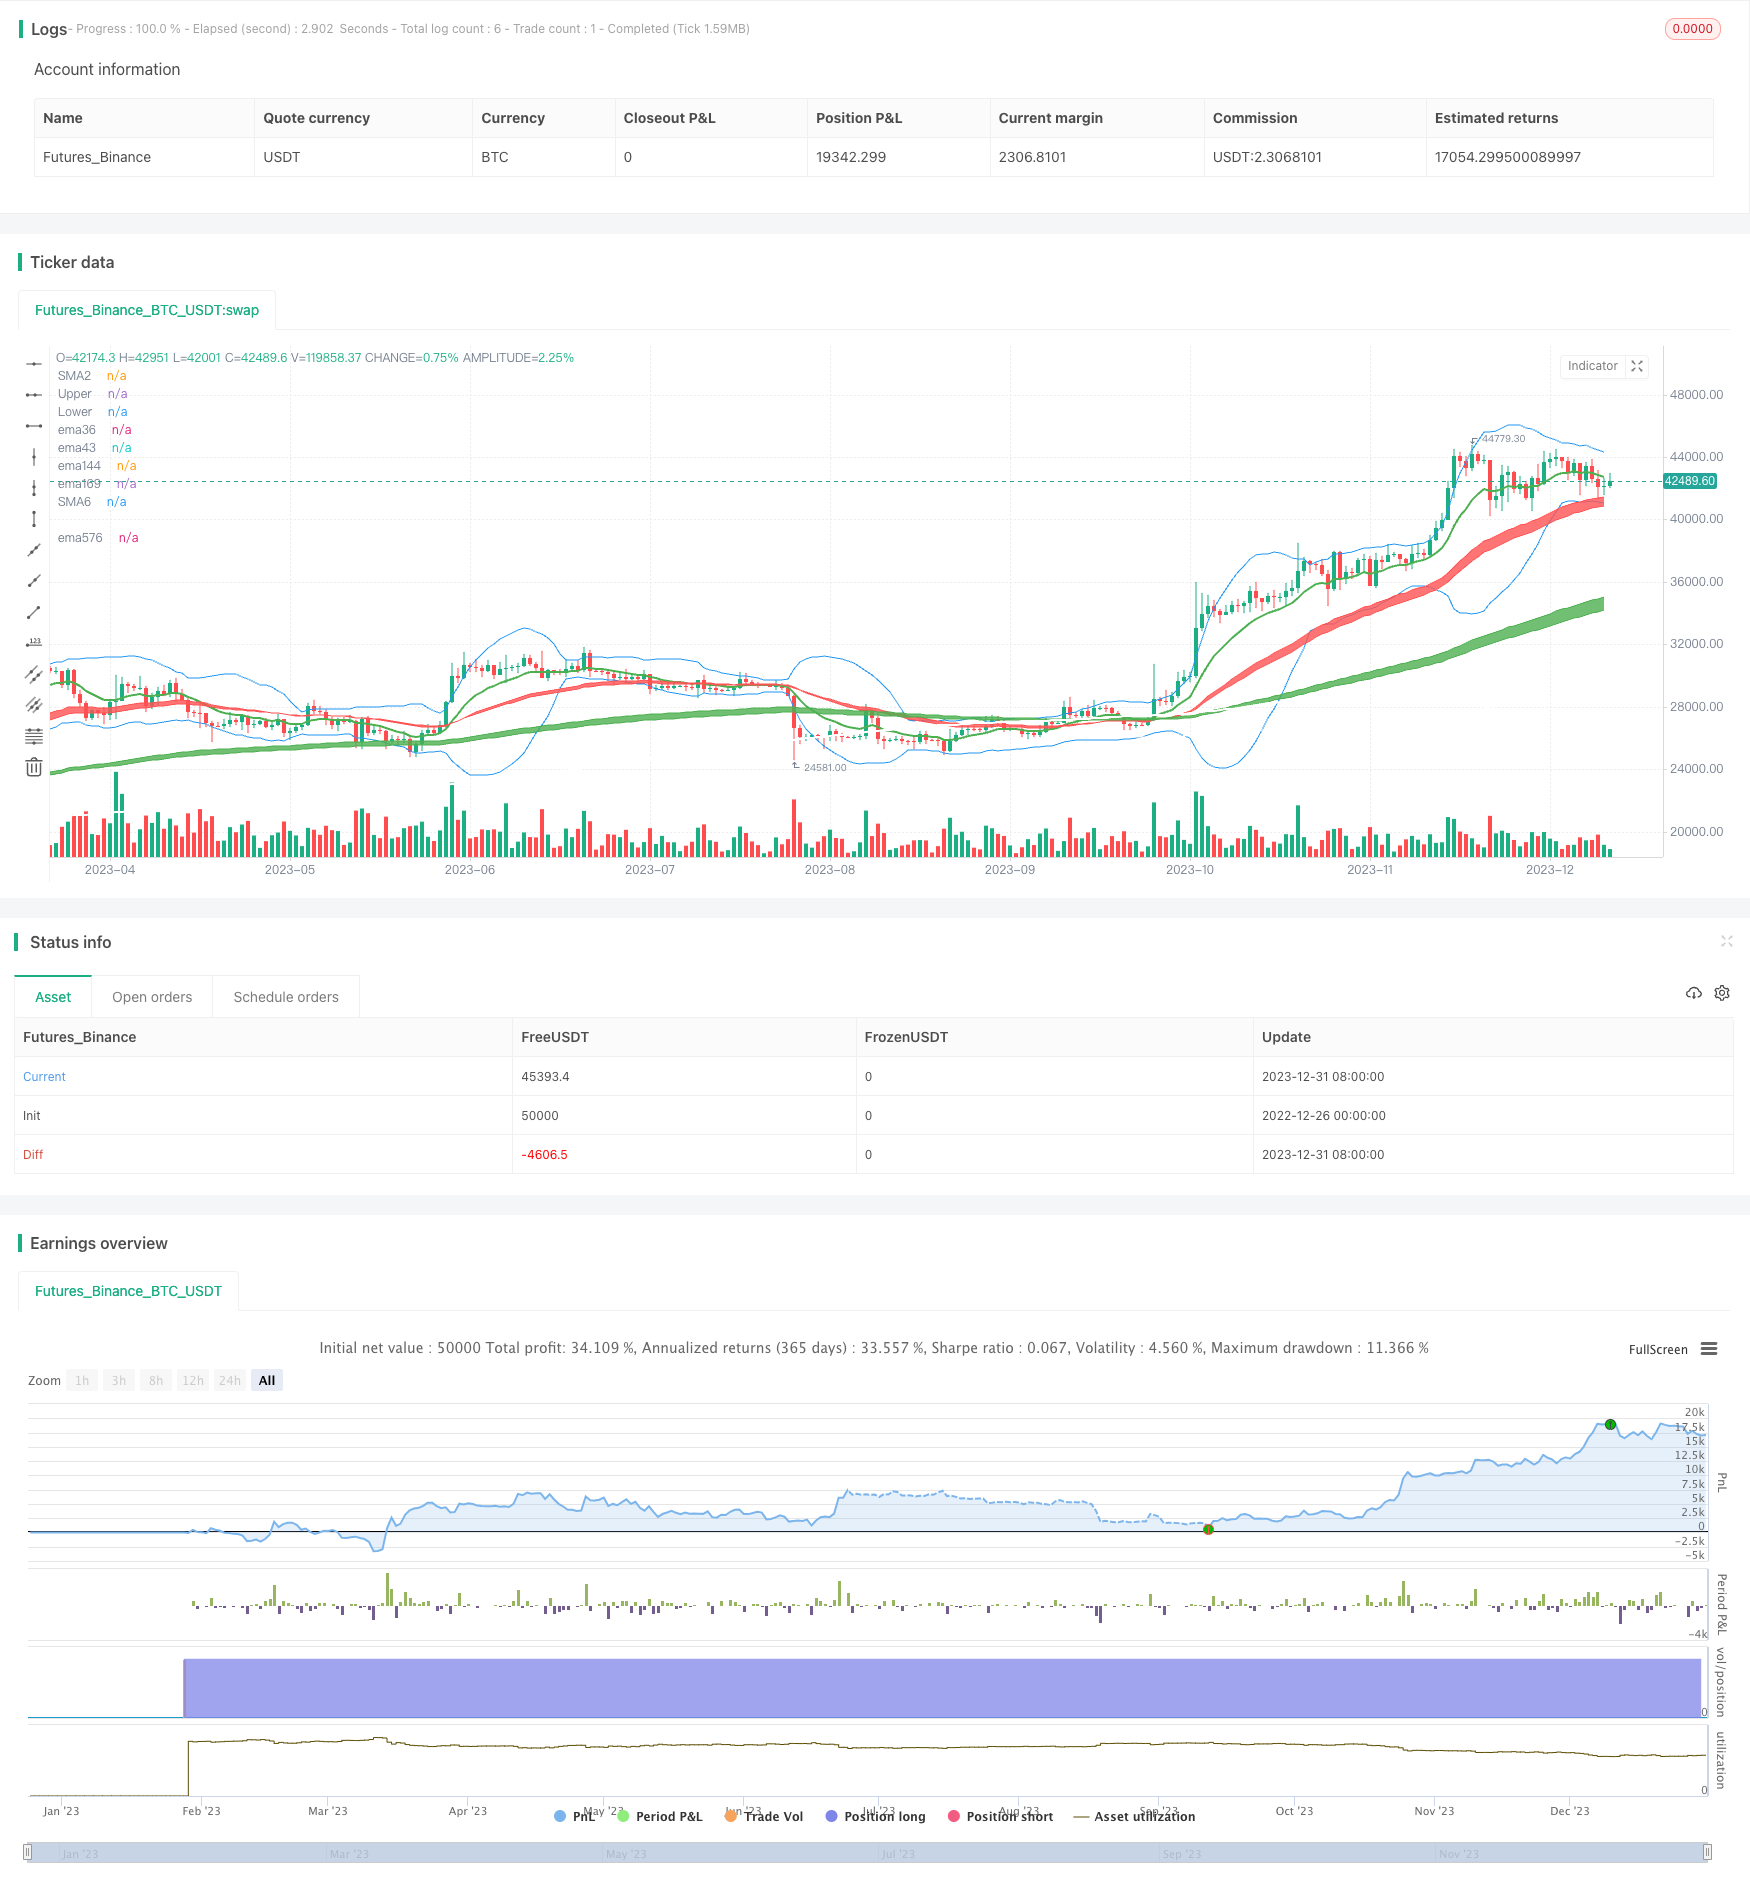
মুভিং ভেগাস প্যাসেজ ট্রাভার্সিং কৌশল
সৃষ্টির তারিখ:
2024-01-02 10:53:06
অবশেষে সংশোধন করুন:
2024-01-02 10:53:06
অনুলিপি:
7
ক্লিকের সংখ্যা:
1327
1
ফোকাস
1664
অনুসারী

এই কৌশলটির মূল ধারণাটি হ’ল স্টকগুলির স্বল্প ও দীর্ঘমেয়াদী প্রবণতার দিকনির্দেশনাটি ইএমএ 36,143,169 ইত্যাদির মতো বিভিন্ন সময়কালের গড়ের ভিত্তিতে বিচার করা এবং এমএসিডি সূচকগুলির সাথে একত্রিত হয়ে একটি বিক্রয়-বিক্রয় সংকেত প্রেরণ করা। বিশেষত, স্বল্পমেয়াদী ইএমএটি 5,10 দিনের ইএমএ দ্বারা বিচার করা, মাঝারি ইএমএটি 20,60 দিনের ইএমএ দ্বারা বিচার করা, 120 এবং 250 দিনের ইএমএ দ্বারা দীর্ঘমেয়াদী ইএমএ দ্বারা বিচার করা, যখন স্বল্পমেয়াদী ইএমএটি মধ্যবর্তী ইএমএ অতিক্রম করে তখন বেশি দেখায় এবং নীচে দেখায়।
লাস ভেগাস টানেলের কৌশলঃ
- EMA36 এবং EMA43 ব্যবহার করে স্বল্পমেয়াদী প্রবণতা বিচার করা হয়, যা লাল চ্যানেল গঠন করে;
- EMA144 এবং EMA169 ব্যবহার করে মধ্য-মেয়াদী প্রবণতা বিচার করা হয়, যা সবুজ চ্যানেল গঠন করে;
- EMA576 এবং EMA676 ব্যবহার করে দীর্ঘমেয়াদী প্রবণতা নির্ণয় করা হয়, যা ধূসর চ্যানেল গঠন করে;
- যখন ইএমএ সমান্তরাল হয়, তখন দাম আরও বেশি করতে পারে, এবং MACD সূচকটি 0 অক্ষের উপরে উঠে যাওয়ার সাথে একত্রে একটি ক্রয় সংকেত প্রেরণ করে;
- যখন দাম প্রতিটি ইএমএ গড়ের নীচে নেমে আসে তখন এটি শূন্য হয়ে যায়, এবং ম্যাকডের সাথে একত্রে 0-অক্ষের নীচে একটি বিক্রয় সংকেত প্রেরণ করে।
- EMA-এর মধ্যবর্তী সময়কালের উপর ভিত্তি করে তিনটি ট্রেডিং কৌশলকে সংক্ষিপ্ত, মাঝারি এবং দীর্ঘ হিসাবে ভাগ করা হয়েছে, যা পৃথক পৃথক হোল্ডিং পিরিয়ডের জন্য উপযুক্ত।
এই কৌশলটির প্রধান সুবিধা হলঃ
- একই সময়ে, সংক্ষিপ্ত, মাঝারি এবং দীর্ঘ তিনটি চ্যানেলের মাধ্যমে প্রবণতার দিকনির্দেশনা দেওয়া হয়েছে, যা তুলনামূলকভাবে স্থিতিশীল।
- Vegas Channel পরিষ্কার এবং স্বজ্ঞাত, প্রবণতা নির্ধারণ করা সহজ।
- এই সূচকটি MACD সূচকের সাথে মিলিত হলে, এটি একটি ভাল কেনা-বেচা সময় নির্ধারণ করে।
- “আমি মনে করি, এই তিনটি কৌশলকে আরও বেশি নমনীয় করে তোলা সম্ভব।
এই কৌশলটির প্রধান ঝুঁকিগুলো হলঃ
- শেয়ারের দামের তীব্র ওঠানামার সময়, ইএমএ গড় লাইনটি পিছিয়ে থাকে এবং ভুল বিচার করার সম্ভাবনা বেশি থাকে।
- যখন তিনটি চ্যানেলের বিচার একমত হয় না, তখন ভুল অপারেশন হওয়ার ঝুঁকি থাকে।
- সময়রেখা পরিচালনা করার জন্য মানসিক শক্তি প্রয়োজন।
প্রতিকারঃ
- বর্তমান বাজারের বৈশিষ্ট্যগুলির সাথে সামঞ্জস্য রেখে ইএমএ গড়ের সময়কাল যথাযথভাবে সামঞ্জস্য করা যেতে পারে
- ট্রেডিংয়ের আগে হোল্ডিং অনুপাত সামঞ্জস্য করুন, একক ক্ষতি নিয়ন্ত্রণ করুন।
এই কৌশলটির জন্য অপ্টিমাইজেশনের সুযোগ রয়েছেঃ
- ভেগাস টানেল ট্রেন্ডিংয়ের জন্য যথেষ্ট নয়, ব্রিন টানেলের জন্য অতিরিক্ত বিচার করা যেতে পারে।
- MACD সূচকটি ব্যাপ্তিগত অস্থিরতার জন্য কার্যকর নয়, এটি KD, RSI ইত্যাদি সূচক দ্বারা প্রতিস্থাপিত হতে পারে।
- ক্রমবর্ধমান ক্ষতি হ্রাস করার কৌশল, যেমন সমাপ্তির মূল্য যখন মূল ইএমএর নিচে চলে যায় তখন সক্রিয়ভাবে ক্ষতি হ্রাস করা।
- A শেয়ারের পতনের প্রভাব বেশি, ইটিএফকে হিমায়িত করার জন্য বিবেচনা করা যেতে পারে।
কৌশল সোর্স কোড
/*backtest
start: 2022-12-26 00:00:00
end: 2024-01-01 00:00:00
period: 1d
basePeriod: 1h
exchanges: [{"eid":"Futures_Binance","currency":"BTC_USDT"}]
*/

//@version=4

strategy("Vegas Tunnel strategy", overlay=true)
//-------------------------------------------
//-------------------------------------------
// Inputs
useCurrentRes = input(true, title="Use Current Chart Resolution?")
resCustom = input(title="Use Different Timeframe? Uncheck Box Above", type=input.resolution, defval="D")
//tfSet = input(title = "Time Frame", options=["Current","120", "240", "D", "W"], defval="D")
tfSet = useCurrentRes ? timeframe.period : resCustom
maPeriods2 = input(12, "12 EMA")
maPeriods6 = input(240, "240 SMA")
BBlength = input(20, title="BB Length", minval=1)
BBsrc = input(close, title="BB Source")
mult = input(2.0, minval=0.001, maxval=50, title="BB StdDev")
sm2 = security(syminfo.tickerid, tfSet, ema(close, maPeriods2))
sm6 = security(syminfo.tickerid, tfSet, sma(close, maPeriods6))
p2 = plot(sm2, color=color.green, transp=30,  linewidth=2, title="SMA2")
p6 = plot(sm6, color=color.white, transp=30,  linewidth=2, title="SMA6")
//BB
basis = sma(BBsrc, BBlength)
dev = mult * stdev(BBsrc, BBlength)
upper = basis + dev
lower = basis - dev
offset = input(0, "BB Offset", type = input.integer, minval = -500, maxval = 500)
//plot(basis, "Basis", color=color.blue,linewidth, offset = offset)
pBB1 = plot(upper, "Upper", color=color.blue, offset = offset)
pBB2= plot(lower, "Lower", color=color.blue, offset = offset)

//MACD
fast_ma = ema(close, 48)
slow_ma = ema(close, 56)
macd = fast_ma - slow_ma

//vagas隧道
f1=ema(close, 36)
f2=ema(close, 43)
f3=ema(close, 144)
f4=ema(close, 169)
f5=ema(close, 576)
f6=ema(close, 676)
f7=ema(close,2304)
z1=plot(f1,color=color.red, title="ema36",transp=100)
z2=plot(f2,color=color.red, title="ema43",transp=100)
z3=plot(f3,color=color.green, title="ema144",transp=100)
z4=plot(f4,color=color.green, title="ema169",transp=100)
z5=plot(f5,color=color.white, title="ema576",transp=100)
z6=plot(f6,color=color.white, title="ema676",transp=100)
fill(z1, z2, color=color.red,transp=60)
fill(z3, z4, color=color.green,transp=60)
fill(z5, z6, color=color.gray,transp=60)

// Make input options that configure backtest date range
startDate = input(title="Start Date", type=input.integer,
     defval=1, minval=1, maxval=31)
startMonth = input(title="Start Month", type=input.integer,
     defval=1, minval=1, maxval=12)
startYear = input(title="Start Year", type=input.integer,
     defval=2018, minval=1800, maxval=2100)
endDate = input(title="End Date", type=input.integer,
     defval=1, minval=1, maxval=31)
endMonth = input(title="End Month", type=input.integer,
     defval=11, minval=1, maxval=12)
endYear = input(title="End Year", type=input.integer,
     defval=2030, minval=1800, maxval=2100)
// Look if the close time of the current bar
// falls inside the date range
inDateRange =  true

//波段多
if (inDateRange and crossunder(f3,f1))//
    strategy.entry("buy", strategy.long,1, when=macd>0, comment = "買Long-term")
buyclose=crossunder(f3,f5)
strategy.close("buy", when = buyclose, comment = "關Long-term")
//多策略1
if (inDateRange and crossover(low , f3) and macd>0 and f3>f6)
    strategy.entry("buy1", strategy.long,100, comment = "買Mid-term")
buyclose1=crossunder(close,upper*0.999)
if (macd<0 or f3<f6)
    strategy.close("buy1", comment = "關Mid-term")
//strategy.close("buy1",when=cross(basis,close), comment = "關M",qty_percent=50)
strategy.close("buy1", when = buyclose1, comment = "關Mid-term",qty_percent=100)
//多策略3
if (inDateRange and  (macd>0) and crossunder(low,f1) and f1>f4) //
    strategy.entry("buy3", strategy.long,1, comment = "買Short-term")
buyclose3=crossunder(close,upper*0.999)
if (macd<0 or f1<f4)
    strategy.close("buy3", comment = "關Short-term")
strategy.close("buy3", when = buyclose3, comment = "關Short-term")
//多策略4
if (inDateRange and  (macd>0) and crossunder(low,f5) and f4>f5) //
    strategy.entry("buy4", strategy.long,1, comment = "買Long-term")
buyclose4=crossunder(close,upper*0.999)
if (macd<0 or f4<f6)
    strategy.close("buy4", comment = "關Long-term")
strategy.close("buy4", when = buyclose4, comment = "關Long-term")

//空策略1
if (inDateRange and  (macd<0) and crossunder(high,f1) and f1<f3 and f3<f6) //
    strategy.entry("sell1", strategy.short,1, comment = "空Short-term")
sellclose1=crossunder(lower*0.999,close)
if (macd>0 or f1>f4)
    strategy.close("sell1", comment = "關空Short-term")
strategy.close("sell1", when = sellclose1, comment = "關空Short-term")
//空策略2
if (inDateRange and  (macd<0) and crossunder(high,f4) and f4<f6) //
    strategy.entry("sell2", strategy.short,1, comment = "空Mid-term")
sellclose2=crossunder(lower,close)
if (macd>0 or f4>f6)
    strategy.close("sell2", comment = "關空Mid-term")
strategy.close("sell2", when = sellclose2, comment = "關Mid-term")
//空策略3
if (inDateRange and (macd<0) and crossunder(high,f6)) //
    strategy.entry("sell3", strategy.short,1, comment = "空Long-term")
sellclose3=crossunder(lower,close)
if (macd>0 or f6>f7)
    strategy.close("sell3", comment = "關空Long-term")
strategy.close("sell3", when = sellclose3, comment = "關空Long-term")