পরিমাণগত ট্রেডিং কৌশল সহ ইচিমোকু ক্লাউড
ওভারভিউ
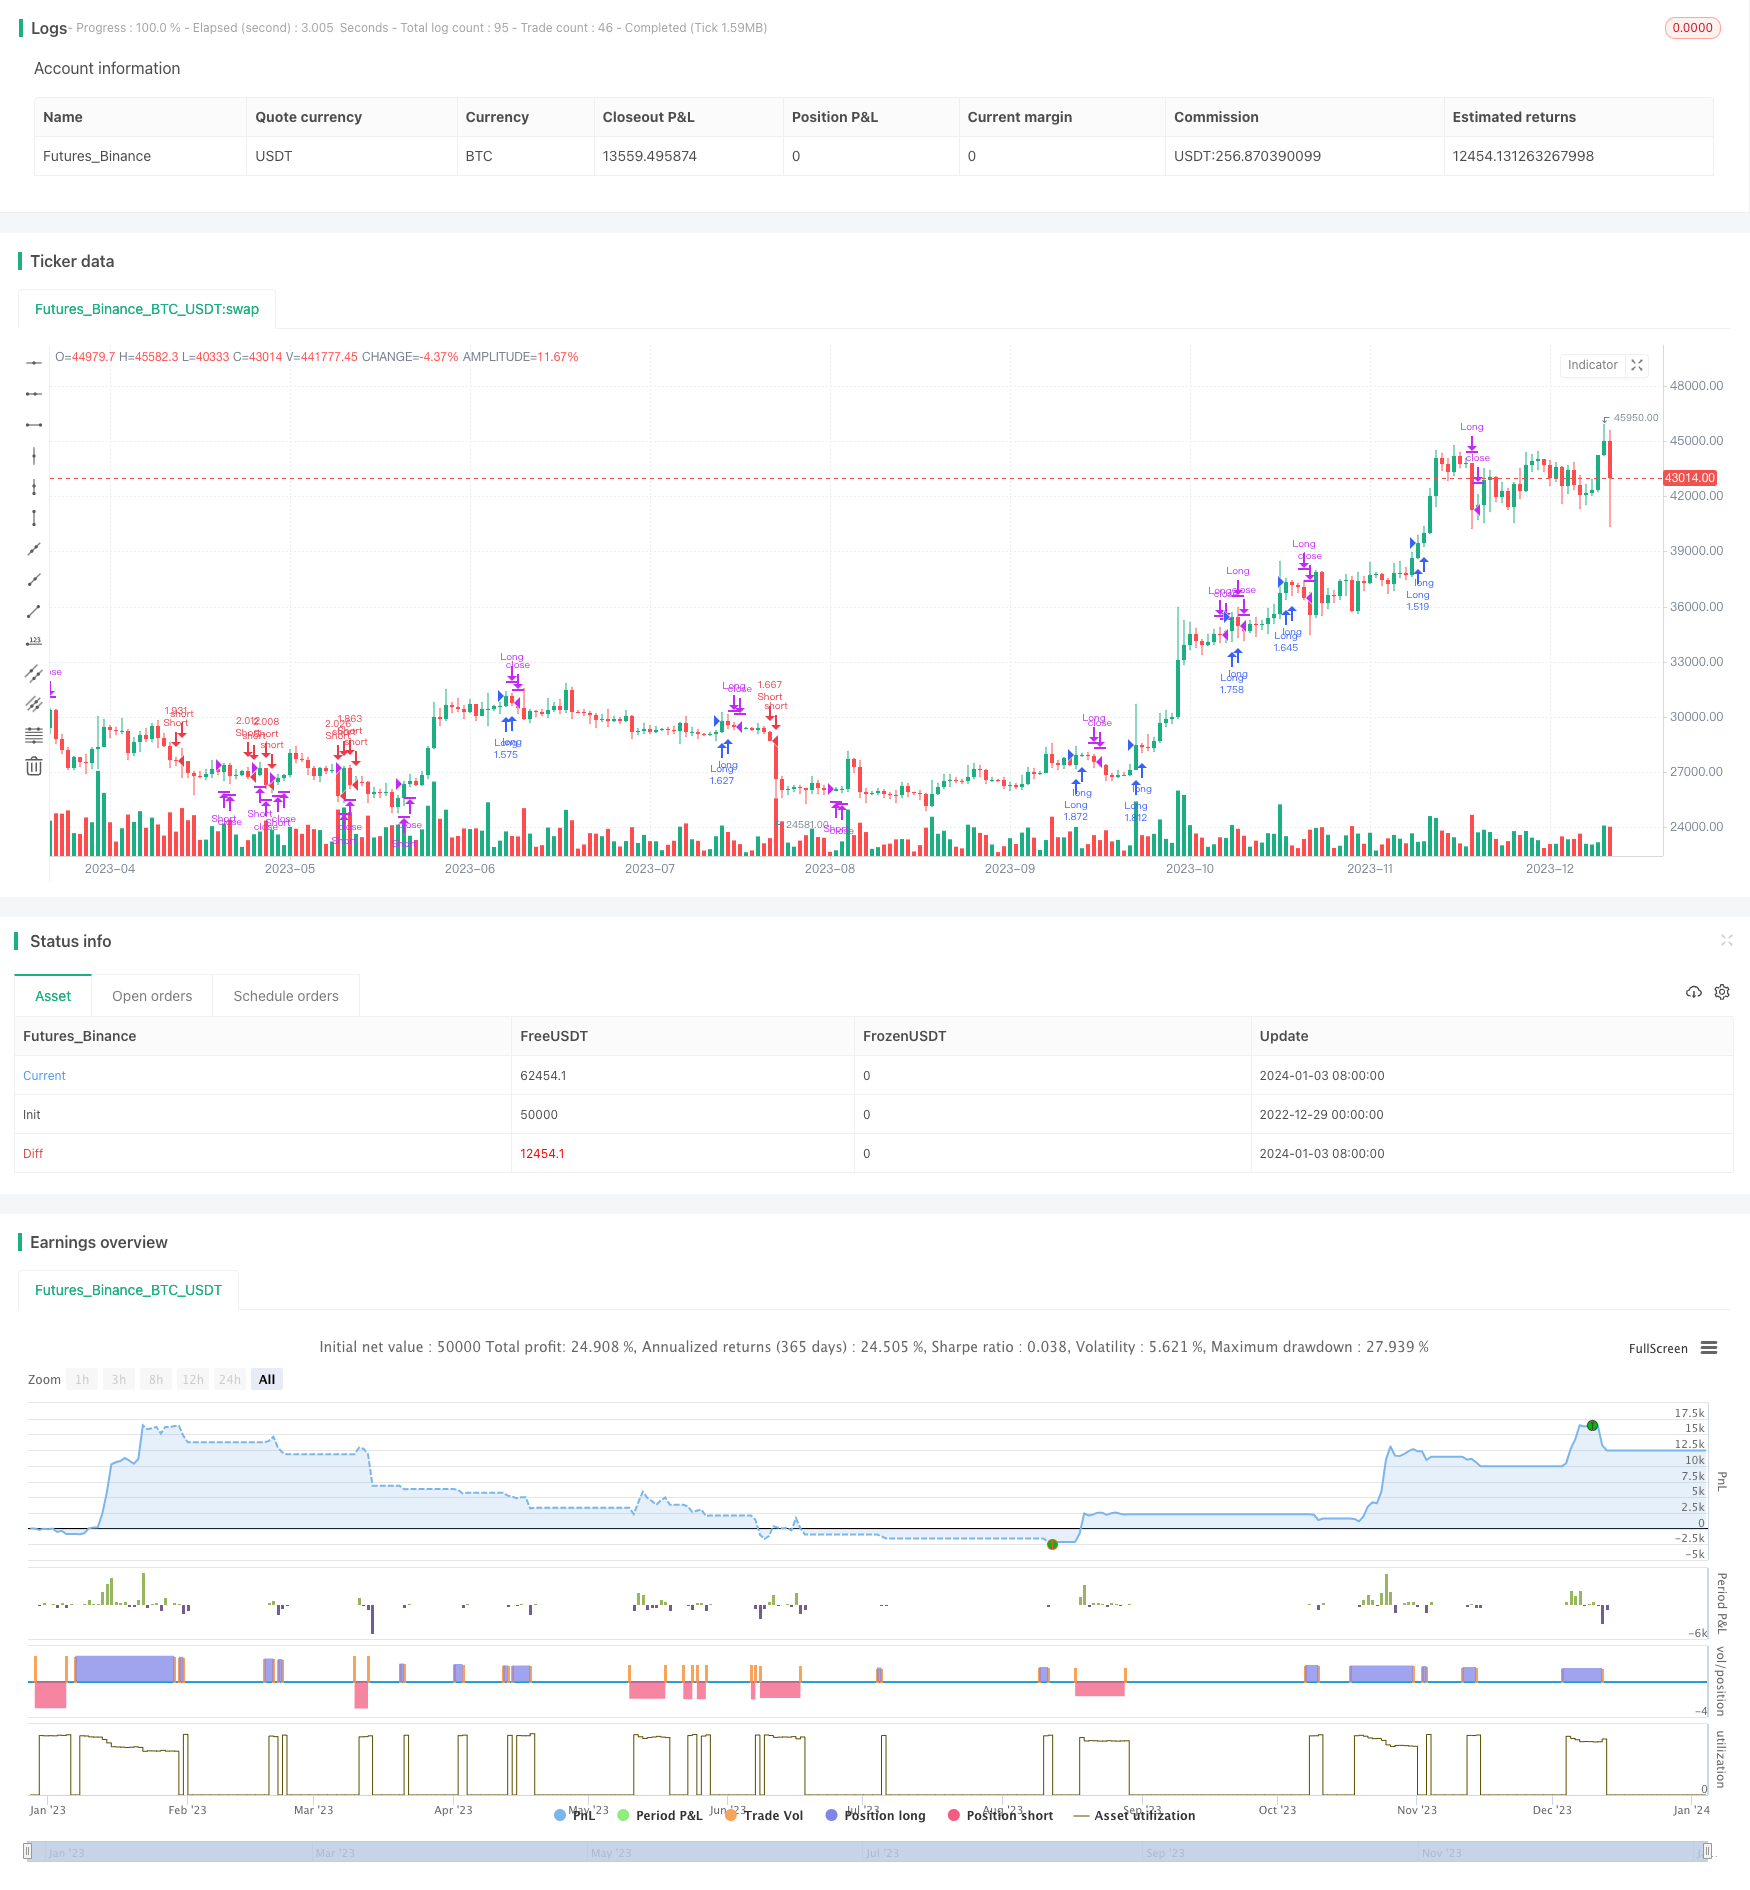
এই কৌশলটি স্বয়ংক্রিয় ব্যবসায়ের জন্য দীর্ঘ-স্বল্প ও বহুমুখী সিদ্ধান্ত গ্রহণের প্রক্রিয়া তৈরি করতে একটি বক্ররেখা, দিন-কে লাইন, হুলের চলমান গড় এবং এমএসিডি সূচকের মতো একাধিক সূচক ব্যবহার করে।
কৌশল নীতি
ইচিমোকু ক্লাউড ব্যান্ডের উপর ভিত্তি করে রূপান্তর লাইন এবং বিলম্বের লাইনটি একটি বহুমুখী ট্রেডিং সংকেত তৈরি করে। হালের চলমান গড়ের সাথে মিলিত হয়ে ট্রেন্ডের দিকনির্দেশনা নির্ধারণ করুন। দীর্ঘ বা সংক্ষিপ্ত গতি নির্ধারণের জন্য MACD সূচকটি ব্যবহার করুন। দিনের মধ্যে কে লাইনটি প্রবেশের সংকেত হিসাবে একটি ব্রেকথ্রু নির্ধারণ করুন
রূপান্তর লাইনটি প্রায় 9 দিনের গড় মূল্য। বিলম্ব লাইনটি প্রায় 26 দিনের গড় মূল্য। যখন রূপান্তর লাইনটি বিলম্বের লাইনটি অতিক্রম করে, তখন আরও কিছু করুন। যখন রূপান্তর লাইনটি বিলম্বের লাইনটি অতিক্রম করে, তখন খালি করুন।
হুলের চলমান গড়টি দ্বিগুণ গড়ের মধ্য দিয়ে প্রবণতা নির্ধারণ করে, যখন একটি দ্রুত লাইন একটি ধীর লাইন অতিক্রম করে, তখন এটি একটি উত্থান হিসাবে বিচার করা হয়; বিপরীতভাবে, ড্যান একটি পতনশীল প্রবণতা হিসাবে বিচার করা হয়।
MACD 12 এবং 26 সূচকের চলমান গড়ের পার্থক্য গ্রহণ করে এবং শূন্য অক্ষ এবং গড়ের গোল্ডেন ফোরকাস্টের মাধ্যমে শূন্যকে নির্ণয় করে।
ঢোকার সময় হিসেবে ইন্ডোর কে লাইন ভেঙে দেরি করা হয়েছে।
কৌশলগত সুবিধা
- এই প্রবণতা সম্পর্কে সঠিকভাবে জানার জন্য বিভিন্ন সূচককে একত্রিত করা হয়েছে।
- “এটি এমন একটি জায়গা যেখানে আপনি আপনার জীবনকে উপভোগ করতে পারেন।
- ঝুঁকি কন্ট্রোল করা হয়েছে, থামানো হয়েছে।
কৌশলগত ঝুঁকি
- প্যারামিটার সেট না করা হলে, খেলার মাঠে অতিরিক্ত তীব্রতার সৃষ্টি হতে পারে।
- মাল্টি-মিটার প্যাকেজ কৌশলগত জটিলতা বৃদ্ধি করে।
- এই অপারেশনের ফলে অবশ্যই প্রত্যাহার করা হবে।
কৌশল অপ্টিমাইজেশন
- আরো প্রজাতি এবং সময়কালের জন্য প্যারামিটার সমন্বয় পরিবর্তন করুন।
- মেশিন লার্নিং মডিউল যোগ করা হয়েছে যাতে প্যারামিটারগুলি স্বনির্ধারিত হতে পারে।
- এদিকে, ক্যারিয়ারের প্রথম দিনগুলোতে দলগুলোকে ভালো করার জন্য একটি নতুন কৌশল প্রবর্তন করা হয়েছে।
সারসংক্ষেপ
এই কৌশলটি ইচিমোকু ক্লাউড ব্যান্ড ইত্যাদির মতো একাধিক সূচক সংকেতকে একত্রিত করে একটি সম্পূর্ণ পরিমাণগত সিদ্ধান্ত গ্রহণের সিস্টেম তৈরি করে। কঠোর স্টপ লস স্টপ মেকানিজম লেনদেনের ঝুঁকি নিয়ন্ত্রণ করে। প্যারামিটার সমন্বয় এবং মডেল অপ্টিমাইজেশনের মাধ্যমে, এটি আরও বেশি লেনদেনের জাতের সাথে খাপ খাইয়ে নিতে পারে, যার বিস্তৃত প্রয়োগের সম্ভাবনা রয়েছে।
/*backtest
start: 2022-12-29 00:00:00
end: 2024-01-04 00:00:00
period: 1d
basePeriod: 1h
exchanges: [{"eid":"Futures_Binance","currency":"BTC_USDT"}]
*/

//@version=2
// Any timeFrame ok but good on 15 minute & 60 minute , Ichimoku + Daily-Candle_cross(DT) + HULL-MA_cross + MacD combination 420 special blend
strategy("Ichimoku + Daily-Candle_X + HULL-MA_X + MacD", shorttitle="٩(̾●̮̮̃̾•̃̾)۶", overlay=true, default_qty_type=strategy.percent_of_equity, max_bars_back=720, default_qty_value=100, calc_on_order_fills= true, calc_on_every_tick=true, pyramiding=0)
keh=input(title="Double HullMA",defval=14, minval=1)
dt = input(defval=0.0010, title="Decision Threshold (0.001)", type=float, step=0.0001)
SL = input(defval=-500.00, title="Stop Loss in $", type=float, step=1)
TP = input(defval=25000.00, title="Target Point in $", type=float, step=1)
ot=1
n2ma=2*wma(close,round(keh/2))
nma=wma(close,keh)
diff=n2ma-nma
sqn=round(sqrt(keh))
n2ma1=2*wma(close[1],round(keh/2))
nma1=wma(close[1],keh)
diff1=n2ma1-nma1
sqn1=round(sqrt(keh))
n1=wma(diff,sqn)
n2=wma(diff1,sqn)
b=n1>n2?lime:red
c=n1>n2?green:red
d=n1>n2?red:green
confidence=(request.security(syminfo.tickerid, 'D', close)-request.security(syminfo.tickerid, 'D', close[1]))/request.security(syminfo.tickerid, 'D', close[1])
conversionPeriods = input(9, minval=1, title="Conversion Line Periods")
basePeriods = input(26, minval=1, title="Base Line Periods")
laggingSpan2Periods = input(52, minval=1, title="Lagging Span 2 Periods")
displacement = input(26, minval=1, title="Displacement")
donchian(len) => avg(lowest(len), highest(len))
conversionLine = donchian(conversionPeriods)
baseLine = donchian(basePeriods)
leadLine1 = avg(conversionLine, baseLine)
leadLine2 = donchian(laggingSpan2Periods)
LS=close, offset = -displacement
MACD_Length = input(9)
MACD_fastLength = input(12)
MACD_slowLength = input(26)
MACD = ema(close, MACD_fastLength) - ema(close, MACD_slowLength)
aMACD = ema(MACD, MACD_Length)
closelong = n1<n2 and close<n2 and confidence<dt or strategy.openprofit<SL or strategy.openprofit>TP
if (closelong)
    strategy.close("Long")
closeshort = n1>n2 and close>n2 and confidence>dt or strategy.openprofit<SL or strategy.openprofit>TP
if (closeshort)
    strategy.close("Short")
longCondition = n1>n2 and strategy.opentrades<ot and confidence>dt and close>n2 and leadLine1>leadLine2 and open<LS and MACD>aMACD
if (longCondition)
    strategy.entry("Long",strategy.long)
shortCondition = n1<n2 and strategy.opentrades<ot and confidence<dt and close<n2 and leadLine1<leadLine2 and open>LS and MACD<aMACD
if (shortCondition)
    strategy.entry("Short",strategy.short)//                         /L'-,
//                               ,'-.           /MM . .             /  L '-,
//     .                    _,--dMMMM\         /MMM  `..           /       '-,
//     :             _,--,  )MMMMMMMMM),.      `QMM   ,<>         /_      '-,'
//     ;     ___,--. \MM(    `-'   )M//MM\       `  ,',.;      .-'* ;     .'
//     |     \MMMMMM) \MM\       ,dM//MMM/     ___ < ,; `.      )`--'    /
//     |      \MM()M   MMM)__   /MM(/MP'  ___, \  \ `  `. `.   /__,    ,'
//     |       MMMM/   MMMMMM( /MMMMP'__, \     | /      `. `-,_\     /
//     |       MM     /MMM---' `--'_ \     |-'  |/         `./ .\----.___
//     |      /MM'   `--' __,-  \""   |-'  |_,               `.__) . .F. )-.
//     |     `--'       \   \    |-'  |_,     _,-/            J . . . J-'-. `-.,
//     |         __  \`. |   |   |         \    / _           |. . . . \   `-.  F
//     |   ___  /  \  | `|   '      __  \   |  /-'            F . . . . \     '`
//     |   \  \ \  /  |        __  /  \  |  |,-'        __,- J . . . . . \
//     |    | /  |/     __,-  \  ) \  /  |_,-     __,--'     |. .__.----,'
//     |    |/    ___     \    |'.  |/      __,--'           `.-;;;;;;;;;\
//     |     ___  \  \     |   |  `   __,--'                  /;;;;;;;;;;;;.
//     |     \  \  |-'\    '    __,--'                       /;;;;;;;;;;;;;;\
// \   |      | /  |      __,--'                             `--;;/     \;-'\
//  \  |      |/    __,--'                                   /  /         \  \
//   \ |      __,--'                                        /  /           \  \
//    \|__,--'                                          _,-;M-K,           ,;-;\
//                                                     <;;;;;;;;           '-;;;;
//a1=plot(n1,color=c)
//a2=plot(n2,color=c)
//plot(cross(n1, n2) ? n1 : na, style = circles, color=b, linewidth = 4)
//plot(cross(n1, n2) ? n1 : na, style = line, color=d, linewidth = 4)
//plot(conversionLine, color=#0496ff, title="Conversion Line")
//plot(baseLine, color=#991515, title="Base Line")
//plot(close, offset = -displacement, color=#459915, title="Lagging Span")
//p1=plot (leadLine1, offset = displacement, color=green,  title="Lead 1")
//p2=plot (leadLine2, offset = displacement, color=red,  title="Lead 2")
//fill(p1, p2, color = leadLine1 > leadLine2 ? green : red)
// remove the "//" from before the plot script if want to see the indicators on chart