গড় সত্যিকারের অস্থিরতার উপর ভিত্তি করে কৌশল অনুসরণ করে প্রবণতা
ওভারভিউ
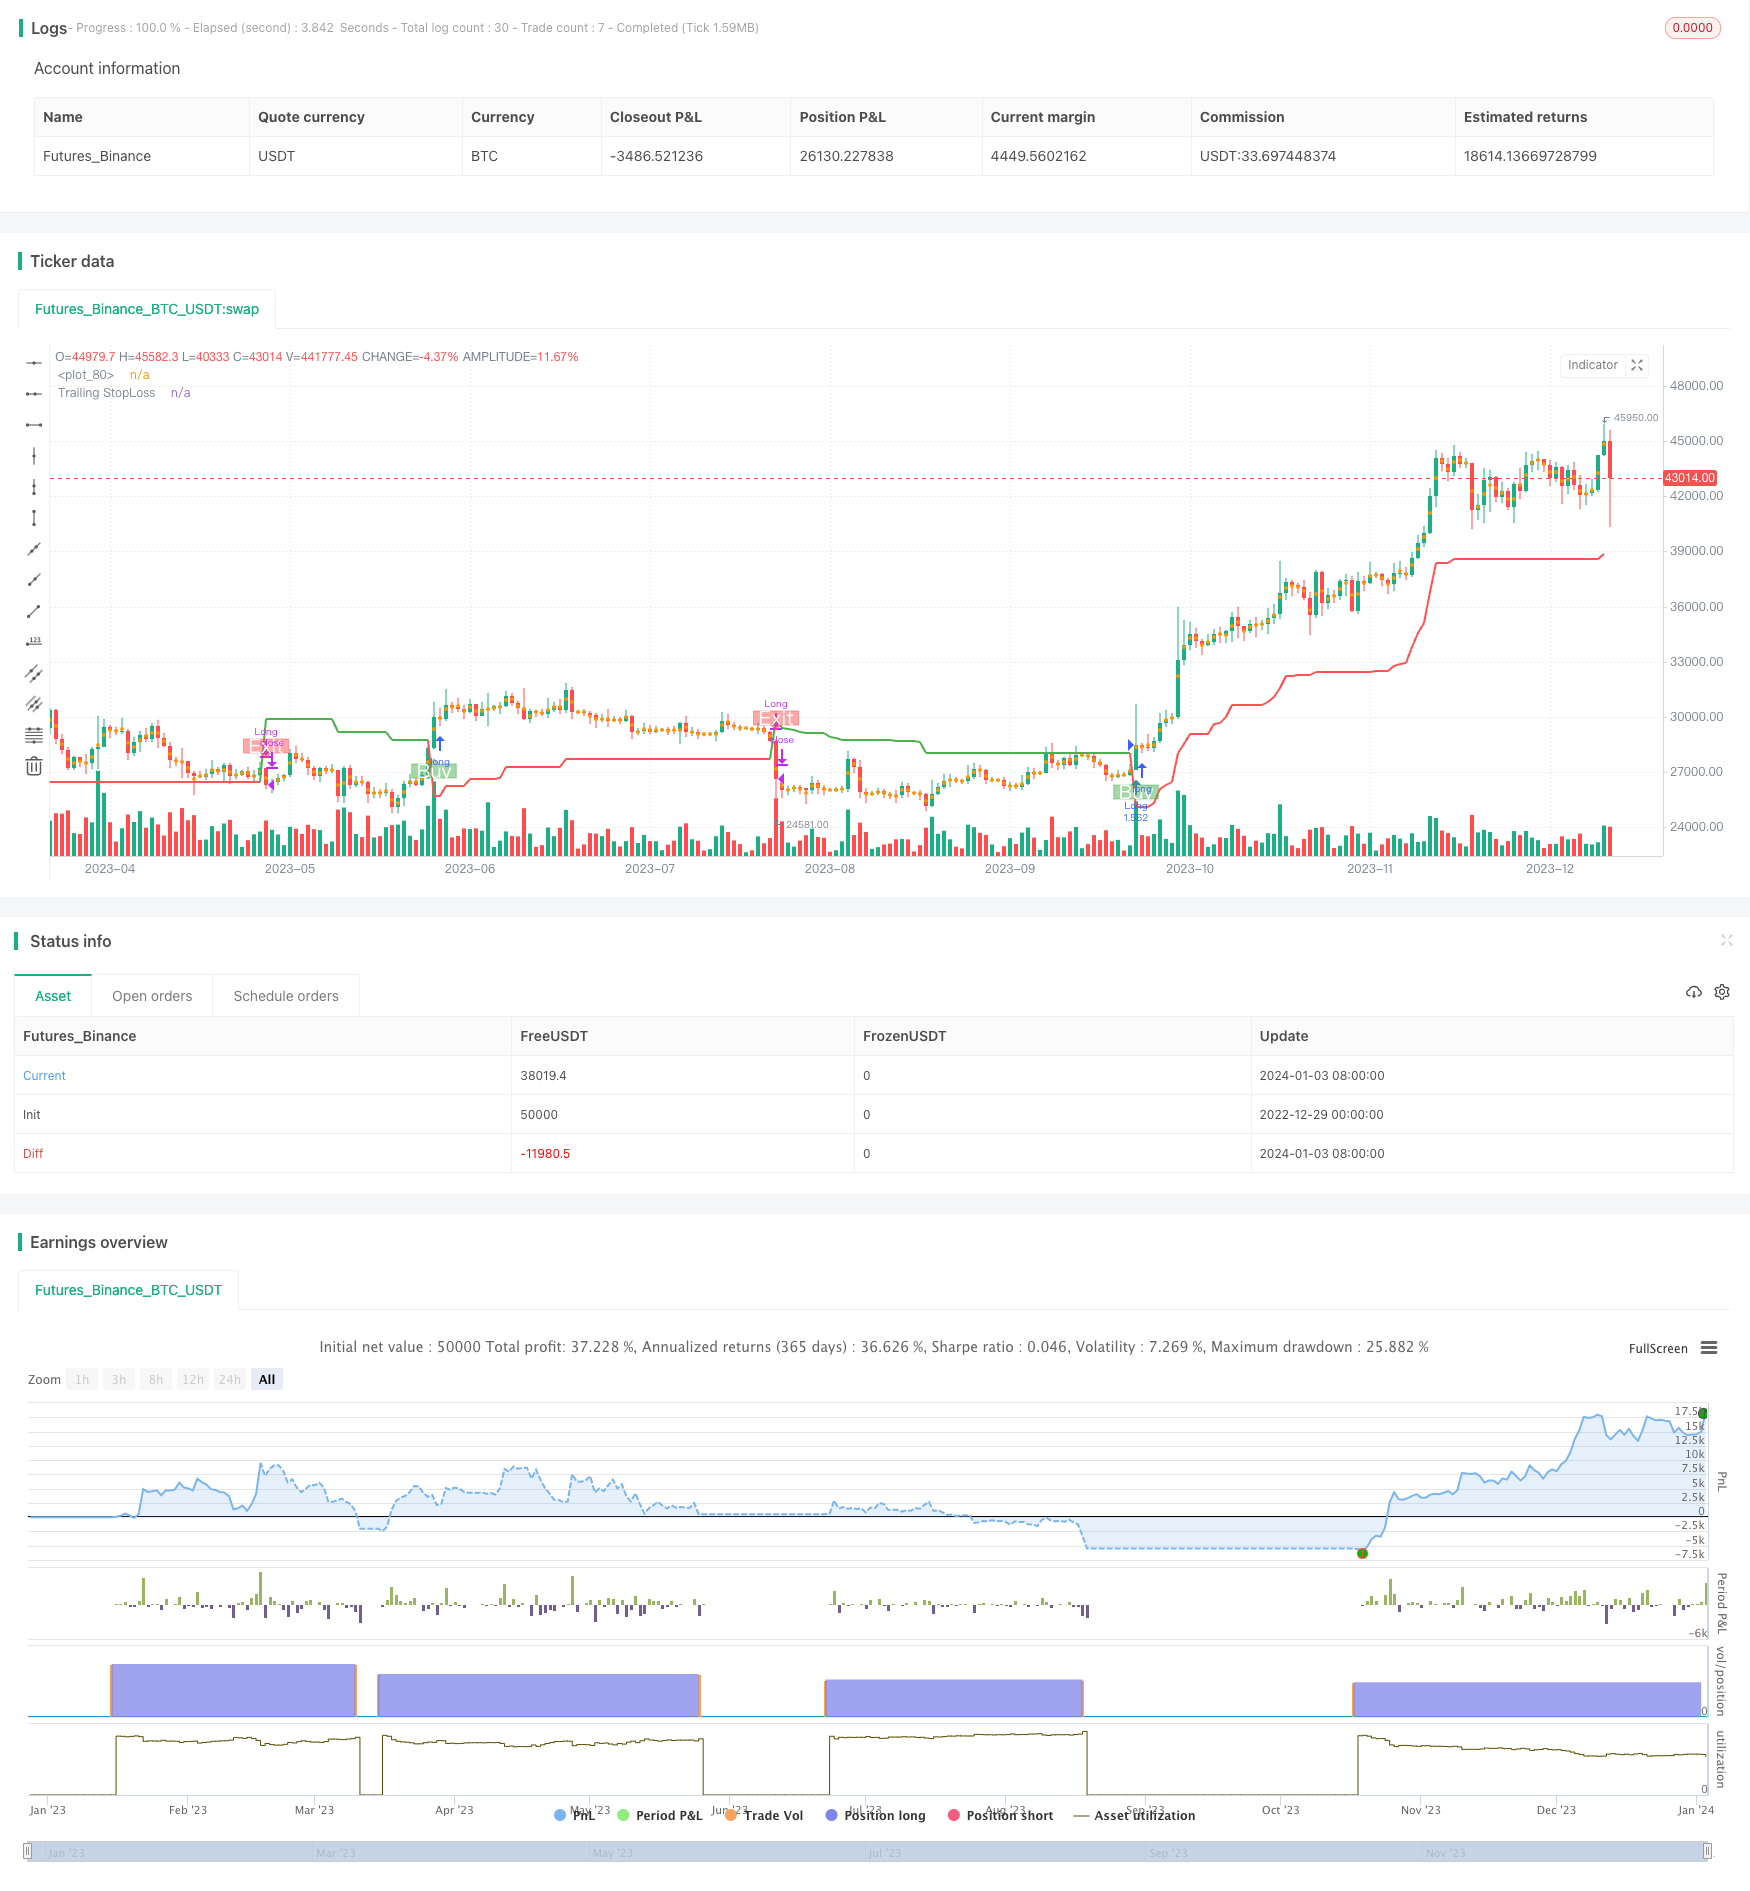
এই কৌশলটি একটি ট্রেন্ড ট্র্যাকিং কৌশল যা গড় বাস্তব তরঙ্গদৈর্ঘ্য (ATR) এর উপর ভিত্তি করে। এটি সূচক মান গণনা করার জন্য এটিআর ব্যবহার করে, যার ফলে দামের প্রবণতার দিকটি নির্ধারণ করা যায়। এই কৌশলটি একই সাথে ঝুঁকি নিয়ন্ত্রণের জন্য একটি স্টপ-ডাউন ব্যবস্থা সরবরাহ করে।
কৌশল নীতি
এই কৌশলটি তিনটি প্রধান প্যারামিটার ব্যবহার করেঃ চক্রের সময়কাল, গুণিতক গুণক এবং প্রবেশ / প্রস্থান পয়েন্ট। ডিফল্ট প্যারামিটারটি 14 টি চক্রের ATR এবং 4 গুণিতক।
এই কৌশলটি প্রথমে মাল্টি হেড গড় মূল্য ((buyavg) এবং ফাঁকা হেড গড় মূল্য ((sellavg) গণনা করে এবং তারপরে দামের সাথে এই দুটি গড় মূল্যের সম্পর্ককে তুলনা করে বর্তমান প্রবণতার দিকটি বিচার করে। যদি দামটি ফাঁকা হেড গড় মূল্যের চেয়ে বেশি হয় তবে এটিকে মাল্টি হেড হিসাবে বিচার করা হয়; যদি দামটি মাল্টি হেড গড় মূল্যের চেয়ে কম হয় তবে এটিকে ফাঁকা হেড হিসাবে বিচার করা হয়।
উপরন্তু, এই কৌশলটি ATR এর সাথে মিলিত হয় ট্রেলিং স্টপ লস সেট করার জন্য। এটি হলঃ এটিআর এর 14 টি চক্রের ওজনযুক্ত চলমান গড়কে একটি গুণিতক দ্বারা গুণিত করুন (ডিফল্ট 4) স্টপ দূরত্ব হিসাবে। এটি স্টপ দূরত্বকে বাজারের অস্থিরতার সাথে সামঞ্জস্য করতে পারে।
যখন স্টপ লস ট্রিগার করা হয়, তখন এই কৌশলটি মুনাফা অর্জনের জন্য সমতল হয়।
কৌশলগত সুবিধা
- প্রবণতা ভিত্তিক, ধারাবাহিকভাবে এবং স্থায়ীভাবে লাভবান হওয়া
- এটিআর ব্যবহার করে গতিশীলভাবে স্টপ-ড্রপ দূরত্ব নিয়ন্ত্রণ করুন, যা ঝুঁকিকে কার্যকরভাবে নিয়ন্ত্রণ করতে পারে
- পয়েন্ট অফ সেলিংয়ের সহজ এবং সহজেই বোঝা যায়
ঝুঁকি ও প্রতিকার
- প্রবণতা পরিবর্তিত হলে, বড় ক্ষতি হতে পারে
- ATR চক্র এবং গুণক যথাযথভাবে সামঞ্জস্য করুন, স্টপ-ড্রপ দূরত্ব অপ্টিমাইজ করুন
- ভূমিকম্পের সময় উইল বেশ কয়েকবার ক্ষুদ্র ক্ষয়ক্ষতি করেছে
- বাজারকে অস্থির করতে ফিল্টারিং বাড়ানো হচ্ছে
- ভুল প্যারামিটার সেট করার ফলে নীতির প্রভাব খারাপ হতে পারে
- মাল্টি কম্বিনেশন প্যারামিটার অপ্টিমাইজেশান টেস্ট, সর্বোত্তম প্যারামিটার খুঁজুন
কৌশল অপ্টিমাইজেশনের দিকনির্দেশনা
১. অন্যান্য সূচক যুক্ত করুন ফিল্টারিং সংকেত বিচার করতে, ঝড়ের পরিস্থিতিতে খেলায় প্রবেশ এড়াতে ২. এটিআর চক্র এবং গুণিতক প্যারামিটারগুলিকে অপ্টিমাইজ করুন, যাতে স্টপডাউন আরও যুক্তিসঙ্গত হয় ৩. বাজারের অবস্থার উপর ভিত্তি করে পজিশনের আকার সামঞ্জস্য করার জন্য পজিশন কন্ট্রোল যুক্ত করা
সারসংক্ষেপ
এই কৌশলটি সামগ্রিকভাবে একটি সহজ এবং ব্যবহারিক ট্রেন্ড ট্র্যাকিং কৌশল। এটি কেবলমাত্র কয়েকটি প্যারামিটার প্রয়োজন, এটির মাধ্যমে গতিশীলভাবে স্টপ লস সামঞ্জস্য করা যায় এবং ঝুঁকি কার্যকরভাবে নিয়ন্ত্রণ করা যায়। যদি অন্যান্য সহায়ক বিচারক সূচকগুলির সাথে মিলিত হয় তবে এটি আরও উন্নত করা যেতে পারে, কিছু গোলমাল ফিল্টার করা যায়। সামগ্রিকভাবে, এই কৌশলটি যারা ট্রেন্ড ট্র্যাকিং কৌশল শিখতে চান তাদের জন্য উপযুক্ত এবং অন্যান্য উন্নত কৌশলগুলির মৌলিক উপাদান হিসাবে ব্যবহার করা যেতে পারে।
/*backtest
start: 2022-12-29 00:00:00
end: 2024-01-04 00:00:00
period: 1d
basePeriod: 1h
exchanges: [{"eid":"Futures_Binance","currency":"BTC_USDT"}]
*/

//@version=5
strategy('Trend Strategy by zdmre', shorttitle='Trend Strategy', overlay=true, pyramiding=0, currency=currency.USD, default_qty_type=strategy.percent_of_equity, initial_capital=10000, default_qty_value=100, commission_type=strategy.commission.percent, commission_value=0.005)
show_STOPLOSSprice = input(true, title='Show TrailingSTOP Prices')
src = input(close, title='Source')
out2 = ta.ema(src, 20)

buyavg = (close + high) / 2.02 - high * (1 - open / close) * (1 - low * open / (high * close))
sellavg = ((low + close) / 1.99 + low * (1 - low / open) * (1 - low * open / (close * high)) / 1.1 + out2 )/ 2

// === INPUT BACKTEST RANGE ===
fromMonth = input.int(defval=1, title='From Month', minval=1, maxval=12)
fromDay = input.int(defval=1, title='From Day', minval=1, maxval=31)
fromYear = input.int(defval=2021, title='From Year', minval=1970)
thruMonth = input.int(defval=1, title='Thru Month', minval=1, maxval=12)
thruDay = input.int(defval=1, title='Thru Day', minval=1, maxval=31)
thruYear = input.int(defval=2100, title='Thru Year', minval=1970)

// === INPUT SHOW PLOT ===
showDate = input(defval=true, title='Show Date Range')

// === FUNCTION EXAMPLE ===
start = timestamp(fromYear, fromMonth, fromDay, 00, 00)  // backtest start window
finish = timestamp(thruYear, thruMonth, thruDay, 23, 59)  // backtest finish window
window() => true


// === TRAILING STOP LOSS === //

ATR_Period = input(14)
ATR_Mult = input(4.0)
var float ATR_TrailSL = na
var int pos = na
atr = ta.rma (ta.tr(true), 14)
xATR = ta.atr(ATR_Period)
nLoss = ATR_Mult * xATR

iff_1 = close > nz(ATR_TrailSL[1], 0) ? close - nLoss : close + nLoss
iff_2 = close < nz(ATR_TrailSL[1], 0) and close[1] < nz(ATR_TrailSL[1], 0) ? math.min(nz(ATR_TrailSL[1]), close + nLoss) : iff_1
ATR_TrailSL := close > nz(ATR_TrailSL[1], 0) and close[1] > nz(ATR_TrailSL[1], 0) ? math.max(nz(ATR_TrailSL[1]), close - nLoss) : iff_2

iff_3 = close[1] > nz(ATR_TrailSL[1], 0) and close < nz(ATR_TrailSL[1], 0) ? -1 : nz(pos[1], 0)
pos := close[1] < nz(ATR_TrailSL[1], 0) and close > nz(ATR_TrailSL[1], 0) ? 1 : iff_3

atr_color = pos == -1 ? color.green : pos == 1 ? color.red : color.aqua
atrtrend = plot(ATR_TrailSL, 'Trailing StopLoss', atr_color, linewidth=2)

// ===  Stop Loss === //
slGroup = 'Stop Loss'
useSL = input.bool(false, title='╔══════   Enable   ══════╗', group=slGroup, tooltip='If you are using this strategy for Scalping or Futures market, we do not recommend using Stop Loss.')
SLbased = input.string(title='Based on', defval='Percent', options=['ATR', 'Percent'], group=slGroup, tooltip='ATR: Average True Range\nPercent: eg. 5%.')
multiATR = input.float(10.0, title='ATR   Mult', group=slGroup, inline='atr')
lengthATR = input.int(14, title='Length', group=slGroup, inline='atr')
SLPercent = input.float(5, title='Percent', group=slGroup) * 0.01
Shortposenter = input.bool(false, title='ShortPosition')

longStop = 0.0
shortStop = 0.0

if SLbased == 'ATR'
    longStop := ta.valuewhen(pos == 1, low, 0) - ta.valuewhen(pos == 1, ta.rma(ta.tr(true), lengthATR), 0) * multiATR
    longStopPrev = nz(longStop[1], longStop)
    longStop := close[1] > longStopPrev ? math.max(longStop, longStopPrev) : longStop

    shortStop := ta.valuewhen(pos == -1, ta.rma(ta.tr(true), lengthATR), 0) * multiATR + ta.valuewhen(pos == -1, high, 0)
    shortStopPrev = nz(shortStop[1], shortStop)
    shortStop := close[1] > shortStopPrev ? math.max(shortStop, shortStopPrev) : shortStop
    shortStop
if SLbased == 'Percent'
    longStop := strategy.position_avg_price * (1 - SLPercent)
    shortStop := strategy.position_avg_price * (1 + SLPercent)
    shortStop
exitLong  = pos == -1

// === PlotColor === //
buySignal = pos == 1 and pos[1] == -1
plotshape(buySignal, title="Long", location=location.belowbar, style=shape.labelup, size=size.normal, color=color.new(color.green,50), text='Buy', textcolor=color.white)
exitSignal = pos == -1 and pos[1] == 1
plotshape(exitSignal, title="Exit", location=location.abovebar, style=shape.labeldown, size=size.normal, color=color.new(color.red,50), text='Exit', textcolor=color.white)

hPlot = plot(ohlc4, title="", style=plot.style_circles, linewidth=0, editable = false)
longFill = (pos == 1 ? color.new(color.green,80) : na)
shortFill = (pos == -1 ? color.new(color.red,80) : na)
fill(hPlot, atrtrend,color=longFill)
fill(hPlot,atrtrend, color=shortFill)

// === Strategy === //
strategy.entry('Long', strategy.long,limit = buyavg, when=window() and pos == 1,comment="Entry: "+str.tostring(buyavg))
strategy.close('Long', when=window() and exitLong , comment='Exit: '+str.tostring(sellavg) )

if Shortposenter
    strategy.entry('Short', strategy.short, when=window() and pos== -1,comment="Entry: "+str.tostring(close))
    strategy.close('Short', when=window() and pos == 1 , comment='Exit: ')

if useSL
    strategy.exit('Stop Loss', 'Long', stop=longStop)

// === Show StopLoss Price === //
if show_STOPLOSSprice
    if pos == -1
        label ShortStop = label.new(bar_index, na, 'SL: ' + str.tostring(ATR_TrailSL), color=color.green, textcolor=color.white, style=label.style_none, yloc=yloc.abovebar, size=size.small)
        label.delete(ShortStop[1])

    if pos == 1
        label LongStop = label.new(bar_index, na, 'SL: ' + str.tostring(ATR_TrailSL), color=color.red, textcolor=color.white, style=label.style_none, yloc=yloc.belowbar, size=size.small)
        label.delete(LongStop[1])