ঐতিহাসিক অস্থিরতার উপর ভিত্তি করে বাজারের সময় কৌশল
ওভারভিউ
এই কৌশলটি ঐতিহাসিক অস্থিরতার উপর ভিত্তি করে একটি ফিল্টার যোগ করে একটি উন্নত সংস্করণ কেনা এবং রাখা কৌশল বাস্তবায়ন করে। ফিল্টারটি বাজারের উচ্চ অস্থিরতার সময়কালে ক্রয়-বিক্রয় অবস্থানগুলি বন্ধ করে দেয় এবং কম অস্থিরতার সময় ক্রয়-বিক্রয় অবস্থানগুলি পুনরায় স্থাপন করে, যার ফলে কৌশলটির সর্বাধিক প্রত্যাহার হ্রাস পায়।
কৌশল নীতি
- SPY-এর গত ১০০ দিনের ঐতিহাসিক ওঠানামা গণনা করুন
- যদি বর্তমান ওঠানামার হার গত ১০০ দিনের ওঠানামার চেয়ে ৯৫ ডিগ্রি বেশি হয়, তাহলে সেই ট্রেডিং দিনটি ফিল্টার করুন এবং একটি ক্রয়-বিক্রয় অবস্থান বন্ধ করুন
- যদি উর্ধ্বমুখীতা ৯৫ পয়েন্টের নিচে থাকে, তাহলে একটি ক্রয়-বিক্রয় অবস্থান তৈরি করুন
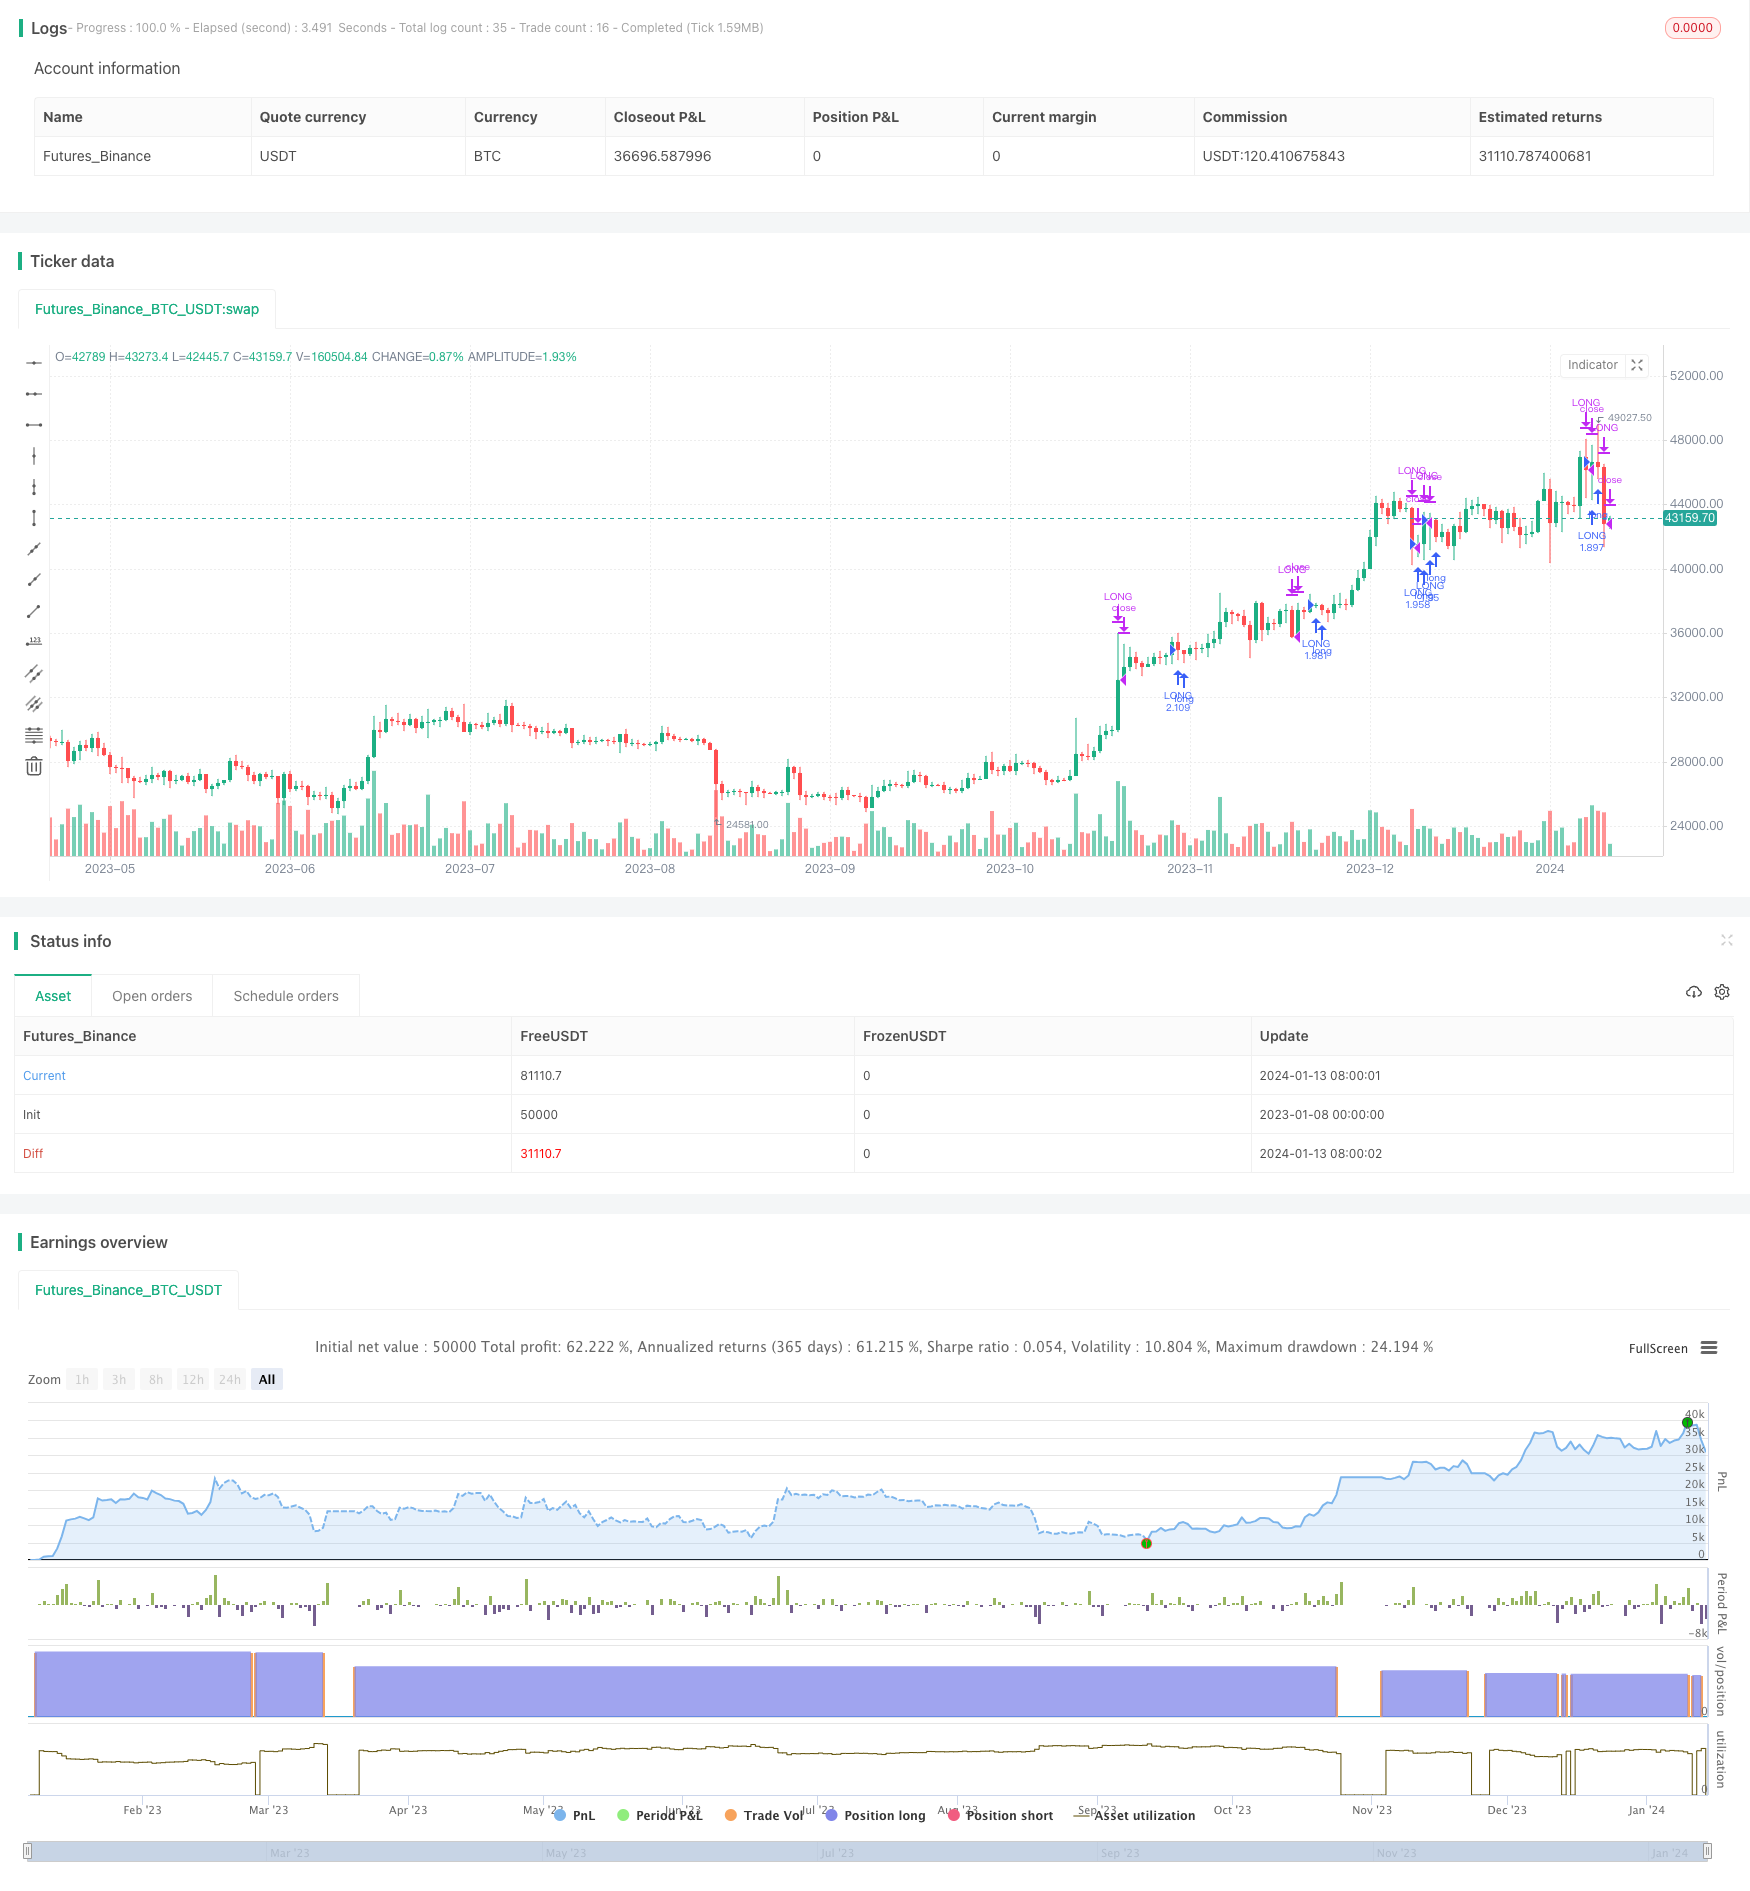
সামর্থ্য বিশ্লেষণ
ফিল্টারবিহীন সহজ কেনা এবং রাখা কৌশলগুলির তুলনায়, এই কৌশলটি ২৮ বছরের পর্যালোচনা সময়কালে বার্ষিক রিটার্নের পরিমাণ বৃদ্ধি করেছে (7.95% বনাম 9.92%) এবং সর্বাধিক প্রত্যাহারের পরিমাণ হ্রাস পেয়েছে (৫০.৭৯% বনাম ৩১.৫৭%) । এটি দেখায় যে বাজারের অস্থিরতা ফিল্টার যুক্ত করা কৌশলটির রিটার্নের পরিমাণ বাড়িয়ে তুলতে পারে এবং ঝুঁকি হ্রাস করতে পারে।
ঝুঁকি বিশ্লেষণ
এই কৌশলটির প্রধান ঝুঁকিটি হল অস্থিরতার হার গণনা করার পদ্ধতি এবং ফিল্টার প্যারামিটার সেটিংয়ের নির্ভুলতা। যদি অস্থিরতার হারটি সঠিকভাবে গণনা না করা হয় তবে ফিল্টারটি ব্যর্থ হবে; যদি ফিল্টার প্যারামিটার সেটিংটি খুব রক্ষণশীল বা খুব জোরালো হয় তবে কৌশলটির উপার্জনকে বিরূপ প্রভাব ফেলতে পারে।
অপ্টিমাইজেশান দিক
অন্যান্য ফিল্টার ইন্ডিকেটরগুলিকে নিশ্চিতকরণ সংকেত হিসাবে অন্তর্ভুক্ত করার কথা বিবেচনা করা যেতে পারে, যেমন দীর্ঘস্থায়ী চলমান গড়, বড় ডিস্কের সূচক এডিএক্স সূচক ইত্যাদি। প্যারামিটার সমন্বয় অপ্টিমাইজেশনও গুরুত্বপূর্ণ, যেমন বিভিন্ন লুকব্যাক পিরিয়ড, ফিল্টারিং থ্রেশহোল্ড ইত্যাদির মতো প্যারামিটার সেটিং পরীক্ষা করা। মেশিন লার্নিং এবং টাইম সিকোয়েন্স অ্যানালিসিস প্রযুক্তিও ব্যবহার করা যেতে পারে।
সারসংক্ষেপ
এই কৌশলটি একটি সহজ ঐতিহাসিক অস্থিরতার উপর ভিত্তি করে ফিল্টার ব্যবহার করে, SPY কেনার এবং হোল্ডিং কৌশলটির আয়কে ব্যাপকভাবে বৃদ্ধি করে, এবং একই সাথে সর্বাধিক প্রত্যাহারকে উল্লেখযোগ্যভাবে হ্রাস করে। এটি বাজারের অবস্থা সনাক্তকরণ এবং সম্পদ বরাদ্দের গুরুত্বকে প্রমাণ করে। আমরা অস্থিরতার মডেলটি অপ্টিমাইজ করতে এবং নিশ্চিতকরণ সংকেত যোগ করে এই কৌশলটি আরও উন্নত করতে পারি।
/*backtest
start: 2023-01-08 00:00:00
end: 2024-01-14 00:00:00
period: 1d
basePeriod: 1h
exchanges: [{"eid":"Futures_Binance","currency":"BTC_USDT"}]
*/

// This source code is subject to the terms of the Mozilla Public License 2.0 at https://mozilla.org/MPL/2.0/
//
// @author Sunil Halai
//
// This script has been created to demonstrate the effectiveness of using market regime filters in your trading strategy, and how they can improve your returns and lower your drawdowns
//
// This strategy adds a simple filter (The historical volatility filter, which can be found on my trading profile) to a traditional buy and hold strategy of the index SPY. There are other filters
// that could also be added included a long term moving average / percentile rank filter / ADX filter etc, to improve the returns further.
//
// The filter added closes our long position during periods of volatility that exceed the 95th percentile (or in the top 5% of volatile days)
//
// Have included the back test results since 1993 which is 28 years of data at the time of writing,  Comparing  buy and hold of the SPY (S&P 500), to improved by and hold offered here.
//
// Traditional buy and hold:
//
// Return per year:     7.95   % (ex Dividends)
// Total return :       851.1  %
// Max drawdown:        50.79  %
//
// 'Modified' buy and hold (this script):
//
// Return per year:     9.92    % (ex Dividends)
// Total return:        1412.16 %
// Max drawdown:        31.57   %
//
// Feel free to use some of the market filters in my trading profile to improve and refine your strategies further, or make a copy and play around with the code yourself. This is just
// a simple example for demo purposes.
//

//@version=4
strategy(title = "Simple way to beat the market [STRATEGY]", shorttitle = "Beat The Market [STRATEGY]", overlay=true, initial_capital=100000, default_qty_type=strategy.percent_of_equity, currency="USD", default_qty_value=100)


upperExtreme = input(title = "Upper percentile filter (Do not trade above this number)", type = input.integer, defval = 95)
lookbackPeriod = input(title = "Lookback period", type = input.integer, defval = 100)

annual = 365
per = timeframe.isintraday or timeframe.isdaily and timeframe.multiplier == 1 ? 1 : 7
hv = lookbackPeriod * stdev(log(close / close[1]), 10) * sqrt(annual / per)

filtered = hv >= percentile_nearest_rank(hv, 100, upperExtreme)

if(not(filtered))
    strategy.entry("LONG", strategy.long)
else
    strategy.close("LONG")