কৌশল অনুসরণ করে মাল্টি-টাইমলাইন প্রবণতা
ওভারভিউ
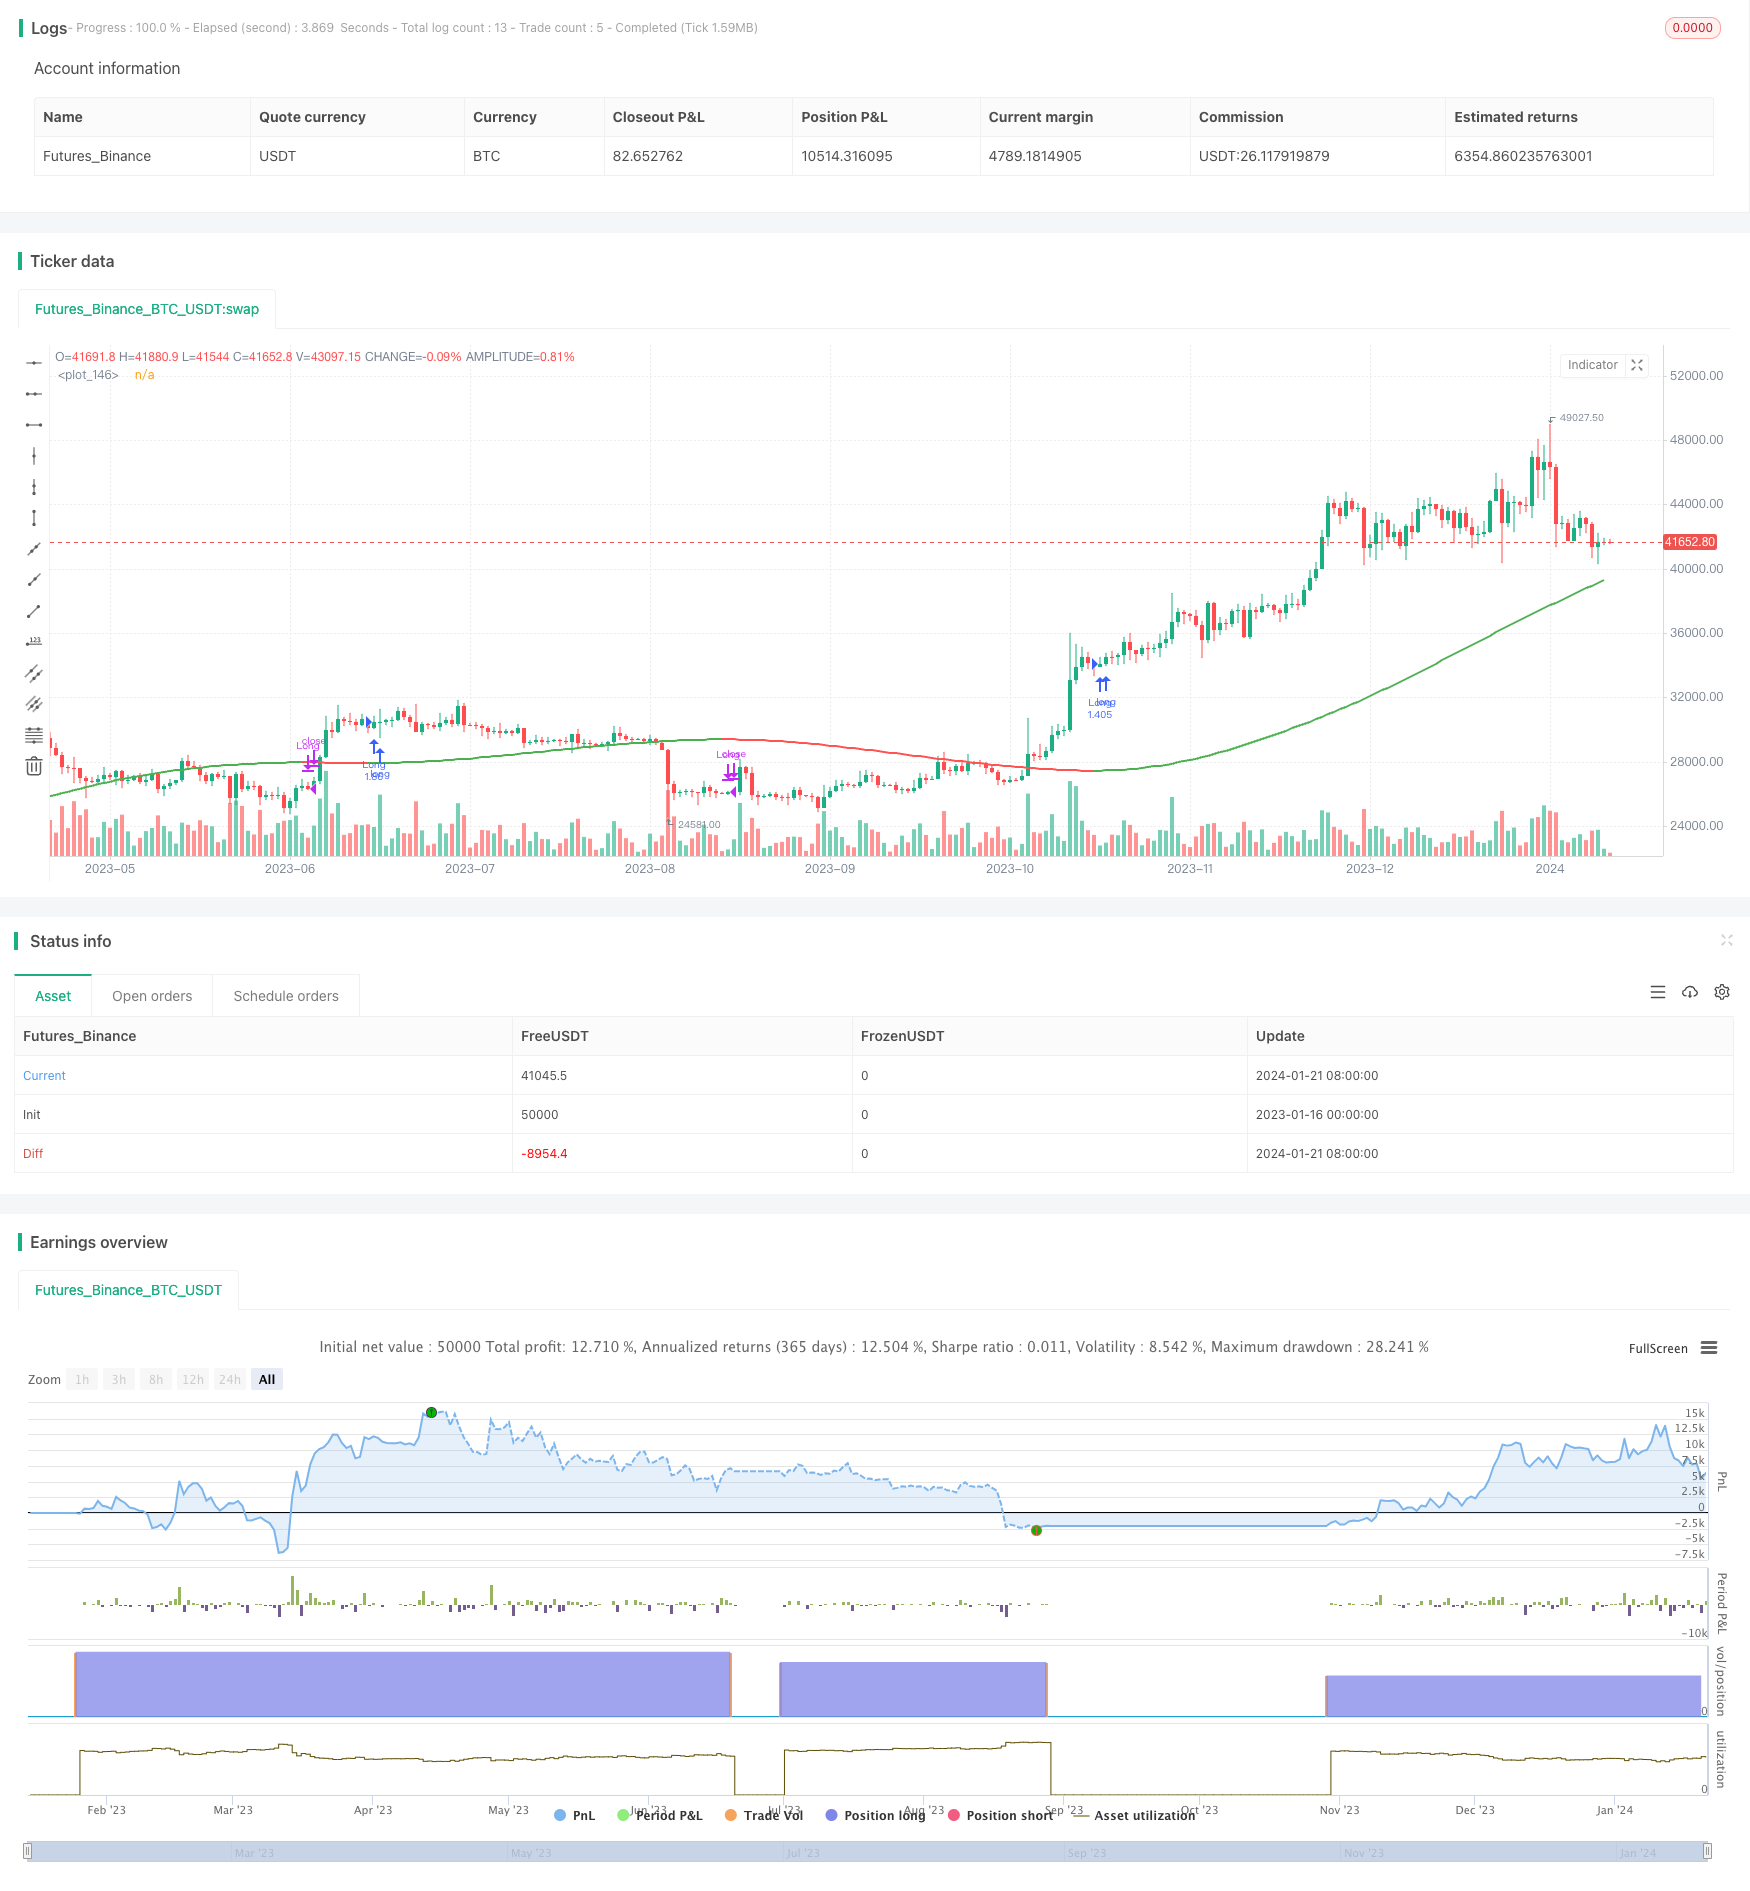
মাল্টি টাইম-এক্সট ট্রেন্ড ট্র্যাকিং কৌশল হল একটি ট্রেন্ড ট্র্যাকিং কৌশল যা বিভিন্ন মুভিং এভারেজ এবং রিগ্রেশন লাইনের সমন্বয় করে। এই কৌশলটি 20 টিরও বেশি বিভিন্ন প্রবণতা সূচক থেকে বাছাই করতে পারে এবং স্বয়ংক্রিয়ভাবে কেনা এবং বিক্রি করতে পারে।
কৌশল নীতি
এই কৌশলটির কেন্দ্রবিন্দু হল ব্যবহারকারীর দ্বারা নির্বাচিত প্রবণতা সূচকগুলির উপর ভিত্তি করে দামগুলি বাড়ছে বা হ্রাস পাচ্ছে কিনা তা নির্ধারণ করা। কৌশলটি প্রথমে 20 টিরও বেশি চলমান গড় এবং রিগ্রেশন লাইন গণনা করে। এই সূচকগুলির মধ্যে রয়েছে সাধারণ চলমান গড়, ভারযুক্ত চলমান গড়, সূচকীয় চলমান গড় ইত্যাদি পাইন প্রোগ্রামিং ভাষার স্ট্যান্ডার্ড লাইব্রেরিতে থাকা সূচকগুলি এবং কিছু কাস্টম সূচকও রয়েছে যা পাইন সম্প্রদায় দ্বারা রচিত। তারপরে, কৌশলটি এই সূচকগুলিকে অনুসন্ধান করে এবং একটি নির্দিষ্ট সূচকের বর্তমান মানের সাথে তুলনা করে। যদি বর্তমান মানটি পূর্ববর্তী মানের চেয়ে বড় হয় তবে প্রবণতা বাড়বে, বিপরীতভাবে, যদি বর্তমান মানটি পূর্ববর্তী মানের চেয়ে ছোট হয় তবে প্রবণতা হ্রাস পাবে। অবশেষে, কৌশলটি সিদ্ধান্ত নেয় যে প্রবণতার দিকটি অনুসারে লম্বা অবস্থান স্থাপন করা উচিত কিনা।
সামর্থ্য বিশ্লেষণ
এই কৌশলটি 20 টিরও বেশি সূচক বিচার প্রবণতাকে একত্রিত করে, যাতে একটি একক সূচক বিচার ভুলের সম্ভাবনা এড়ানো যায়। এবং এই সূচকগুলি সম্প্রদায়ের বিকাশকারীদের দ্বারা যাচাই করা হয়েছে। বিভিন্ন পরামিতি ব্যবহার করে সামঞ্জস্য করা যেতে পারে এবং একাধিক বাজার পরিবেশে প্রযোজ্য।
সহজ ডাবল মুভিং এভারেজ কৌশলগুলির তুলনায়, এই কৌশলটি কেবলমাত্র একটি সূচকের উপর নির্ভর করে প্রবণতার দিকনির্দেশের উপর নির্ভর করে, এটি প্রবণতাকে আরও ভালভাবে প্রকাশ করতে পারে এবং সূচকের বিপরীত মিথ্যা সংকেত দেখা দেয় না।
ঝুঁকি বিশ্লেষণ
এই কৌশলটি সূচক বিচার প্রবণতা উপর নির্ভর করে, এবং প্রবণতা একটি বিপরীত হয়েছে কিনা তা নির্ধারণ করতে পারে না। অতএব, একটি নির্দিষ্ট পরিমাণে বিলম্ব ঘটায়। এটি ক্ষতি বা সুযোগ মিস হতে পারে। সূচক প্যারামিটারগুলি সামঞ্জস্য করে এই সমস্যাটি হ্রাস করা যেতে পারে।
সমস্ত প্রবণতা-ভিত্তিক কৌশলগুলি একটি আকস্মিক ঘটনা ঘটার পরে বড় ক্ষতি করে। ঝুঁকি নিয়ন্ত্রণের জন্য স্টপ লস সেট করা প্রয়োজন।
অপ্টিমাইজেশান দিক
অন্যান্য সূচকগুলির সাথে মিলিত হয়ে ট্রেন্ড রিভার্সনের পূর্বাভাস দেওয়া বিবেচনা করা যেতে পারে, যেমন ব্রিনস ব্যান্ডের সাথে দামের অতিরিক্ত প্রসারণের বিষয়ে সিদ্ধান্ত নেওয়া।
জরুরী ক্ষতির ব্যবস্থা অপ্রত্যাশিত ঘটনাগুলির জন্য ডিজাইন করা যেতে পারে। উদাহরণস্বরূপ, একদিনে 5% এর বেশি লোকসান হলে বাধ্যতামূলক ক্ষতির সূচনা করা যায়।
সারসংক্ষেপ
মাল্টি-টাইম-এক্স ট্রেন্ড ট্র্যাকিং কৌশলটি 20 টিরও বেশি সূচক বিচার প্রবণতাকে একত্রিত করে, যা বাজারের প্রবণতাকে পুরোপুরি প্রকাশ করে এবং মিথ্যা সংকেত এড়াতে পারে। এটি একটি অত্যন্ত কার্যকর প্রবণতা ট্র্যাকিং কৌশল। উপযুক্ত স্টপ লস এবং অপ্টিমাইজড সূচক প্যারামিটার সেট করে, ঝুঁকি নিয়ন্ত্রণের শর্তে ভাল রিটার্ন পাওয়া যায়।
/*backtest
start: 2023-01-16 00:00:00
end: 2024-01-22 00:00:00
period: 1d
basePeriod: 1h
exchanges: [{"eid":"Futures_Binance","currency":"BTC_USDT"}]
*/

// This source code is subject to the terms of the Mozilla Public License 2.0 at https://mozilla.org/MPL/2.0/
// @version=5
// Author = TradeAutomation


strategy(title="Multi MA Trend Following Strategy Template", shorttitle="Multi Trend", process_orders_on_close=true, overlay=true, commission_type=strategy.commission.cash_per_order, commission_value=1, slippage = 0, margin_short = 75, margin_long = 75, initial_capital = 100000000, default_qty_type=strategy.percent_of_equity, default_qty_value=100)

// Backtest Date Range Inputs //
StartTime = input(defval=timestamp('01 Jan 2019 05:00 +0000'), group="Date Rangte", title='Start Time')
EndTime = input(defval=timestamp('01 Jan 2099 00:00 +0000'), group="Date Range", title='End Time')
InDateRange = true

// Trend Selector //
TrendSelectorInput = input.string(title="Trend Selector", defval="JMA", group="Core Settings", options=["ALMA", "DEMA", "EMA", "HMA", "JMA", "KAMA", "Linear Regression (LSMA)", "RMA", "SMA", "SMMA", "Source", "SuperTrend", "TEMA", "TMA", "VAMA", "VIDYA", "VMA", "VWMA", "WMA", "WWMA", "ZLEMA"], tooltip="Select your moving average")
src = input.source(close, "Source", group="Core Settings", tooltip="This is the price source being used for the moving averages to calculate based on")
length = input.int(200, "MA Length", group="Core Settings", tooltip="This is the amount of historical bars being used for the moving averages to calculate based on")
LineWidth = input.int(2, "Line Width", group="Core Settings", tooltip="This is the width of the line plotted that represents the selected trend")

// Individual Moving Average / Regression Setting //
AlmaOffset = input.float(0.85, "ALMA Offset", group="Individual MA Settings", tooltip="This only applies when ALMA is selected")
AlmaSigma = input.float(6, "ALMA Sigma", group="Individual MA Settings", tooltip="This only applies when ALMA is selected")
ATRFactor = input.float(3, "ATR Multiplier For SuperTrend", group="Individual MA Settings", tooltip="This only applies when SuperTrend is selected")
ATRLength = input.int(12, "ATR Length For SuperTrend", group="Individual MA Settings", tooltip="This only applies when SuperTrend is selected")
JMApower = input.int(2, "JMA Power Parameter", group="Individual MA Settings", tooltip="This only applies when JMA is selected")
KamaAlpha = input.float(3, "KAMA's Alpha", minval=1,step=0.5, group="Individual MA Settings", tooltip="This only applies when KAMA is selected")
LinRegOffset = input.int(0, "Linear Regression Offset", group="Individual MA Settings", tooltip="This only applies when Linear Regression is selected")
VAMALookback =input.int(12, "VAMA Volatility lookback", group="Individual MA Settings", tooltip="This only applies when VAMA is selected")

// Trend Indicators in Library //
ALMA = ta.alma(src, length, AlmaOffset, AlmaSigma)
EMA = ta.ema(src, length)
HMA = ta.hma(src, length)
LinReg = ta.linreg(src, length, LinRegOffset)
RMA = ta.rma(src, length)
SMA = ta.sma(src, length)
VWMA = ta.vwma(src, length)
WMA = ta.wma(src, length)

// Additional Trend Indicators Written and/or Open Sourced //
//DEMA
de1 = ta.ema(src, length)
de2 = ta.ema(de1, length)
DEMA = 2 * de1 - de2

//JMA [Capissmo]
beta = 0.45*(length-1)/(0.45*(length-1)+2)
alpha = math.pow(beta, JMApower)
L0=0.0, L1=0.0, L2=0.0, L3=0.0, JMA=0.0
L0 := (1-alpha)*src + alpha*nz(L0[1])
L1 := (src - L0[0])*(1-beta) + beta*nz(L1[1])
L2 := L0[0] + L1[0]
L3 := (L2[0] - nz(JMA[1]))*((1-alpha)*(1-alpha)) + (alpha*alpha)*nz(L3[1])
JMA := nz(JMA[1]) + L3[0]

//KAMA
var KAMA = 0.0
fastAlpha = 2.0 / (KamaAlpha + 1)
slowAlpha = 2.0 / 31
momentum = math.abs(ta.change(src, length))
volatility = math.sum(math.abs(ta.change(src)), length)
efficiencyRatio = volatility != 0 ? momentum / volatility : 0
smoothingConstant = math.pow((efficiencyRatio * (fastAlpha - slowAlpha)) + slowAlpha, 2)
KAMA := nz(KAMA[1], src) + smoothingConstant * (src - nz(KAMA[1], src))

//SMMA
var SMMA = 0.0
SMMA := na(SMMA[1]) ? ta.sma(src, length) : (SMMA[1] * (length - 1) + src) / length

//SuperTrend
ATR = ta.atr(ATRLength)
Signal = ATRFactor*ATR
var SuperTrend = 0.0
SuperTrend := if src>SuperTrend[1] and src[1]>SuperTrend[1]
    math.max(SuperTrend[1], src-Signal)
else if src<SuperTrend[1] and src[1]<SuperTrend[1]
    math.min(SuperTrend[1], src+Signal)
else if src>SuperTrend[1]
    src-Signal
else
    src+Signal

//TEMA
t1 = ta.ema(src, length)
t2 = ta.ema(t1, length)
t3 = ta.ema(t2, length)
TEMA = 3 * (t1 - t2) + t3

//TMA
TMA = ta.sma(ta.sma(src, math.ceil(length / 2)), math.floor(length / 2) + 1)

//VAMA
mid=ta.ema(src,length)
dev=src-mid
vol_up=ta.highest(dev,VAMALookback)
vol_down=ta.lowest(dev,VAMALookback)
VAMA = mid+math.avg(vol_up,vol_down)

//VIDYA [KivancOzbilgic]
var VIDYA=0.0
VMAalpha=2/(length+1)
ud1=src>src[1] ? src-src[1] : 0
dd1=src<src[1] ? src[1]-src : 0
UD=math.sum(ud1,9)
DD=math.sum(dd1,9)
CMO=nz((UD-DD)/(UD+DD))
VIDYA := na(VIDYA[1]) ? ta.sma(src, length) : nz(VMAalpha*math.abs(CMO)*src)+(1-VMAalpha*math.abs(CMO))*nz(VIDYA[1])

//VMA [LazyBear]
sc = 1/length
pdm = math.max((src - src[1]), 0)
mdm = math.max((src[1] - src), 0)
var pdmS = 0.0
var mdmS = 0.0
pdmS := ((1 - sc)*nz(pdmS[1]) + sc*pdm)
mdmS := ((1 - sc)*nz(mdmS[1]) + sc*mdm)
s = pdmS + mdmS
pdi = pdmS/s
mdi = mdmS/s
var pdiS = 0.0
var mdiS = 0.0
pdiS := ((1 - sc)*nz(pdiS[1]) + sc*pdi)
mdiS := ((1 - sc)*nz(mdiS[1]) + sc*mdi)
d = math.abs(pdiS - mdiS)
s1 = pdiS + mdiS
var iS = 0.0
iS := ((1 - sc)*nz(iS[1]) + sc*d/s1)
hhv = ta.highest(iS, length)
llv = ta.lowest(iS, length)
d1 = hhv - llv
vi = (iS - llv)/d1
var VMA=0.0
VMA := sc*vi*src + (1 - sc*vi)*nz(VMA[1])

//WWMA
var WWMA=0.0
WWMA := (1/length)*src + (1-(1/length))*nz(WWMA[1])

//Zero Lag EMA
EMA1 = ta.ema(src,length)
EMA2 = ta.ema(EMA1,length)
Diff = EMA1 - EMA2
ZLEMA = EMA1 + Diff

// Trend Mapping and Plotting //
Trend = TrendSelectorInput == "ALMA" ? ALMA : TrendSelectorInput == "DEMA" ? DEMA : TrendSelectorInput == "EMA" ? EMA : TrendSelectorInput == "HMA" ? HMA : TrendSelectorInput == "JMA" ? JMA : TrendSelectorInput == "KAMA" ? KAMA : TrendSelectorInput == "Linear Regression (LSMA)" ? LinReg : TrendSelectorInput == "RMA" ? RMA : TrendSelectorInput == "SMA" ? SMA : TrendSelectorInput == "SMMA" ? SMMA : TrendSelectorInput == "Source" ? src : TrendSelectorInput == "SuperTrend" ? SuperTrend : TrendSelectorInput == "TEMA" ? TEMA : TrendSelectorInput == "TMA" ? TMA : TrendSelectorInput == "VAMA" ? VAMA : TrendSelectorInput == "VIDYA" ? VIDYA : TrendSelectorInput == "VMA" ? VMA : TrendSelectorInput == "VWMA" ? VWMA : TrendSelectorInput == "WMA" ? WMA : TrendSelectorInput == "WWMA" ? WWMA : TrendSelectorInput == "ZLEMA" ? ZLEMA : SMA
plot(Trend, color=(Trend>Trend[1]) ? color.green : (Trend<Trend[1]) ? color.red : (Trend==Trend[1]) ? color.gray : color.black, linewidth=LineWidth)

// Entry & Exit Functions //

if (InDateRange)
    strategy.entry("Long", strategy.long, when = ta.crossover(Trend, Trend[1]))
    strategy.close("Long", when = ta.crossunder(Trend, Trend[1]))
if (not InDateRange)
    strategy.close_all()