ADX সূচকের উপর ভিত্তি করে অপরিশোধিত তেল প্রবণতা ট্র্যাকিং কৌশল
ওভারভিউ
এই কৌশলটি কেভিন ডেভির ফ্রি তেল ফিউচার ট্রেডিং কৌশলটির উপর ভিত্তি করে তৈরি করা হয়েছে। এই কৌশলটি তেল বাজারের প্রবণতা নির্ধারণের জন্য এডিএক্স সূচক ব্যবহার করে, দামের ব্রেকথ্রু নীতির সাথে মিলিত করে, একটি সহজ ব্যবহারিক তেল স্বয়ংক্রিয় ট্রেডিং কৌশল বাস্তবায়ন করে।
কৌশল নীতি
- ADX সূচক গণনা 14 চক্র
- যখন ADX> 10 হয়, তখন ট্রেন্ডিং বলে মনে করা হয়
- যদি বন্ধের মূল্য 65 কে লাইনের আগে বন্ধের মূল্যের চেয়ে বেশি হয়, তবে দামটি একটি ব্রেকডাউন নির্দেশ করে, একটি দীর্ঘ পজিশনের সংকেত
- যদি বন্ধের মূল্য 65 কে লাইনের আগে বন্ধের মূল্যের চেয়ে কম হয়, তবে এটি একটি মূল্য বিরতি নির্দেশ করে, একটি সংক্ষিপ্ত অবস্থান সংকেত
- প্রবেশের পরে ক্ষতি এবং স্টপ সেট করুন
এই কৌশলটি মূলত ADX সূচকের উপর নির্ভর করে ট্রেন্ডিংয়ের উপর নির্ভর করে এবং ট্রেন্ডিংয়ের ক্ষেত্রে স্থির চক্রের দামের উপর ভিত্তি করে ট্রেডিং সংকেত তৈরি করে। পুরো কৌশলটির যুক্তিটি খুব সহজ এবং পরিষ্কার।
কৌশলগত শক্তি বিশ্লেষণ
- ট্রেন্ডিংয়ের সুযোগ হাতছাড়া না করার জন্য ADX ব্যবহার করুন
- স্থির চক্রের দামের ব্রেকডাউন একটি সংকেত দেয়, যা আরও ভালভাবে পরিমাপ করে
- কোডটি স্বজ্ঞাত, সংক্ষিপ্ত, সহজে বোঝা যায় এবং পরিবর্তন করা যায়
- কেভিন ডেভি ল্যাবরেটরিতে বহু বছর ধরে পরীক্ষা করে দেখেছেন যে এটি বক্ররেখার সাথে সামঞ্জস্যপূর্ণ নয়
কৌশলগত ঝুঁকি বিশ্লেষণ
- ADX প্রধান সূচক হিসাবে, প্যারামিটার নির্বাচন এবং বিরতি চক্র নির্বাচন সংবেদনশীল
- স্থির চক্র ভেঙে কিছু সুযোগ মিস করা হতে পারে
- ভুলভাবে সেট করা স্টপ লস স্টপ ক্ষতি বাড়াতে পারে
- রিয়েল-ডিস্কের প্রভাব এবং রিটার্নিংয়ের মধ্যে পার্থক্যের সম্ভাবনা
কৌশল অপ্টিমাইজেশনের দিকনির্দেশনা
- ADX প্যারামিটার এবং বিরতি চক্র অপ্টিমাইজ করুন
- হোল্ডিংয়ের গতিশীলতা বৃদ্ধি
- পুনঃনিরীক্ষণের ফলাফল এবং পরীক্ষার ভিত্তিতে ক্রমাগত পরিবর্তন এবং উন্নত কৌশল
- মেশিন লার্নিং এবং ডিপ লার্নিং প্রযুক্তি ব্যবহার করে কৌশলগত উন্নতি করা।
সারসংক্ষেপ
এই কৌশলটি সামগ্রিকভাবে একটি খুব ব্যবহারিক অপরিশোধিত তেল ট্রেডিং কৌশল। এটি এডিএক্স সূচক ব্যবহার করে প্রবণতা নির্ধারণের জন্য খুব যুক্তিসঙ্গত, দামের বিরতির নীতিটি সহজ এবং কার্যকর, এবং এটি ভালভাবে পর্যালোচনা করা হয়। একই সাথে, কেভিন ডেভির একটি উন্মুক্ত ফ্রি কৌশল হিসাবে, এটির দৃ strong় বাস্তব নির্ভরযোগ্যতা রয়েছে। যদিও কৌশলটিতে কিছু উন্নতির জায়গা রয়েছে, তবে এটি একটি খুব উপযুক্ত বিকল্প।
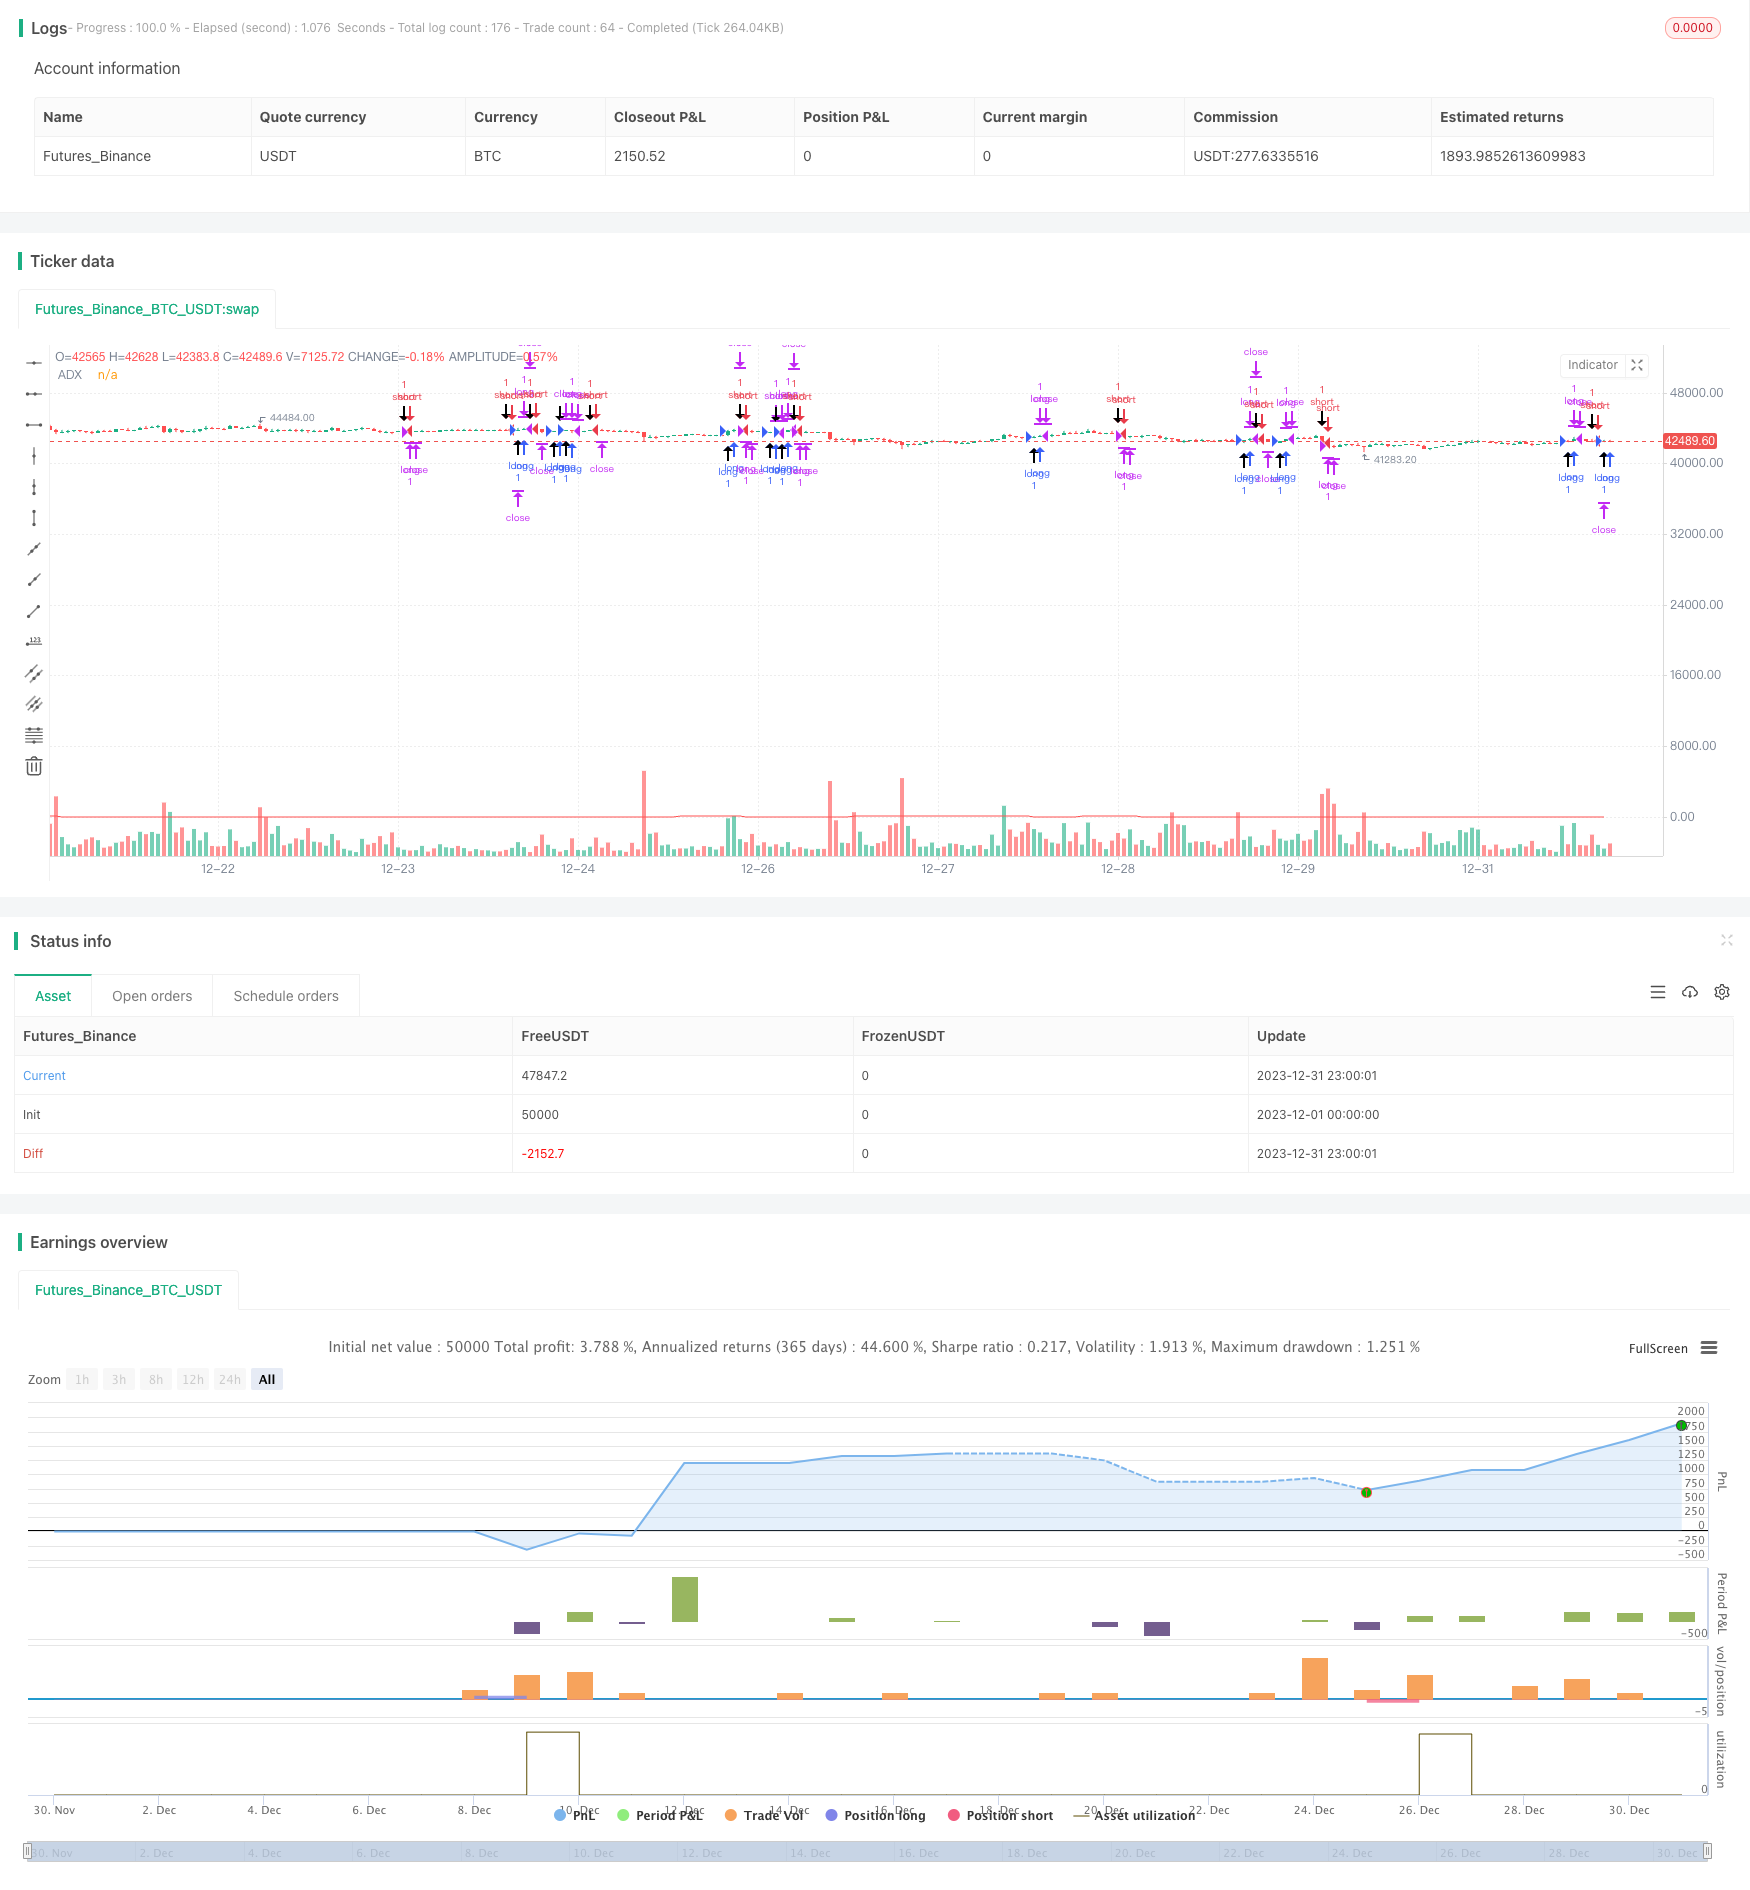
/*backtest
start: 2023-12-01 00:00:00
end: 2023-12-31 23:59:59
period: 1h
basePeriod: 15m
exchanges: [{"eid":"Futures_Binance","currency":"BTC_USDT"}]
*/

// Strategy idea coded from EasyLanguage to Pinescript
//@version=5
strategy("Kevin Davey Crude free crude oil strategy", shorttitle="CO Fut", format=format.price, precision=2, overlay = true, calc_on_every_tick = true)
adxlen = input(14, title="ADX Smoothing")
dilen = input(14, title="DI Length")
dirmov(len) =>
	up = ta.change(high)
	down = -ta.change(low)
	plusDM = na(up) ? na : (up > down and up > 0 ? up : 0)
	minusDM = na(down) ? na : (down > up and down > 0 ? down : 0)
	truerange = ta.rma(ta.tr, len)
	plus = fixnan(100 * ta.rma(plusDM, len) / truerange)
	minus = fixnan(100 * ta.rma(minusDM, len) / truerange)
	[plus, minus]
adx(dilen, adxlen) =>
	[plus, minus] = dirmov(dilen)
	sum = plus + minus
	adx = 100 * ta.rma(math.abs(plus - minus) / (sum == 0 ? 1 : sum), adxlen)
sig = adx(dilen, adxlen)
plot(sig, color=color.red, title="ADX")

buy = sig > 10 and (close - close[65]) > 0 and (close - close[65])[1] < 0
sell = sig > 10 and (close - close[65]) < 0 and (close - close[65])[1] > 0

plotshape(buy, style = shape.arrowup, location = location.belowbar,size = size.huge)
plotshape(sell, style = shape.arrowdown, location = location.abovebar,size = size.huge)

if buy
	strategy.entry("long", strategy.long)
if sell
	strategy.entry("short", strategy.short)

if strategy.position_size != 0
	strategy.exit("long", profit = 450, loss = 300)
	strategy.exit("short", profit = 450, loss = 300)


// GetTickValue() returns the currency value of the instrument's
// smallest possible price movement.
GetTickValue() =>
    syminfo.mintick * syminfo.pointvalue

// On the last historical bar, make a label to display the
// instrument's tick value
if barstate.islastconfirmedhistory
    label.new(x=bar_index + 1, y=close, style=label.style_label_left,
         color=color.black, textcolor=color.white, size=size.large,
         text=syminfo.ticker + " has a tick value of:\n" +
             syminfo.currency + " " + str.tostring(GetTickValue()))