সমর্থন এবং প্রতিরোধ সুইং ট্রেডিং কৌশল
সৃষ্টির তারিখ:
2024-01-25 15:53:06
অবশেষে সংশোধন করুন:
2024-01-25 15:53:06
অনুলিপি:
2
ক্লিকের সংখ্যা:
603
1
ফোকাস
1750
অনুসারী
ওভারভিউ
এই কৌশলটি আরএসআই, এলোমেলো সূচকগুলির সাথে ক্রস কৌশল এবং পজিশন স্লিপিং পয়েন্ট অপ্টিমাইজেশনের কৌশলগুলির সাথে একত্রিত করে ট্রেডিং লজিকের সুনির্দিষ্ট নিয়ন্ত্রণ এবং সঠিক স্টপ লস স্টপকে উপলব্ধ করে। একই সাথে, সংকেত অপ্টিমাইজেশনের প্রবর্তনের মাধ্যমে, প্রবণতা আরও ভালভাবে নিয়ন্ত্রণ করা যায়, তহবিলের যুক্তিসঙ্গত পরিচালনা করা যায়।
কৌশল নীতি
- আরএসআই সূচকটি ওভার-বই ওভার-সোল্ড অঞ্চলের বিচার করে এবং এলোমেলো সূচক কে এবং ডি এর মানের সাথে গোল্ডেন ফর্কের ডাইফোর্ক ট্রেডিং সিগন্যাল গঠন করে।
- ট্রেডিং ত্রুটি এড়ানোর জন্য K-লাইনগুলির জন্য প্রকারভেদ সনাক্তকরণ প্রবর্তন করা হয়েছে।
- এসএমএ গড় লাইন ট্রেন্ডের দিকনির্দেশনা নির্ধারণে সহায়তা করে। স্বল্পমেয়াদী গড় লাইন নীচে থেকে দীর্ঘমেয়াদী গড় লাইনকে অতিক্রম করার সময় এটি একটি মুনাফা সংকেত।
- সমতল পজিশনের স্লাইড পয়েন্ট কৌশল, সর্বোচ্চ মূল্যের সর্বনিম্ন মূল্যের ওঠানামা অনুযায়ী স্টপ লস স্টপ মূল্য সেট করুন।
সামর্থ্য বিশ্লেষণ
- RSI সূচক প্যারামিটারগুলি অপ্টিমাইজ করা হয়েছে যাতে ওভার-বয় ওভার-সোল্ড অঞ্চলগুলি ভালভাবে বিচার করা যায় এবং ভুল লেনদেন এড়ানো যায়
- STO সূচক প্যারামিটার অপ্টিমাইজ করা হয়, মসৃণতা প্যারামিটার নিয়ন্ত্রণ করা হয়, যাতে শব্দ নির্মূল করা যায় এবং সংকেতের গুণমান উন্নত করা যায়
- হেইকিন-আশি প্রযুক্তিগত বিশ্লেষণের প্রবর্তন, কে-লাইন সত্তার দিক পরিবর্তন সনাক্তকরণ, ট্রেডিং সিগন্যালের নির্ভুলতা নিশ্চিত করা
- এসএমএ গড় লাইন বিপরীতমুখী ট্রেডিং এড়াতে বড় প্রবণতা দিক নির্ধারণে সহায়তা করে
- স্টপস্টপ স্টপ লস স্লাইড পয়েন্ট কৌশল সহ, প্রতিটি লেনদেনের মুনাফা সর্বাধিকভাবে লক করা যায়
ঝুঁকি বিশ্লেষণ
- বড় বাজার ক্রমাগত পতনের ফলে তহবিলের ঝুঁকি বেশি
- ট্রেডিং ফ্রিকোয়েন্সি খুব বেশি হতে পারে, যার ফলে ট্রেডিং খরচ এবং স্লাইড পয়েন্ট খরচ বৃদ্ধি পায়
- RSI সূচকগুলি মিথ্যা সংকেত তৈরি করতে পারে এবং অন্যান্য সূচকগুলির সাথে মিলিত হওয়া উচিত
কৌশল অপ্টিমাইজেশন
- আরএসআই প্যারামিটারগুলিকে সামঞ্জস্য করে ওভার-বই ওভার-সেলিংয়ের সিদ্ধান্তকে অপ্টিমাইজ করুন
- STO সূচক প্যারামিটার, মসৃণতা এবং চক্রের সমন্বয়, সংকেত মান উন্নত
- চলমান গড় চক্রের সমন্বয়, প্রবণতা বিচার অপ্টিমাইজ করুন
- সিগন্যালের সঠিকতা বাড়াতে আরও প্রযুক্তিগত সূচক প্রবর্তন করা
- স্টপ লস ও স্টপ-অফ অনুপাতের অপ্টিমাইজেশান, একক লেনদেনের ঝুঁকি হ্রাস
সারসংক্ষেপ
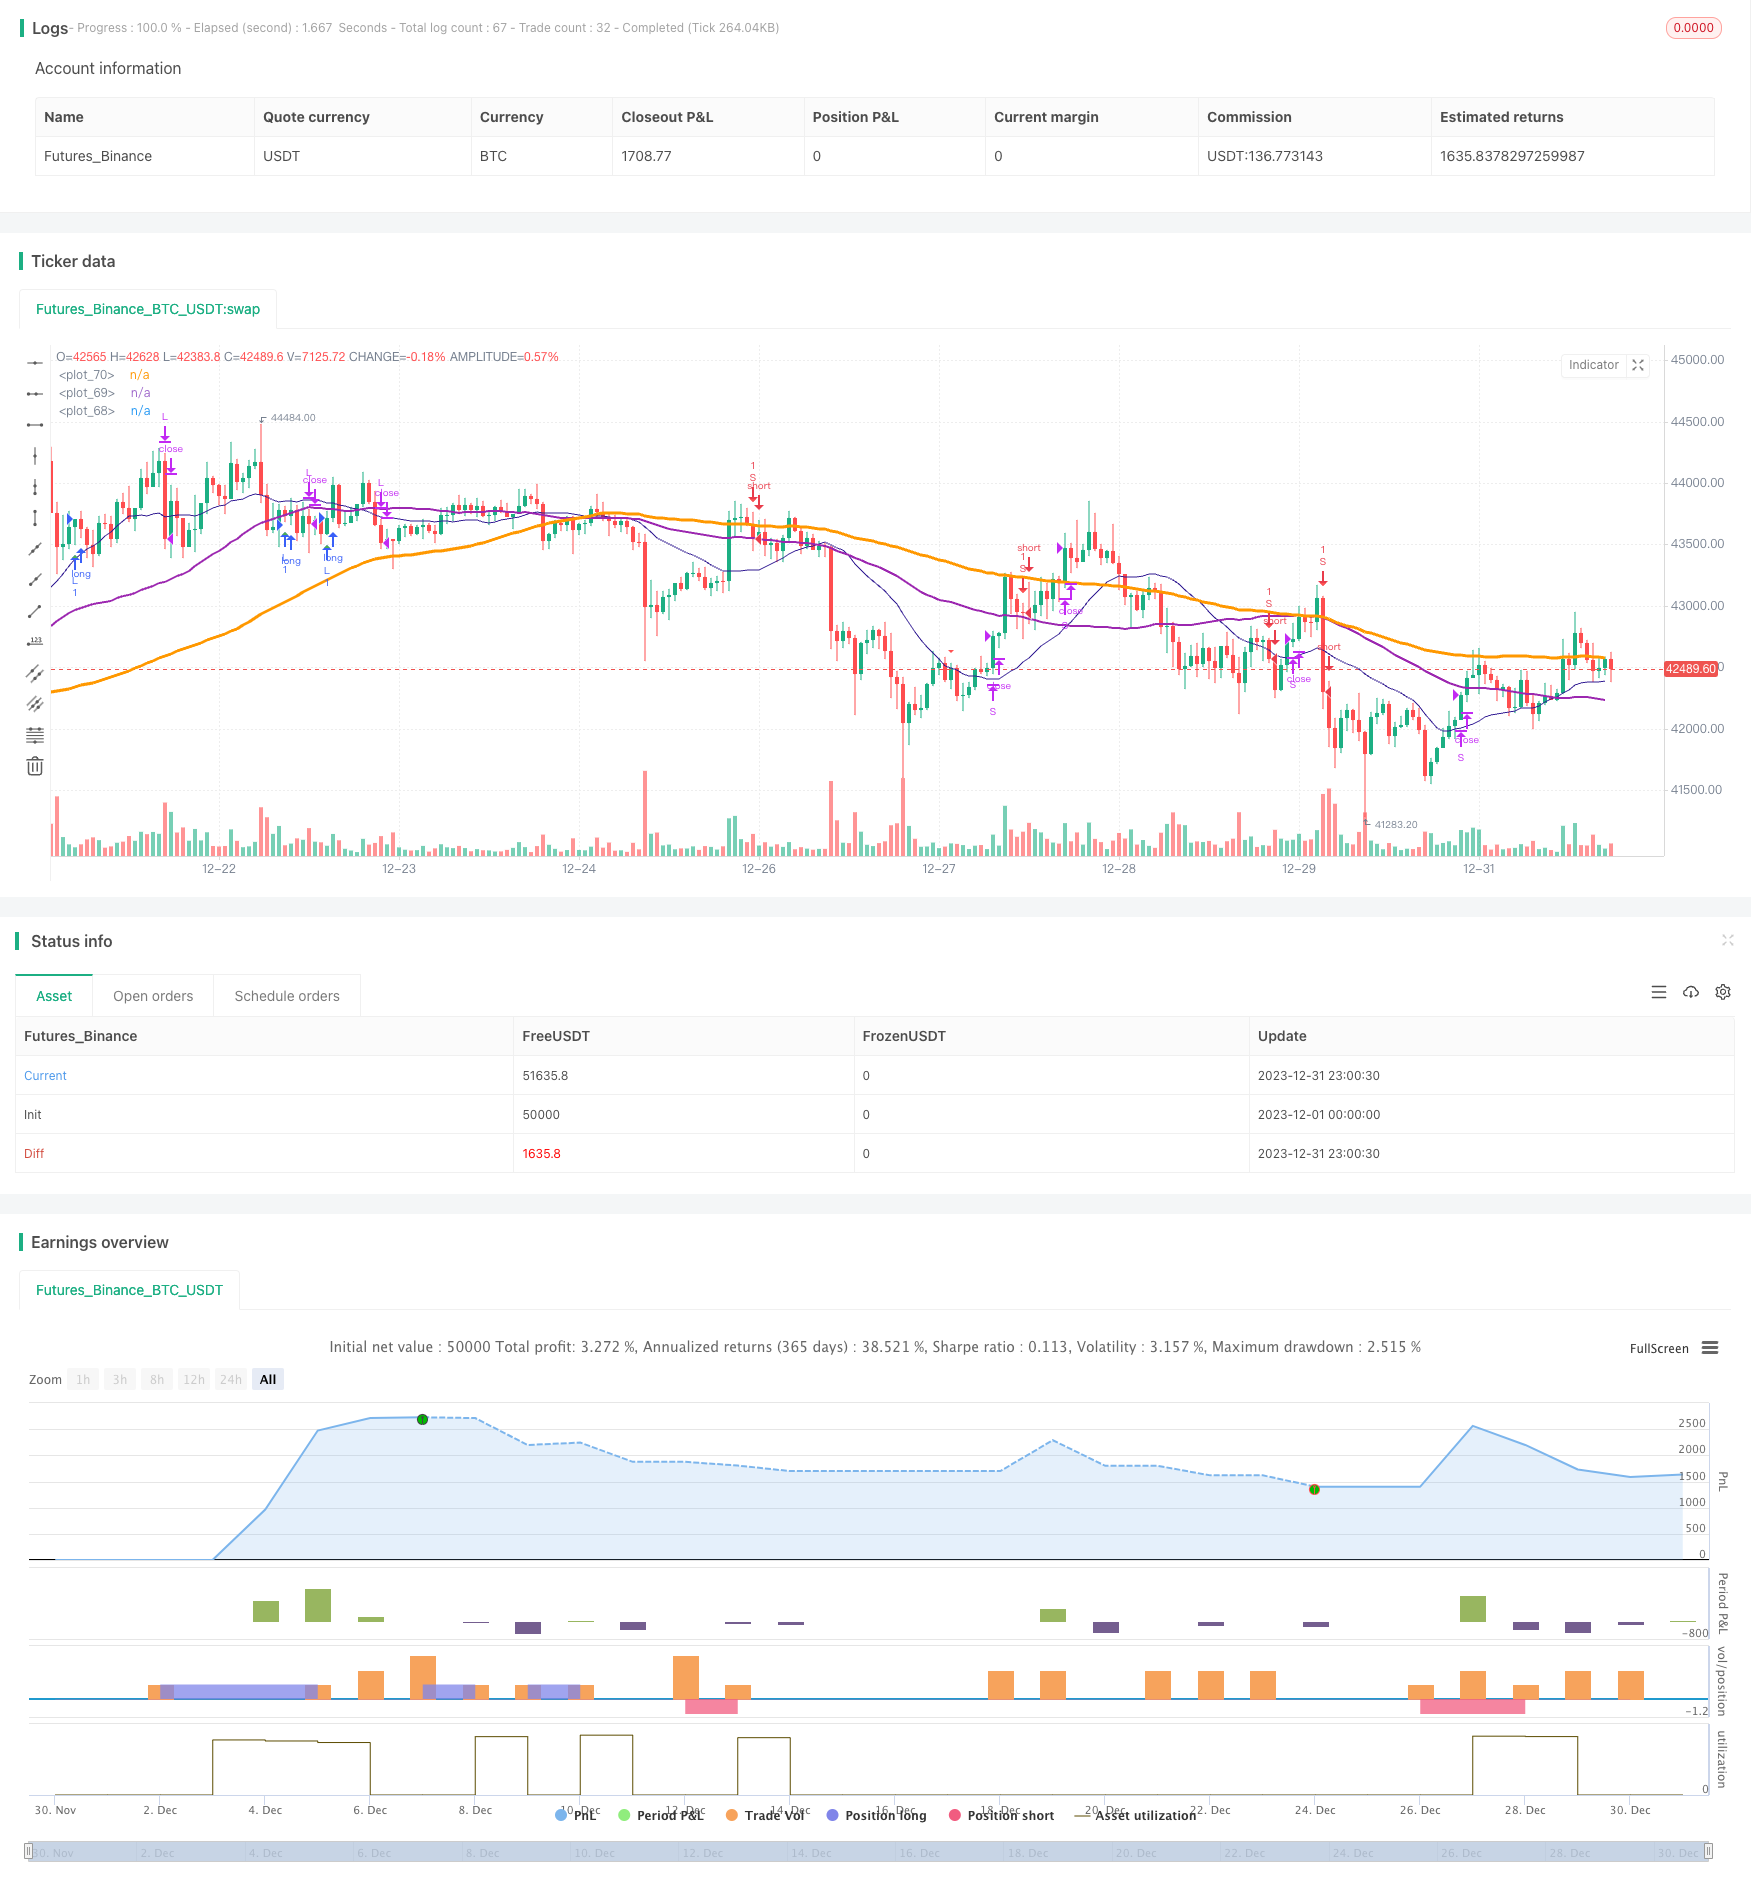
এই কৌশলটি বেশ কয়েকটি মূলধারার প্রযুক্তিগত সূচকের সুবিধাগুলিকে একত্রিত করে, প্যারামিটার অপ্টিমাইজেশন এবং নিয়মের নিখুঁততার মাধ্যমে, ট্রেডিং সিগন্যালের গুণমান এবং স্টপ-অফ-ক্ষতির ভারসাম্য অর্জন করে। এর একটি নির্দিষ্ট সার্বজনীনতা এবং স্থিতিশীল লাভজনকতা রয়েছে। ক্রমাগত অপ্টিমাইজেশনের মাধ্যমে, জয় এবং লাভের হার আরও বাড়ানো যেতে পারে।
কৌশল সোর্স কোড
/*backtest
start: 2023-12-01 00:00:00
end: 2023-12-31 23:59:59
period: 1h
basePeriod: 15m
exchanges: [{"eid":"Futures_Binance","currency":"BTC_USDT"}]
*/

//@version=4
//study(title="@sentenzal strategy", shorttitle="@sentenzal strategy", overlay=true)
strategy(title="@sentenzal strategy", shorttitle="@sentenzal strategy", overlay=true  )
smoothK = input(3, minval=1)
smoothD = input(3, minval=1)
lengthRSI = input(14, minval=1)
lengthStoch = input(14, minval=1)
overbought = input(80, minval=1)
oversold = input(20, minval=1)
smaLengh = input(100, minval=1)
smaLengh2 = input(50, minval=1)
smaLengh3 = input(20, minval=1)

src = input(close, title="RSI Source")
testStartYear = input(2017, "Backtest Start Year")
testStartMonth = input(1, "Backtest Start Month")
testStartDay = input(1, "Backtest Start Day")
testPeriodStart = timestamp(testStartYear,testStartMonth,testStartDay,0,0)
testPeriod() =>
    time >= testPeriodStart ? true : false

rsi1 = rsi(src, lengthRSI)
k = sma(stoch(rsi1, rsi1, rsi1, lengthStoch), smoothK)
d = sma(k, smoothD)
crossBuy = crossover(k, d) and k < oversold
crossSell = crossunder(k, d) and k > overbought

dcLower = lowest(low, 10)
dcUpper = highest(high, 10)


heikinashi_close = security(heikinashi(syminfo.tickerid), timeframe.period, close)
heikinashi_open = security(heikinashi(syminfo.tickerid), timeframe.period, open)
heikinashi_low = security(heikinashi(syminfo.tickerid), timeframe.period, low)
heikinashi_high = security(heikinashi(syminfo.tickerid), timeframe.period, high)
heikinashiPositive = heikinashi_close >= heikinashi_open

heikinashiBuy = heikinashiPositive == true and heikinashiPositive[1] == false  and heikinashiPositive[2] == false
heikinashiSell = heikinashiPositive == false and heikinashiPositive[1] == true and heikinashiPositive[2] == true

//plotshape(heikinashiBuy, style=shape.arrowup, color=green, location=location.belowbar, size=size.tiny)
//plotshape(heikinashiSell, style=shape.arrowdown, color=red, location=location.abovebar, size=size.tiny)

buy = (crossBuy == true or crossBuy[1] == true or crossBuy[2] == true) and (heikinashiBuy == true or heikinashiBuy[1] == true or heikinashiBuy[2] == true)
sell = (crossSell == true or crossSell[1] == true or crossSell[2] == true) and (heikinashiSell == true or heikinashiSell[1] == true or heikinashiSell[2] == true)

mult = timeframe.period == '15' ? 4 : 1
mult2 = timeframe.period == '240' ? 0.25 : mult

movingAverage = sma(close, round(smaLengh))
movingAverage2 = sma(close, round(smaLengh2))
movingAverage3 = sma(close, round(smaLengh3))

uptrend = movingAverage < movingAverage2 and movingAverage2 < movingAverage3 and close > movingAverage
downtrend = movingAverage > movingAverage2 and movingAverage2 > movingAverage3 and close < movingAverage

signalBuy = (buy[1] == false and buy[2] == false and buy == true) and uptrend
signalSell = (sell[1] == false and sell[2] == false and sell == true) and downtrend

takeProfitSell = (buy[1] == false and buy[2] == false and buy == true) and uptrend == false
takeProfitBuy = (sell[1] == false and sell[2] == false and sell == true)  and uptrend

plotshape(signalBuy, style=shape.triangleup, color=green, location=location.belowbar, size=size.tiny)
plotshape(signalSell, style=shape.triangledown, color=red, location=location.abovebar, size=size.tiny)


plot(movingAverage, linewidth=3, color=orange, transp=0)
plot(movingAverage2, linewidth=2, color=purple, transp=0)
plot(movingAverage3, linewidth=1, color=navy, transp=0)

alertcondition(signalBuy, title='Signal Buy', message='Signal Buy')
alertcondition(signalSell, title='Signal Sell', message='Signal Sell')


strategy.close("L", when=dcLower[1] > low)
strategy.close("S", when=dcUpper[1] < high)

strategy.entry("L", strategy.long, 1, when = signalBuy and testPeriod() and uptrend)
strategy.entry("S", strategy.short, 1, when = signalSell and testPeriod() and uptrend ==false)

//strategy.exit("Exit Long", from_entry = "L", loss = 25000000, profit=25000000)
//strategy.exit("Exit Short", from_entry = "S", loss = 25000000, profit=25000000)