DMI এবং RSI এর উপর ভিত্তি করে কৌশল অনুসরণ করে প্রবণতা
সারসংক্ষেপ
এই কৌশলটি একটি সম্পূর্ণ ট্রেডিং কৌশল অর্জনের জন্য ট্রেডিংয়ের দিকনির্দেশের জন্য ডিএমআই নির্দেশক এবং RSI নির্দেশকের সাথে একত্রিত হয়। যখন ডিএমআই নির্দেশক ট্রেন্ডিংয়ের দিকে নির্দেশ করে এবং আরএসআই নির্দেশকটি ওভার-বাউস বা ওভার-সোল্ড দেখায়, তখন ওভার-বাউস বা শূন্য থাকে। মুনাফা লক করার জন্য একটি চলমান স্টপ-লস সেট করা হয়।
কৌশলগত নীতি
- ট্রেন্ডের দিকনির্দেশনা জানার জন্য DMI ব্যবহার করুন
- ডিএমআই তিনটি কার্ভ নিয়ে গঠিতঃ + ডিআই উত্থানের প্রবণতা নির্দেশ করে, - ডিআই পতনের প্রবণতা নির্দেশ করে, এবং এডিএক্স প্রবণতার শক্তি নির্ধারণ করে
- যখন + ডিআই> - ডিআই একটি উত্থান প্রবণতা হয়, আরও করুন; যখন - ডিআই> + ডিআই একটি পতন প্রবণতা হয়, খালি করুন
- আরএসআই দ্বারা ওভারবয় ওভারসোল্ড
- RSI একটি সময়ের মধ্যে গড় বন্ধের উত্থান এবং পতনের তুলনা করে ওভারবয় বা ওভারসোল্ডের বিচার করে
- আরএসআই ৩০ এর নিচে ওভারসোল্ড, ৭০ এর উপরে ওভারব্রিড
- ট্রেন্ডের দিকনির্দেশনা নির্ধারণের জন্য ডিএমআই এবং ওভারবয় ওভারসেলের জন্য আরএসআই ব্যবহার করে বাজারের গতি সম্পর্কে আরও ভাল ধারণা পাওয়া যায়
- ডিএমআই অনুমান করে যে যখন RSI ওভারসোল্ড হয় তখন আরও ভাল করার জন্য আরও সময় থাকে
- ডিএমআই সিদ্ধান্ত নিয়েছে যে এটি একটি নেমে যাওয়ার প্রবণতা এবং যখন আরএসআই অতিরিক্ত ক্রয় করে তখন এটি একটি ভাল সময়
- মুনাফা লক করার জন্য একটি চলমান স্টপ সেট করুন
সুবিধা বিশ্লেষণ
এটি একটি পরিপক্ক এবং স্থিতিশীল ট্রেন্ড ফলোয়ার কৌশল যার নিম্নলিখিত সুবিধাগুলি রয়েছেঃ
- প্রবণতা বিচার এবং ওভারবয় ওভারসেলিং বিচার একত্রিত করে, বাজারের ঝড়ের সময় ঘন ঘন লেনদেন এড়ানো
- জনপ্রিয় সূচক ডিএমআই এবং আরএসআই ব্যবহার করে, প্যারামিটার নির্বাচন করা সহজ, অনুশীলনটি ভালভাবে যাচাই করে
- মুনাফা লক করার জন্য একটি চলমান স্টপ সেট করুন, যা স্টপ ক্ষতির একটি নির্দিষ্ট পরিমাণ এড়াতে পারে
- নিয়মগুলি পরিষ্কার এবং সহজেই বোঝা যায়, পদ্ধতিগুলি সহজ এবং কার্যকর করা সহজ
ঝুঁকি বিশ্লেষণ
এই কৌশলটির কিছু ঝুঁকি রয়েছে যা সম্পর্কে সতর্ক থাকা দরকারঃ
- ডিএমআই এবং আরএসআই উভয়ই মিথ্যা সংকেত তৈরি করতে পারে যা অপ্রয়োজনীয় ক্ষতির কারণ হতে পারে
- মোবাইল স্টপ সেটিংটি ভুল হলে, স্টপিংটি খুব বেশি বা খুব তাড়াতাড়ি হতে পারে
- ভয়াবহ ভূমিকম্পের ঘটনাকে ফিল্টার করতে না পারায়, এটি সহজেই আটকে যায়
- ট্রেন্ডিং কৌশল অনুসরণ করে, ট্রেন্ডের বিপরীতে সময়মতো স্টপ লস করা যায় না
অনুকূলিতকরণের দিকনির্দেশনা
এই কৌশলটি নিম্নলিখিত দিকগুলি থেকেও উন্নত করা যেতে পারেঃ
- অস্থিরতা ফিল্টার সহ অস্থিরতা ফিল্টার
- ক্যান্ডেল ফর্ম্যাট বিচার সহ, ভুয়া ব্রেকডাউন এড়ানো
- একটি উপযুক্ত স্টপ-ড্রপ সীমাবদ্ধতা ক্ষতির সেট আপ করুন একটি গুরুত্বপূর্ণ সমর্থনকারী প্রতিরোধের অবস্থানের কাছাকাছি
- মেশিন লার্নিং মডেল ট্রেন্ডিং যুক্ত করুন
- ডায়নামিক অপ্টিমাইজেশান DMI এবং RSI এর প্যারামিটার
সারসংক্ষেপ
এই কৌশলটি সামগ্রিকভাবে একটি স্থিতিশীল প্রবণতা অনুসরণ কৌশল, DMI দ্বারা প্রবণতা দিক নির্ণয়, RSI দ্বারা ওভারবাইট এবং ওভারসোল্ড নির্ণয়, যাতে মধ্যম দীর্ঘ লাইন ট্রেডিং সুযোগ দখল। একই সাথে মুনাফা লক করার জন্য একটি চলমান ক্ষতি সেট করুন। এই কৌশলটি প্যারামিটার নির্বাচন সহজ, ট্রেডিং নিয়ম পরিষ্কার এবং সহজেই অনুশীলন করা যায়। তবে পর্যাপ্ত সময়মত বন্ধ এবং ক্ষতির ঝুঁকিও রয়েছে। কিছু প্যারামিটার এবং মডেল অপ্টিমাইজেশনের মাধ্যমে এই কৌশলটির কার্যকারিতা আরও ভাল করা যায়।
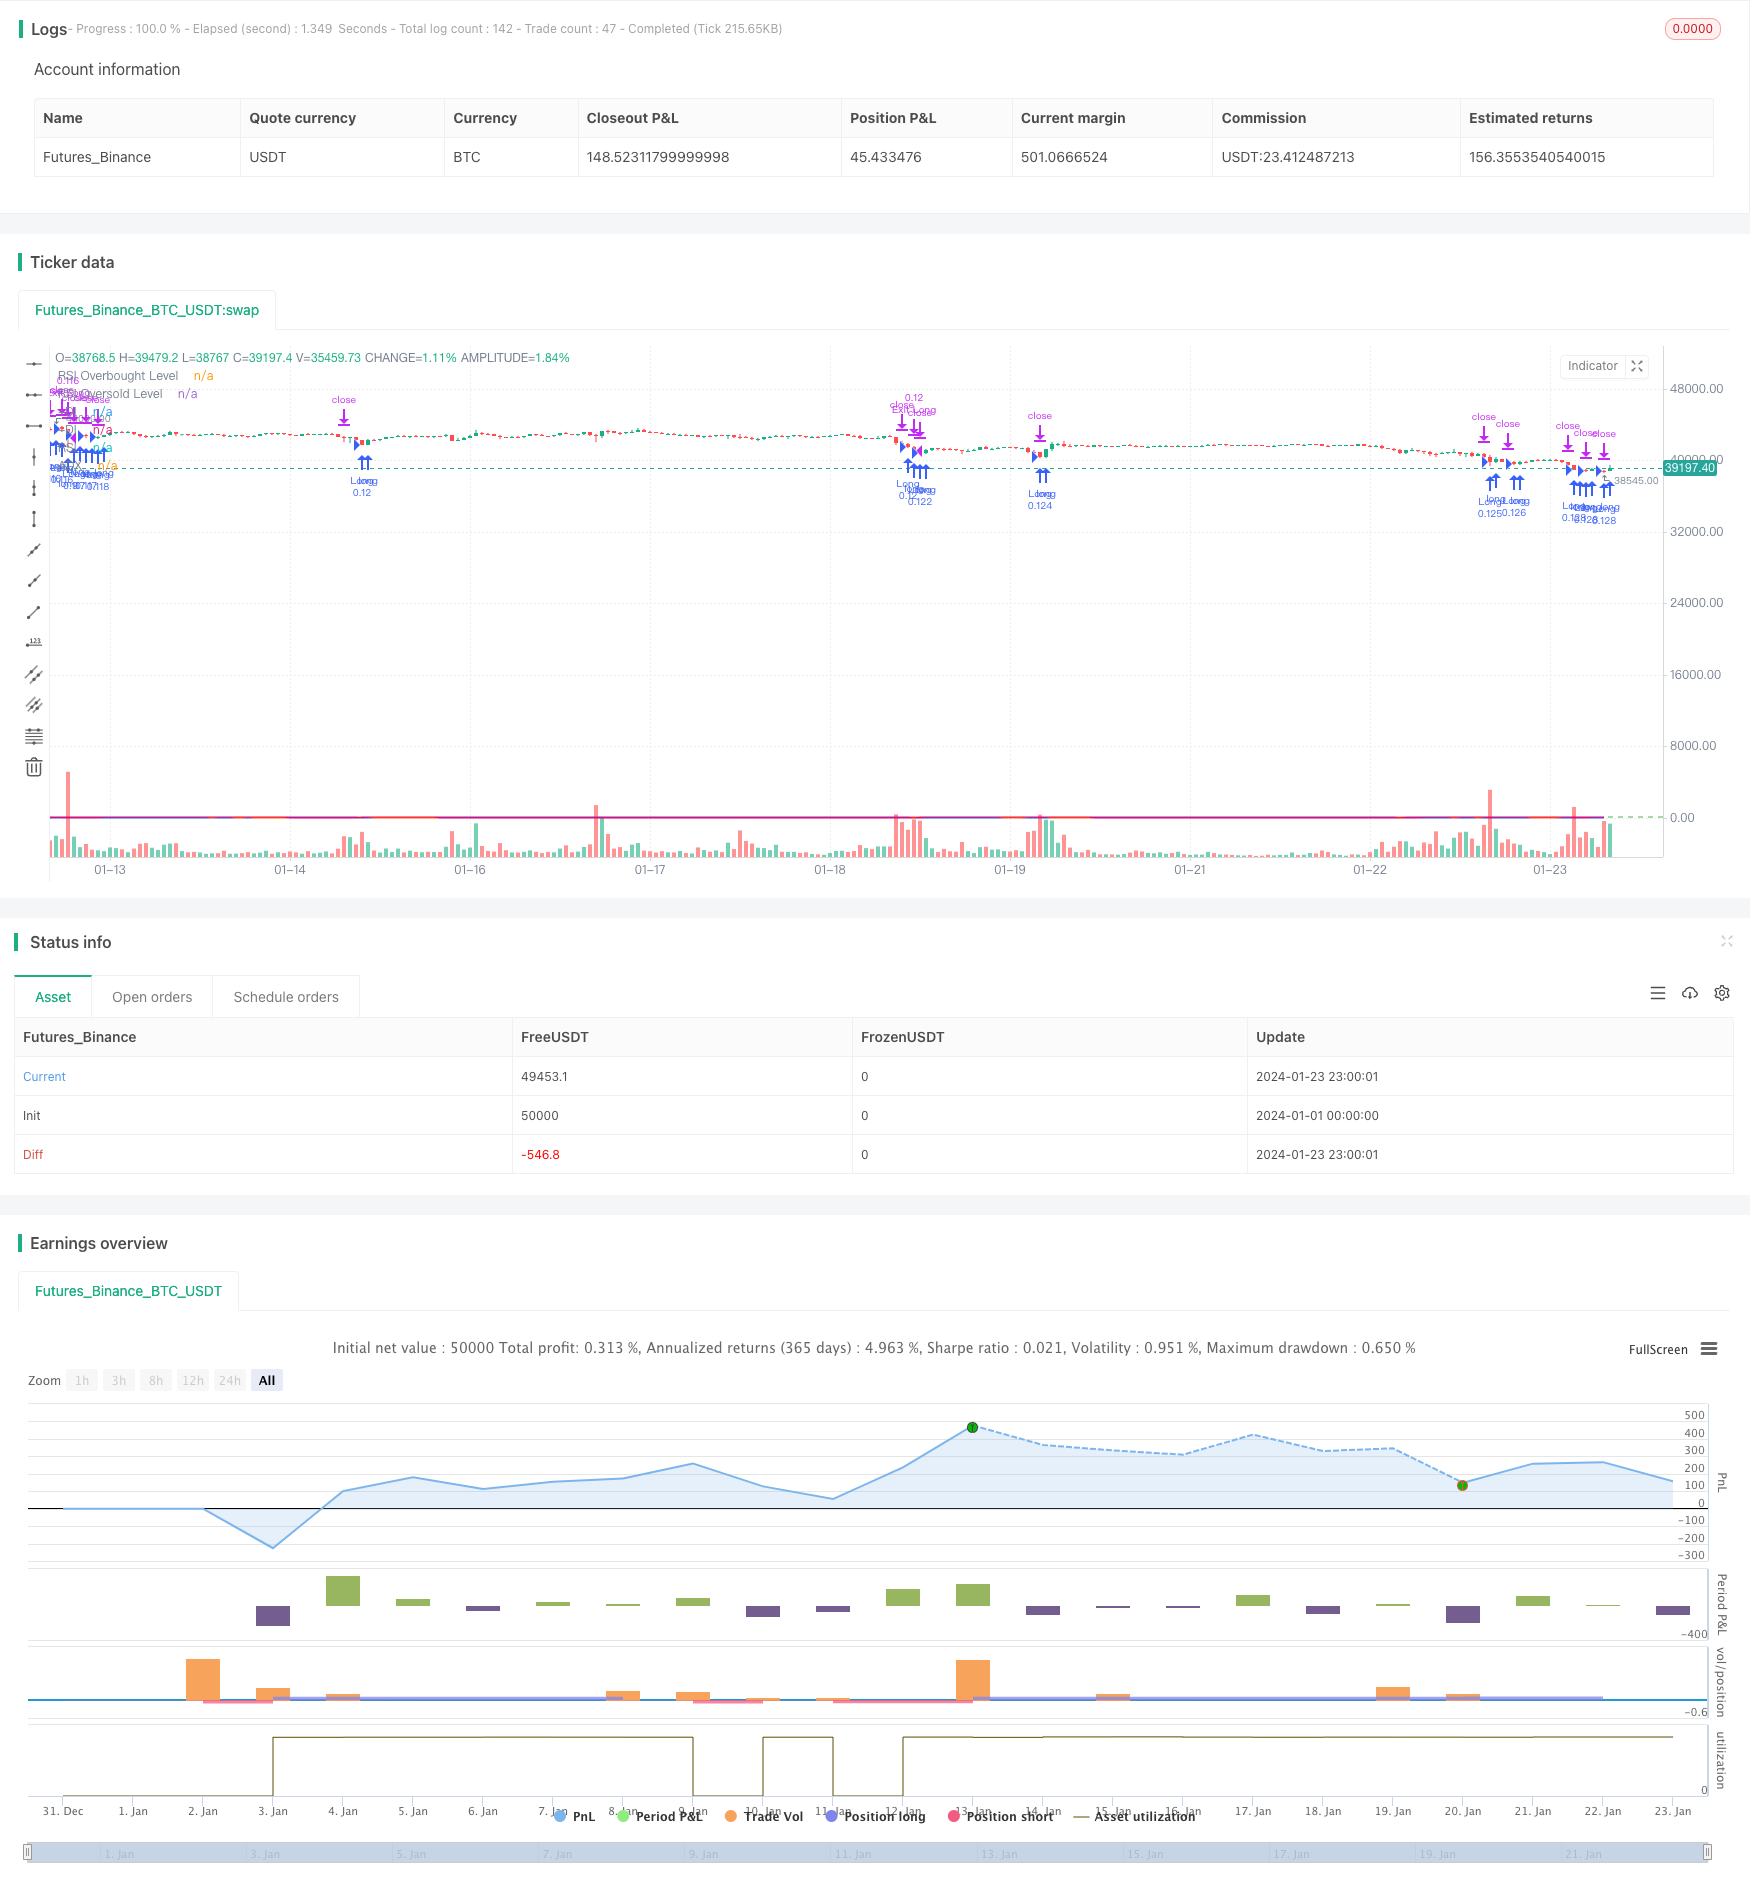
/*backtest
start: 2024-01-01 00:00:00
end: 2024-01-24 00:00:00
period: 1h
basePeriod: 15m
exchanges: [{"eid":"Futures_Binance","currency":"BTC_USDT"}]
*/

// This Pine Script™ code is subject to the terms of the Mozilla Public License 2.0 at https://mozilla.org/MPL/2.0/
// © YingYangJPN

//@version=5
strategy("DMI and RSI Strategy", overlay=true, initial_capital=10000, default_qty_type=strategy.percent_of_equity, default_qty_value=10)

// DMI indikatörünü tanımlayalım
lensig = input.int(14, title="ADX Smoothing", minval=1, maxval=50)
len = input.int(14, minval=1, title="DI Length")
up = ta.change(high)
down = -ta.change(low)
plusDM = na(up) ? na : (up > down and up > 0 ? up : 0)
minusDM = na(down) ? na : (down > up and down > 0 ? down : 0)
trur = ta.rma(ta.tr, len)
plus = fixnan(100 * ta.rma(plusDM, len) / trur)
minus = fixnan(100 * ta.rma(minusDM, len) / trur)
sum = plus + minus
adx = 100 * ta.rma(math.abs(plus - minus) / (sum == 0 ? 1 : sum), lensig)
trailing_stop_loss_factor = input.float(0.50, "Trailing Stop Loss Factor", step = 0.01)

// RSI indikatörünü tanımlayalım
rsiLength = input.int(14, minval=1, title="RSI Length")
rsiSource = input(close, title="RSI Source")
rsiOverbought = input.int(70, title="RSI Overbought Level")
rsiOversold = input.int(30, title="RSI Oversold Level")
rsiValue = ta.rsi(rsiSource, rsiLength)

// Uzun pozisyon açma koşullarını tanımlayalım
longCondition1 = rsiValue < rsiOversold // RSI oversold seviyesinin altındaysa
longCondition2 = adx > 20 // ADX 20'den büyükse
longCondition3 = minus > plus

// Kısa pozisyon açma koşullarını tanımlayalım
shortCondition1 = rsiValue > rsiOverbought // RSI overbought seviyesinin üstündeyse
shortCondition2 = adx > 20 // ADX 20'den büyükse
shortCondition3 = plus > minus

// Uzun pozisyon açalım
if longCondition1 and longCondition2 and longCondition3
    strategy.entry("Long", strategy.long)


// Kısa pozisyon açalım
if shortCondition1 and shortCondition2 and shortCondition3
    strategy.entry("Short", strategy.short)

// Trailing Stop Loss
longTrailingStopLoss = strategy.position_avg_price * (1 - trailing_stop_loss_factor / 100)
shortTrailingStopLoss = strategy.position_avg_price * (1 + trailing_stop_loss_factor / 100)
if strategy.position_size > 0
    strategy.exit("Exit Long", "Long", stop  = longTrailingStopLoss)
if strategy.position_size < 0
    strategy.exit("Exit Short", "Short", stop = shortTrailingStopLoss)

// DMI ve RSI indikatörlerini grafiğe çizelim
plot(adx, color=#F50057, title="ADX")
plot(plus, color=#2962FF, title="+DI")
plot(minus, color=#FF6D00, title="-DI")
plot(rsiValue, color=#9C27B0, title="RSI")
hline(rsiOverbought, title="RSI Overbought Level", color=#E91E63, linestyle=hline.style_dashed)
hline(rsiOversold, title="RSI Oversold Level", color=#4CAF50, linestyle=hline.style_dashed)