ট্রিপল SMA এর উপর ভিত্তি করে একটি স্বয়ংক্রিয় ট্র্যাকিং কৌশল
ওভারভিউ
ট্রিপল এসএমএ কৌশলটি একটি কৌশল যা তিনটি ভিন্ন পিরিয়ডের সরল চলমান গড়ের উপর ভিত্তি করে প্রবণতা বিচার এবং এন্ট্রি তৈরি করে। এটি স্বয়ংক্রিয়ভাবে প্রবণতা অনুসরণ করতে পারে এবং প্রবণতার মধ্যে রিবাউন্ড ব্যবহার করে পজিশন তৈরি করতে পারে।
কৌশল নীতি
এই কৌশলটি তিনটি ভিন্ন পিরিয়ডের এসএমএ ব্যবহার করে, যার মধ্যে রয়েছে 200 পিরিয়ড, 400 পিরিয়ড এবং 600 পিরিয়ডের এসএমএ। তিনটি এসএমএর উপরে দামগুলিকে ঊর্ধ্বমুখী ট্রেন্ড হিসাবে বিবেচনা করা হয় এবং বিপরীতভাবে, এটি উড়ন্ত ট্রেন্ড।
প্রবেশের সূচক হিসাবে, কৌশলটি ক্লোজ প্রাইস এবং স্টচক্লোজ ওসিলার ব্যবহার করে। স্টচক্লোজ সূচকটি ওভারসোল্ড বা ওভারসোল্ড হওয়ার সিদ্ধান্ত নেওয়ার জন্য ব্যবহৃত হয়, যখন স্টচক্লোজ 95 এর উপরে এবং 5 এর নীচে খালি হয় তখন স্টচক্লোজের উপর বেশি এবং খালি হয়।
স্টপ স্ট্যান্ডার্ড হল যখন দাম সবচেয়ে ধীরতম এসএমএ স্পর্শ করে তখন স্টপ করা হয়।
কৌশলটি সর্বোচ্চ ১০ বার বাড়ানো যায়। এবং তিনটি ভিন্ন অনুপাতের স্টপ সেট করা হয়, যথাক্রমে ১%, ২% এবং ৬%।
সামর্থ্য বিশ্লেষণ
ট্রিপল এসএমএ কৌশলটির সবচেয়ে বড় সুবিধা হ’ল তিনটি ভিন্ন পিরিয়ডের এসএমএ ব্যবহার করে ট্রেন্ডের দিকনির্দেশ এবং শক্তি আরও ভালভাবে নির্ধারণ করা যায়। একক এসএমএর তুলনায় মিথ্যা সংকেতগুলি ফিল্টার করার ক্ষমতা বেশি।
এছাড়াও, স্টোক ক্লোজ সূচকের সাথে যুক্ত হয়ে ওভারক্লোজ বা ওভারসোল্ডের বিচার করা, ট্রেন্ডের বিপরীত দিকের কাছাকাছি প্রবেশ করা এড়ানো যায়, যার ফলে ভুল এন্ট্রি হ্রাস করা যায়।
স্টপ স্ট্যান্ডার্ডটি সহজ এবং সরাসরি, সবচেয়ে ধীর-চক্রের এসএমএকে স্টপ লাইন হিসাবে ব্যবহার করে, যাতে অকালের স্টপ এড়ানো যায়।
এছাড়াও, এই কৌশলটি ট্রেন্ডের উপর নির্ভর করে লাভজনক হতে পারে।
ঝুঁকি বিশ্লেষণ
এই কৌশলটির প্রধান ঝুঁকিটি হল যে তিনটি এসএমএ সমস্ত মিথ্যা সংকেতকে পুরোপুরি ফিল্টার করতে পারে না, এবং যদি দামের ব্রেকডাউনটি আবারও পুনরুদ্ধার করতে না পারে তবে ক্ষতি হতে পারে। এই পরিস্থিতিটি সাধারণত গুরুত্বপূর্ণ সমর্থন প্রতিরোধের কাছাকাছি ঘটে থাকে।
এছাড়াও, স্টোক ক্লোজ সূচক নিজেই ভুল সংকেত তৈরি করে, যার ফলে অনুপযুক্ত এন্ট্রি তৈরি হয়। এটি সাধারণত দামের ঝড়ের সময় ঘটে।
এই ঝুঁকিগুলি হ্রাস করার জন্য, এসএমএর চক্রটি যথাযথভাবে সামঞ্জস্য করা যেতে পারে; বা প্রবেশের সংকেতের গুণমান নিশ্চিত করার জন্য অন্যান্য সূচক যেমন কেডিজে, এমএসিডি ইত্যাদির মতো সংমিশ্রণ বিচার করার জন্য যুক্ত করা যেতে পারে।
অপ্টিমাইজেশান দিক
এই কৌশলটি নিম্নলিখিত দিকগুলি থেকে উন্নত করা যেতে পারেঃ
এসএমএ-র চক্রের সংখ্যা বাড়ান বা সামঞ্জস্য করুন এবং নির্দিষ্ট জাতের জন্য আরও উপযুক্ত চক্রের প্যারামিটারগুলি সন্ধান করুন
এন্ট্রিগুলির গুণমান উন্নত করতে অন্যান্য সূচক যেমন কেডিজে, এমএসিডি ইত্যাদি যোগ করা
স্টপ-অফ-লস মানদণ্ডকে অপ্টিমাইজ করা হয়েছে যাতে এটি বাজারের অস্থিরতার সাথে আরও উপযুক্ত হয়
আপনি কতবার এবং কতটুকু বাড়াতে পারেন তা অনুকূলিত করুন এবং আপনার জন্য সবচেয়ে উপযুক্ত বাড়ানোর কৌশলটি খুঁজে বের করুন
বিভিন্ন জাতের প্যারামিটার পরীক্ষা করে, যাতে নীতির প্যারামিটারগুলি আরও জাতের সাথে সামঞ্জস্যপূর্ণ হয়
সারসংক্ষেপ
ট্রিপল এসএমএ কৌশলটি সামগ্রিকভাবে একটি খুব ব্যবহারিক প্রবণতা ট্র্যাকিং কৌশল। এটি তিনটি পৃথক পিরিয়ডের এসএমএ এবং স্টচক্লোজ সূচকগুলির সমন্বয় প্রয়োগের মাধ্যমে একটি ভাল প্রবণতা বিচার প্রভাব অর্জন করে এবং কার্যকরভাবে ভুল সংকেত এড়াতে পারে। একই সাথে যথাযথ পজিশনিংয়ের অনুমতি দেয়, যাতে প্রবণতা সর্বদা লাভের সাথে জড়িত থাকে। প্যারামিটার সামঞ্জস্য এবং অপ্টিমাইজেশনের মাধ্যমে, কৌশলটি একটি শক্তিশালী প্রবণতা ট্র্যাকিং মেশিন হতে পারে।
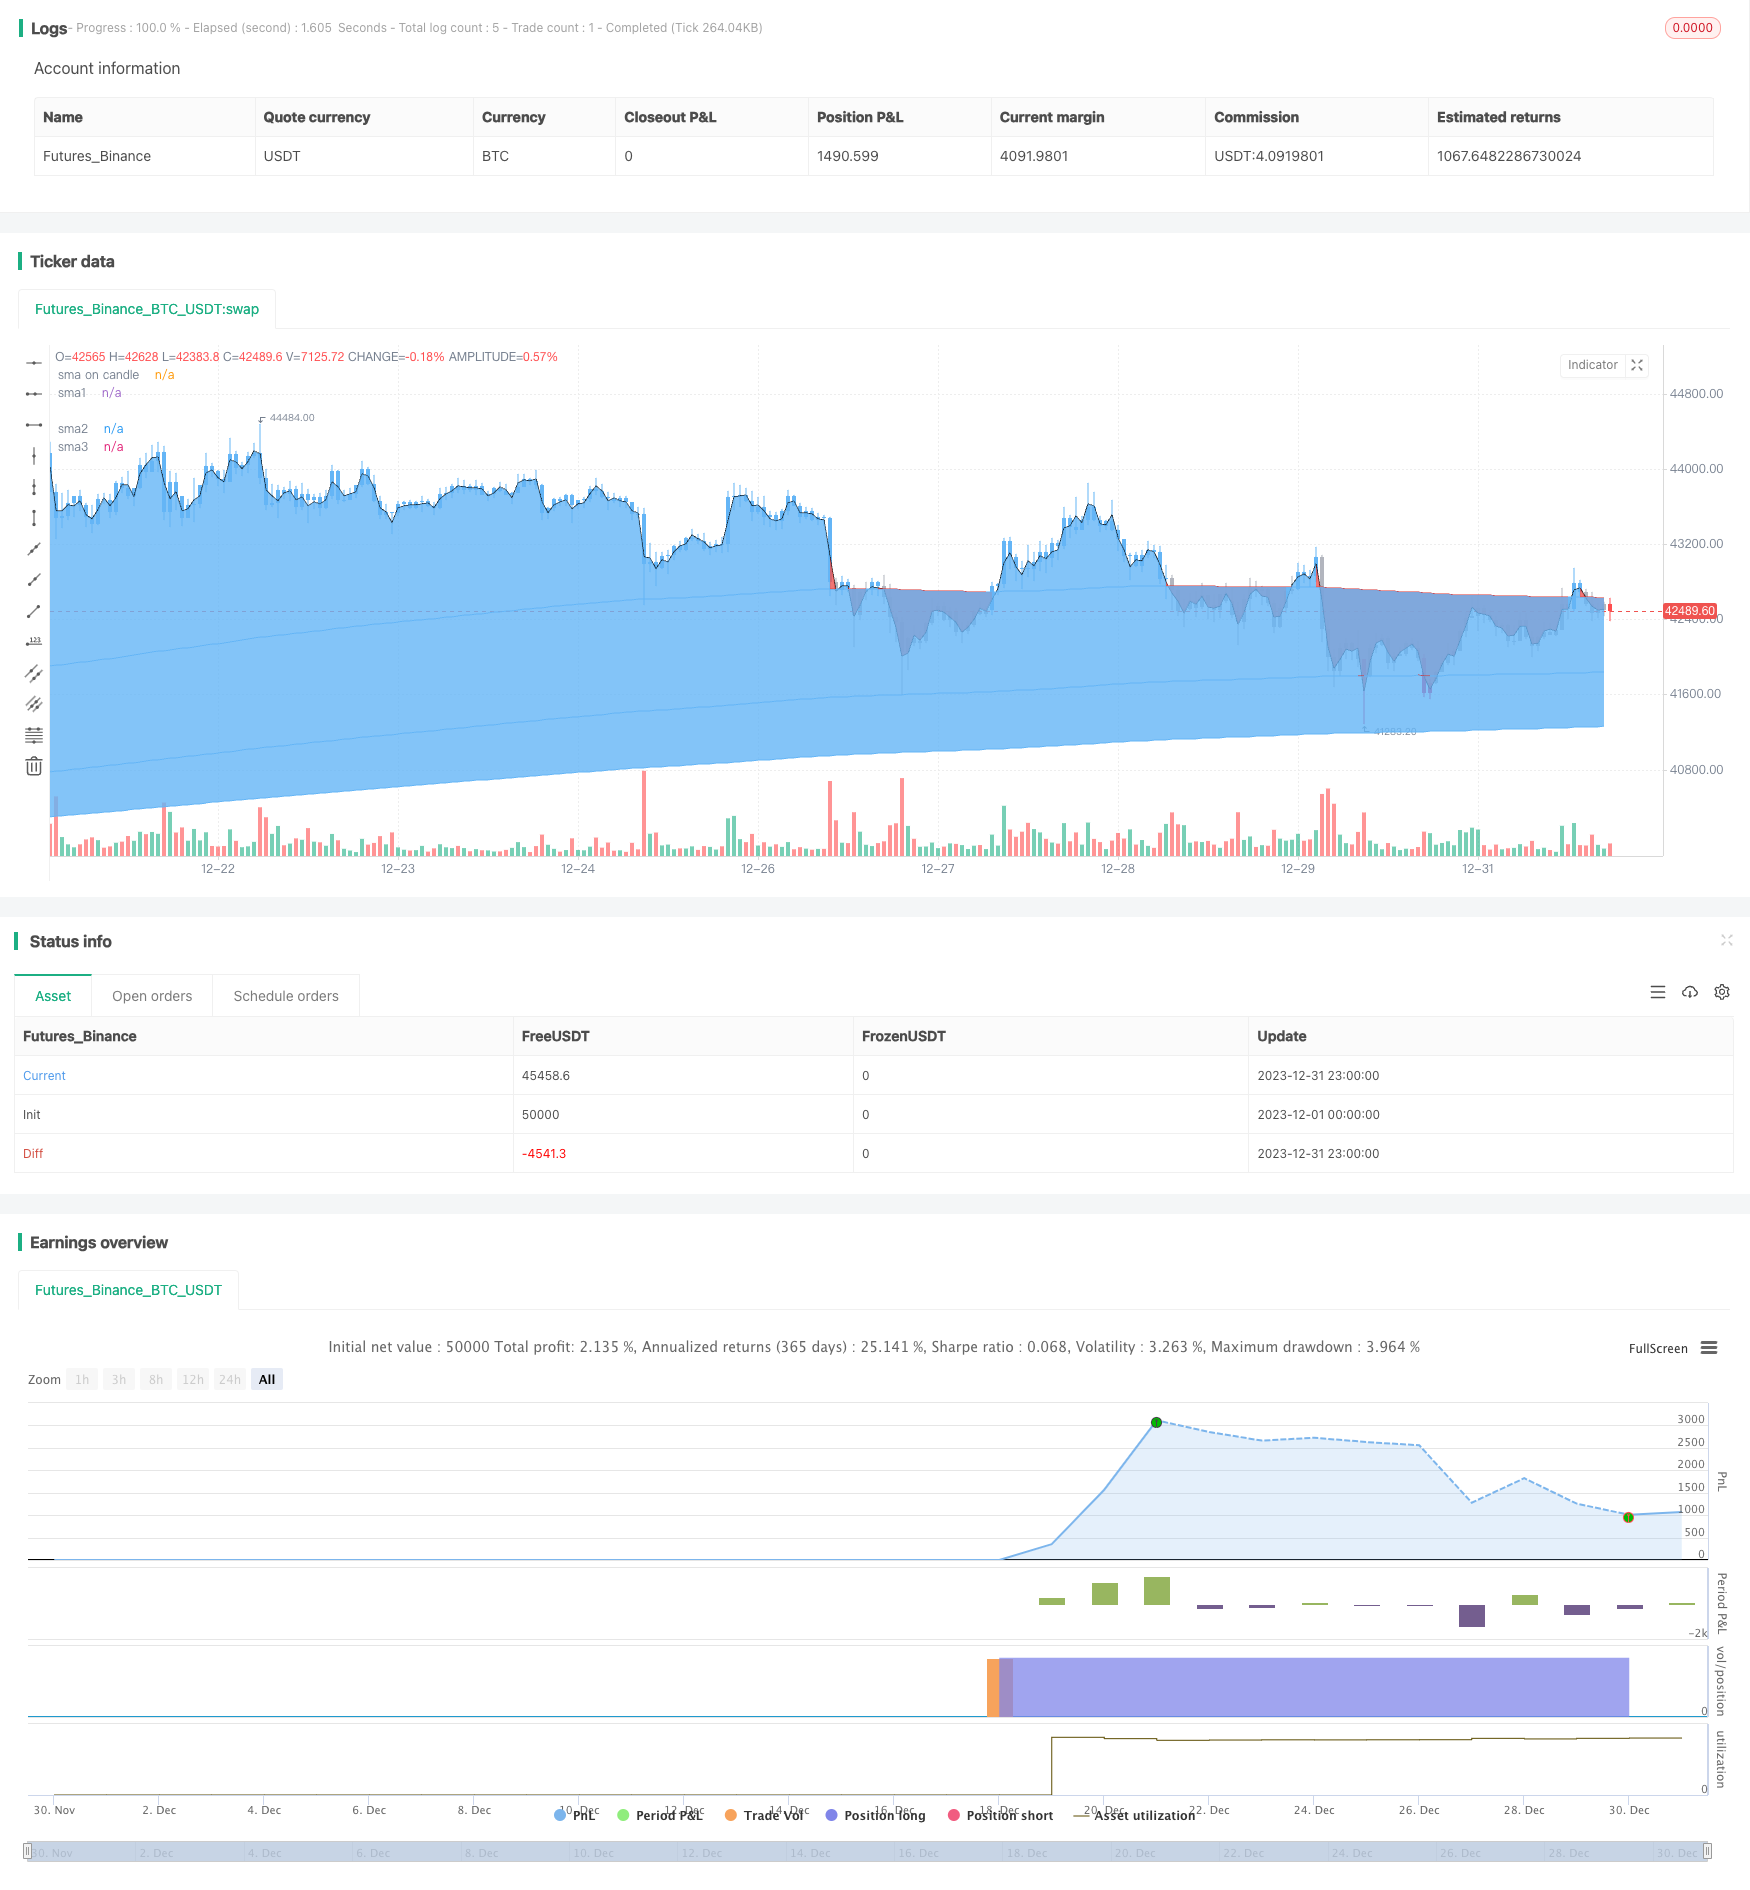
/*backtest
start: 2023-12-01 00:00:00
end: 2023-12-31 23:59:59
period: 1h
basePeriod: 15m
exchanges: [{"eid":"Futures_Binance","currency":"BTC_USDT"}]
*/

//@version=4
strategy(title="Tripla Sma with entries based on sma price closes ", shorttitle="TRIPLE SMA STRATEGY", overlay=true) ////resolution=""
len = input(200, minval=1, title="sma 1 length")
len1 = input(400, minval=1, title="sma 2 length")
len2 = input(600, minval=1, title="sma 3 length")
src = input(close, title="Source")
////////////////////////////////////////////
smma = 0.0
smma := na(smma[1]) ? sma(src, len) : (smma[1] * (len - 1) + src) / len

up = smma > smma [1]
down =smma < smma[1]
mycolor = up ? #64b5f6 : down ? #d32f2f : na
fastma = sma(hl2, 1)

fastplot = plot(fastma, color=#000000, transp=100, title='sma on candle')
slowplot = plot(smma, color=mycolor, transp=55, title='sma1')

////////////////////////////////////////////
smma1 = 0.0
smma1 := na(smma1[1]) ? sma(src, len1) : (smma1[1] * (len1 - 1) + src) / len1

up2 = smma1 > smma1 [1]
down2 =smma1 < smma1[1]

mycolor2 = up2 ? #64b5f6 : down2 ? #d32f2f : na
slowplot2 = plot(smma1, color=mycolor2, transp=45, title='sma2')

////////////////////////////////////////////
smma2 = 0.0
smma2 := na(smma2[1]) ? sma(src, len2) : (smma2[1] * (len2 - 1) + src) / len2

up3 = smma2 > smma2 [1]
down3 =smma2 < smma2[1]

mycolor3 = up3 ? #64b5f6 : down3 ? #d32f2f : na
slowplot3 = plot(smma2, color=mycolor3, transp=35, title='sma3')

////////////////////////////////////////////////////////////////////////////////////////
//Fill gaps
fillData = smma > fastma
fillData2 = smma < fastma

fillDtat = smma1 > smma
fillDtat2 = smma1 < smma

fillDat = smma2 > smma1
fillDat2 = smma2 < smma1


fillCol1 = fillData ? #ef5350 : fillData2 ? #64b5f6 : na
fillCol2 = fillDtat ? #ef5350 : fillDtat2 ? #64b5f6 : na
fillCol3 = fillDat ? #ef5350 : fillDat2 ? #64b5f6 : na


fill(slowplot, fastplot, color=fillCol1, transp=90, title="sma1 fill")
fill(slowplot, slowplot2, color=fillCol2, transp=80, title="sma2 fill")
fill(slowplot2, slowplot3, color=fillCol3, transp=60, title="sma3 fill")

uc = (close > smma) and (close > smma1)
dc = (close < smma) and (close < smma1)

barColor = uc ? #64b5f6 : dc ? #e91e63 : #b2b5be
barcolor(color=barColor)
////////////////////////////////////////////////////////////////////////////////////////////////////////////////////////////////////////////////////////////////////////////////
//StochClose from @trendinvestpro
periods = input(50, minval=1, title="length for the oscillator")
smooth = input(5, minval=1, title="oscillator smoothing")
hhc=highest(close,periods)
llc=lowest(close,periods)
StochClose = sma((close-llc)/(hhc-llc)*100, smooth)

shortline = input(95, minval=0, title="signal when oscillator crosses above")
longline = input(5, minval=0, title="signal when oscillator crosses below")

////////////////////////////////////////////////////////////////////////////////////////////////////////////////////////////////////////////////////////////////////////////////
longs = close > smma2
shorts = close < smma2


long = longs == true and crossunder(StochClose, longline)
short = shorts == true and crossover(StochClose, shortline)

stoplong = close < smma and close < smma1 and close < smma2
stopshort = close > smma and close > smma1 and close > smma2

p1 = strategy.position_avg_price / 100 / syminfo.mintick

maxx = input(2500, title="max orders filled on a day", minval=0)
takeprofit1 = input(1, title="take profit level 1", minval=0)
takeprofit2 = input(2, title="take profit level 2", minval=0)
takeprofit3 = input(6, title="take profit level 3", minval=0)

takeprofitqt1 = input(30, title="take profit quantity first", minval=0)
takeprofitqt2 = input(30, title="take profit quantity second", minval=0)
takeprofitqt3 = input(30, title="take profit quantity third", minval=0)
//////////////////////////////////////////////////////////////////////////////////////////////////////////////////////////////////////////////////////////////////////////////////
/////////////////////////////////////////////////////////////////////////////////////////Strategy entries/////////////////////////////////////////////////////////////////////////////////////////
// strategy.risk.max_intraday_filled_orders(maxx)
strategy.entry("long", strategy.long, when=long)
strategy.exit("tpl1", "long", qty_percent = takeprofitqt1, profit = takeprofit1 * p1)
strategy.exit("tpl2", "long", qty_percent = takeprofitqt2, profit = takeprofit2 * p1)
strategy.exit("tpl3", "long", qty_percent = takeprofitqt3, profit = takeprofit3 * p1)
strategy.close("long", when=stoplong == true)


strategy.entry("short", strategy.short, when=short)
strategy.exit("tpl1", "short", qty_percent = takeprofitqt1, profit = takeprofit1 * p1)
strategy.exit("tpl2", "short", qty_percent = takeprofitqt2, profit = takeprofit2 * p1)
strategy.exit("tpl3", "short", qty_percent = takeprofitqt3, profit = takeprofit3 * p1)
strategy.close("short", when=stopshort == true)