একাধিক প্রযুক্তিগত সূচক ব্যবহার করে একটি পরিমাণগত ট্রেডিং কৌশল
ওভারভিউ
এই কৌশলটি একটি কৌশল যা একাধিক প্রযুক্তিগত সূচক ব্যবহার করে পরিমাণগত ব্যবসায়ের জন্য। প্রধানত ইএমএ গড় লাইন ক্রস, সুপারট্রেন্ড সূচক, আরএসআই সূচক, এমএসিডি সূচক ইত্যাদির মতো একাধিক সূচক ব্যবহার করে ট্রেডিং সংকেত তৈরি করে।
কৌশল নীতি
এই কৌশলটির মূল লেনদেনের যুক্তি নিম্নলিখিত বিষয়গুলির উপর ভিত্তি করে তৈরি করা হয়েছেঃ
ইএমএ সমান্তরালঃ দ্রুত লাইন ইএমএ 1 এবং ধীর লাইন ইএমএ 2 গণনা করুন, যখন দ্রুত লাইনটি ধীর লাইনটি অতিক্রম করে তখন একটি কেনার সংকেত উত্পন্ন হয় এবং যখন দ্রুত লাইনটি ধীর লাইনটি অতিক্রম করে তখন একটি বিক্রয় সংকেত উত্পন্ন হয়।
ভিডাব্লুএমএ গড় লাইনঃ ভিডাব্লুএমএ গড় লাইন গণনা করা হয়, যখন বন্ধের দামের উপরে গড় লাইনটি ক্রস করা হয় তখন এটি কেনার সংকেত হিসাবে বিবেচিত হয় এবং নীচে গড় লাইনটি ক্রস করা হলে এটি বিক্রয় সংকেত হিসাবে বিবেচিত হয়।
সুপারট্রেন্ড সূচকঃ এটিআর এবং মাল্টিপ্লায়ার প্যারামিটারগুলির উপর ভিত্তি করে সুপারট্রেন্ডের উত্থান-পতন গণনা করে এবং প্রবণতার দিকনির্দেশ নির্ধারণ করে। একটি উত্থান প্রবণতা একটি ক্রয় সংকেত উত্পন্ন করে এবং একটি পতন প্রবণতা একটি বিক্রয় সংকেত উত্পন্ন করে।
আরএসআই সূচক: আরএসআই সূচক গণনা করা হয়, আরএসআই যখন ওভার-বই লাইনের উপরে থাকে তখন এটি একটি বিক্রয় সংকেত হিসাবে বিবেচিত হয়, আর আরএসআই যখন ওভার-বিক্রয় অঞ্চলের নীচে থাকে তখন এটি একটি ক্রয় সংকেত হিসাবে বিবেচিত হয়।
MACD সূচক: MACD এর দ্রুত লাইন, ধীর লাইন এবং সংকেত লাইন গণনা করুন, যখন দ্রুত লাইনটি সংকেত লাইনটি অতিক্রম করে তখন ক্রয় সংকেত উত্পন্ন হয়, যখন দ্রুত লাইনটি সংকেত লাইনটি অতিক্রম করে তখন বিক্রয় সংকেত উত্পন্ন হয়।
উপরে উল্লিখিত একাধিক সূচকের ট্রেডিং সিগন্যাল পাওয়ার পরে, কৌশলটি AND লজিক ব্যবহার করে বিচার করা হয়, অর্থাৎ একাধিক সূচক একই সাথে সংকেত প্রেরণ করলে কেবলমাত্র চূড়ান্ত ক্রয় এবং বিক্রয় সংকেত উত্পন্ন হয়।
কৌশলগত সুবিধা
এই কৌশলটি মার্কেটের বিভিন্ন সূচককে একত্রিত করে, যা কার্যকরভাবে মিথ্যা সংকেত হ্রাস করতে পারে। এর প্রধান সুবিধাগুলি হলঃ
একাধিক সূচক ব্যবহার করে সমন্বিত ফিল্টারিং, যা একটি একক সূচক দ্বারা সৃষ্ট ভুল সংকেত কমাতে পারে।
প্রবণতা সূচক এবং ঝড়ের সূচকের সংমিশ্রণ প্রবণতা পরিস্থিতিতে অতিরিক্ত মুনাফা অর্জন করতে পারে।
একটি ভাল স্টপ লস লজিক ব্যবহার করে, একটি একক লেনদেনের সর্বোচ্চ ক্ষতি কার্যকরভাবে নিয়ন্ত্রণ করা যায়।
দ্বিগুণ বাজি যুক্তিটি হ্রাসের পরে পজিশন বাড়িয়ে এই সুযোগটি পুনরুদ্ধার করতে দেয়।
কৌশলগত ঝুঁকি
এই কৌশলটি নিম্নলিখিত ঝুঁকির সাথে জড়িতঃ
একাধিক সূচক পোর্টফোলিও খুব সংরক্ষণশীল হতে পারে এবং কিছু ব্যবসায়ের সুযোগ মিস করতে পারে। সূচক পোর্টফোলিও যথাযথভাবে সরল করা যেতে পারে।
দ্বিগুণ বাজি বাড়ানোর লজিকের ফলে ক্ষতির পরিমাণ বাড়তে পারে। যুক্তিসঙ্গতভাবে বাড়ানোর সংখ্যা সীমিত করা উচিত।
ক্ষতির অবস্থানটি ভুলভাবে সেট করা হয়েছে যা অপ্রয়োজনীয় ক্ষতির কারণ হতে পারে। কাস্টমাইজযোগ্য ক্ষতির অবস্থানটি কাস্টমাইজ করা উচিত।
সূচক প্যারামিটার সেটিং ভুল হতে পারে কারণ এটি অনেকগুলি ভুল সংকেত তৈরি করতে পারে। সর্বোত্তম প্যারামিটার সমন্বয় পেতে প্যারামিটারগুলি অনুকূলিত করা উচিত।
কৌশল অপ্টিমাইজেশনের দিকনির্দেশনা
এই কৌশলটি নিম্নলিখিত দিকগুলি থেকে আরও উন্নত করা যেতে পারেঃ
বিভিন্ন প্যারামিটার সমন্বয় সূচকগুলির কার্যকারিতা মূল্যায়ন করুন, সূচকের ওজন নির্বাচন করুন।
বিভিন্ন সূচক পরামিতি সেটিং পরীক্ষা করুন।
স্বনির্ধারিত স্টপ লজিক যোগ করা হয়েছে।
ডায়নামিক পজিশন ম্যানেজমেন্ট সিস্টেমে যোগদান করুন।
মেশিন লার্নিং পদ্ধতি ব্যবহার করে প্যারামিটার এবং মডেল অপ্টিমাইজ করুন।
সারসংক্ষেপ
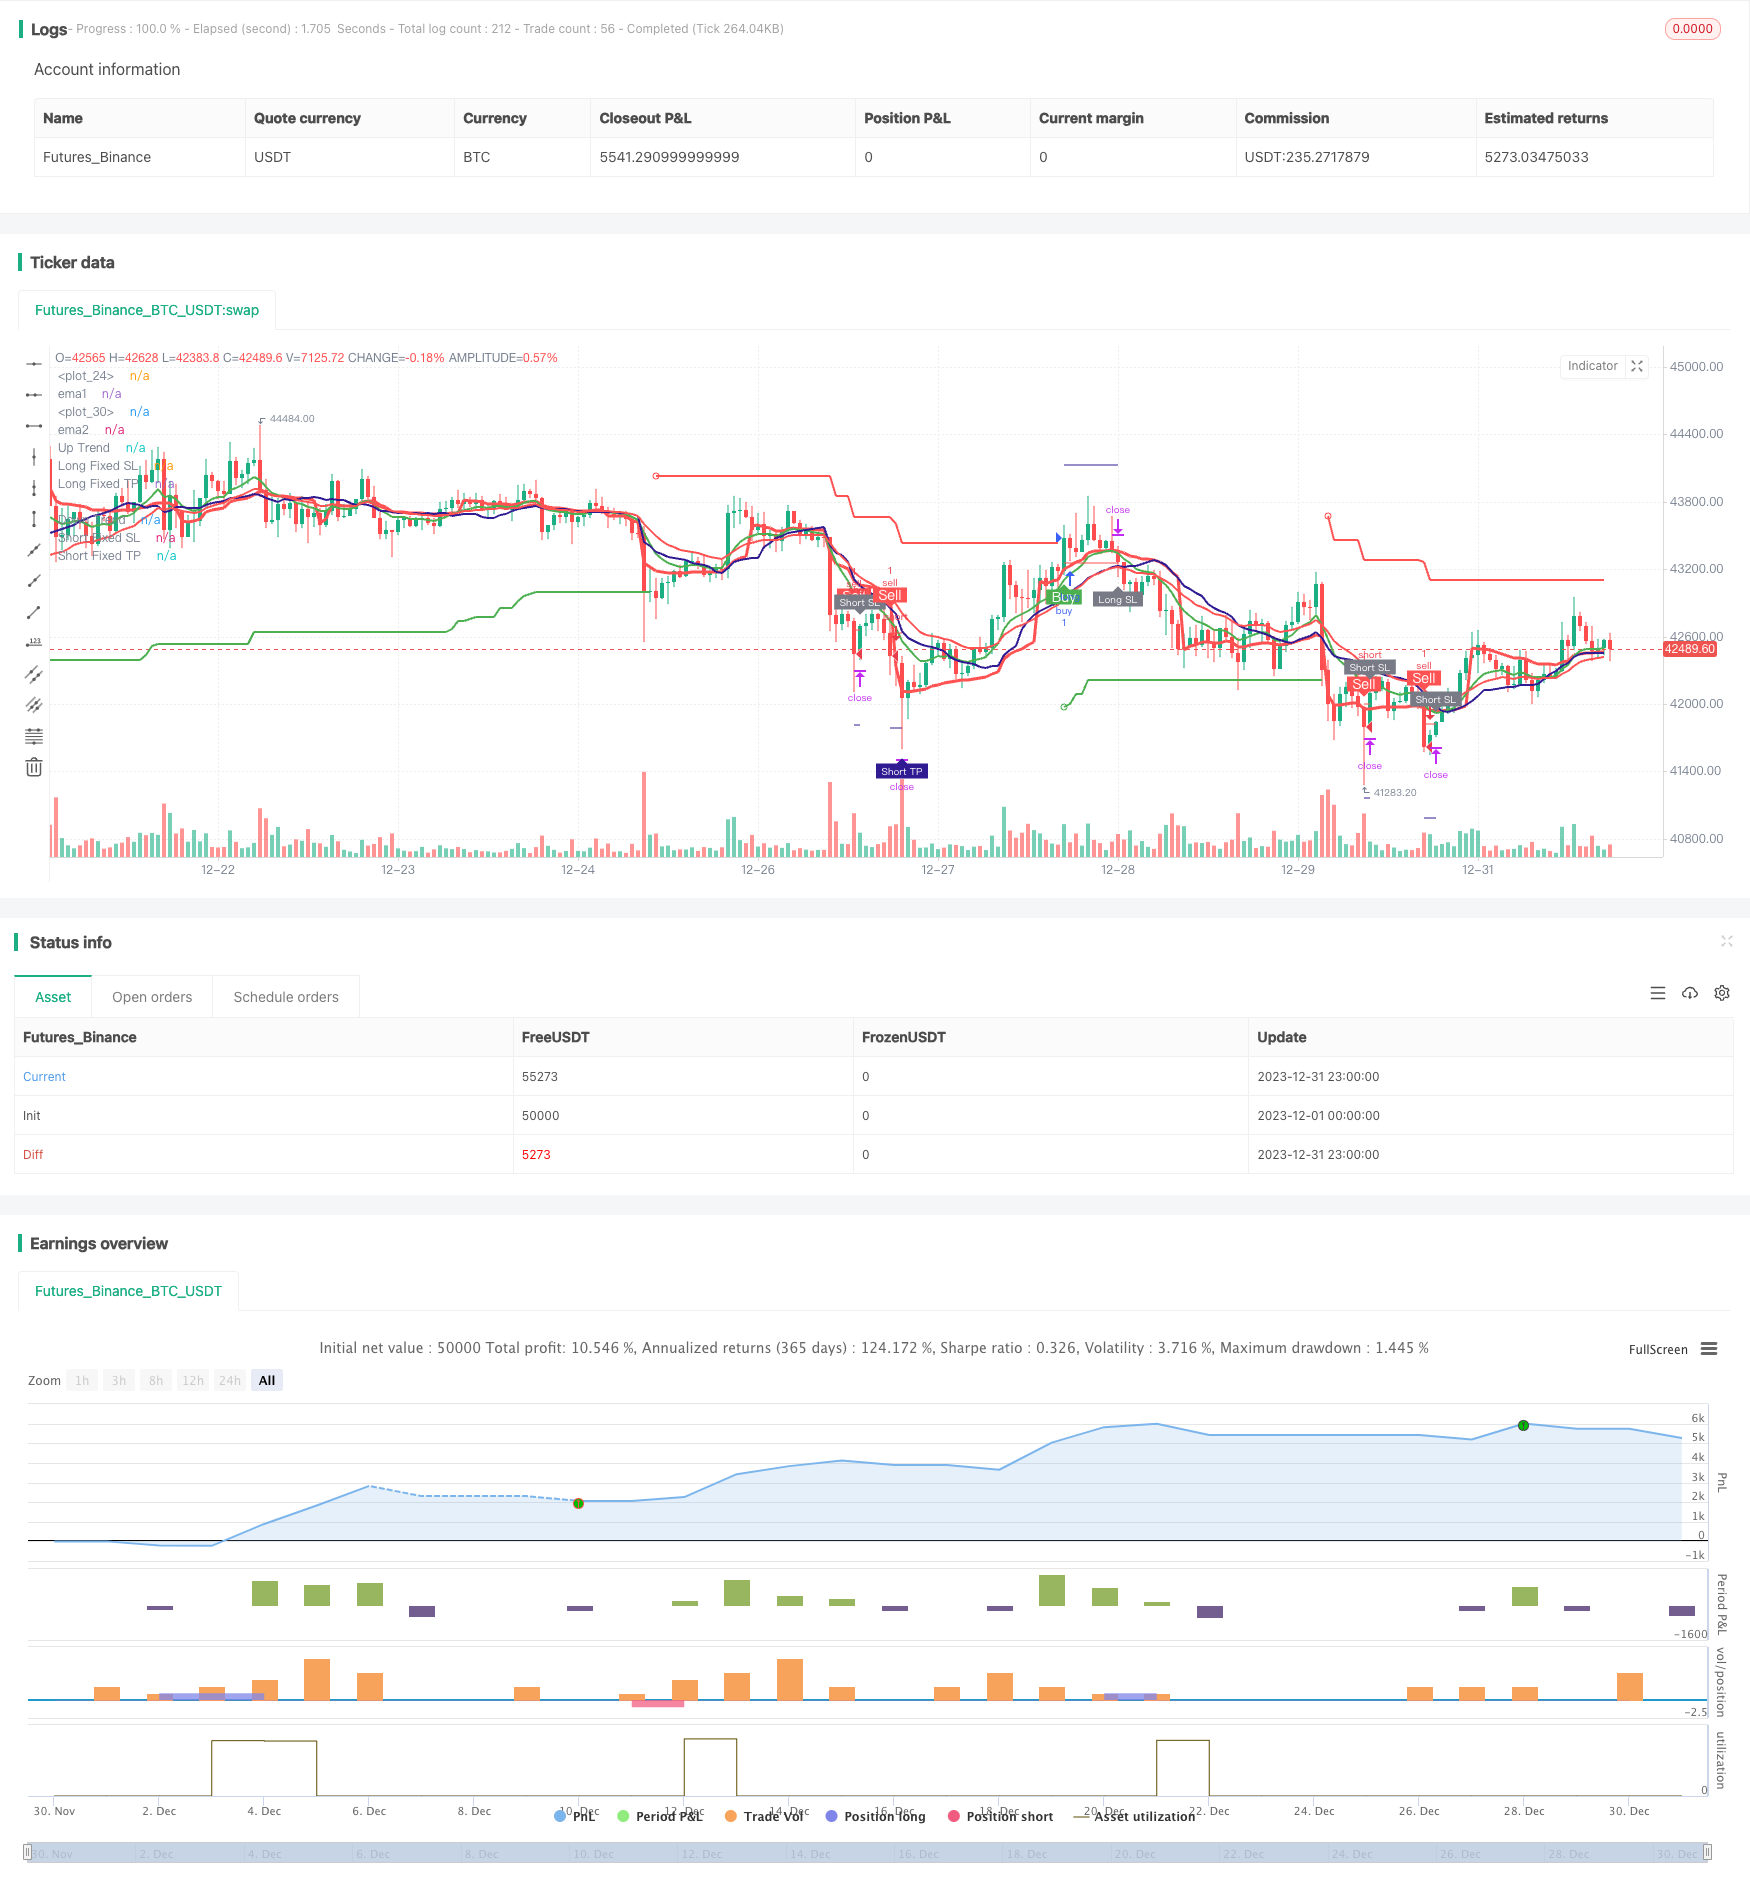
Overall এই কৌশলটি একটি খুব কার্যকর পরিমাণগত ট্রেডিং কৌশল। এটি বেশ কয়েকটি ক্লাসিক প্রযুক্তিগত সূচকগুলির সুবিধাগুলিকে একত্রিত করে, যা কার্যকরভাবে বাজার বিচার করতে পারে। প্যারামিটার অপ্টিমাইজেশন এবং মডেল পুনরাবৃত্তির মাধ্যমে এই কৌশলটি আরও ভাল ট্রেডিং কার্যকারিতা অর্জন করতে পারে।
/*backtest
start: 2023-12-01 00:00:00
end: 2023-12-31 23:59:59
period: 1h
basePeriod: 15m
exchanges: [{"eid":"Futures_Binance","currency":"BTC_USDT"}]
*/


//@version=5
strategy(title='Pinku Buy', overlay=true)

fromMonth = input.int(defval=1, title='From Month', minval=1, maxval=12)
fromDay = input.int(defval=1, title='From Day', minval=1, maxval=31)
fromYear = input.int(defval=2021, title='From Year', minval=1970)
thruMonth = input.int(defval=1, title='Thru Month', minval=1, maxval=12)
thruDay = input.int(defval=1, title='Thru Day', minval=1, maxval=31)
thruYear = input.int(defval=2112, title='Thru Year', minval=1970)

showDate = input(defval=true, title='Show Date Range')

start = timestamp(fromYear, fromMonth, fromDay, 00, 00)
finish = timestamp(thruYear, thruMonth, thruDay, 23, 59)
window() => true
// ema crossover
length1 = input.int(10)
length2 = input.int(20)
ema1 = ta.ema(close , length1)
ema2 = ta.ema(close , length2)
//vwap
VWAP = ta.vwap(hlc3)
plot(VWAP, color=color.new(color.red, 0), linewidth=3)
buy_1 = close > VWAP
sell_1 = close < VWAP
//vwma
len = input.int(20, 'VWMA_len', minval=1)
ma = ta.vwma(close, len)
plot(ma, color=color.new(color.navy, 0), linewidth=2)
buy_2 = close > ma
sell_2 = close < ma
//super trend
//inputs
Periods = input(title='STR Period', defval=22)
Source = input(hl2, title='Source')
Multiplier = input.float(title='STR Multiplier', step=0.1, defval=5.0)


//Compute ATR Levels
atr = ta.atr(Periods)


//Creating Upper Channel

up = Source - Multiplier * atr
up1 = nz(up[1], up)
up := close[1] > up1 ? math.max(up, up1) : up

//Creating Down Channel
dn = Source + Multiplier * atr
dn1 = nz(dn[1], dn)
dn := close[1] < dn1 ? math.min(dn, dn1) : dn


//Compute the Trend Stream +1/-1
trend = 1
trend := nz(trend[1], trend)
trend := trend == -1 and close > dn1 ? 1 : trend == 1 and close < up1 ? -1 : trend

//Create Stoploss for Longs
upPlot = plot(trend == 1 ? up : na, title='Up Trend', style=plot.style_linebr, linewidth=2, color=color.new(color.green, 0))
//buy_a = close > upPlot
//Buy Signal
buy_3 = trend == 1 and trend[1] == -1

plotshape(buy_3 ? up : na, title='Go Long', location=location.absolute, style=shape.circle, size=size.tiny, color=color.new(color.green, 0))

dnPlot = plot(trend == 1 ? na : dn, title='Down Trend', style=plot.style_linebr, linewidth=2, color=color.new(color.red, 0))
//sell_a = close < dnPlot
//Sell Signal
sell_3 = trend == -1 and trend[1] == 1

plotshape(sell_3 ? dn : na, title='Go Short', location=location.absolute, style=shape.circle, size=size.tiny, color=color.new(color.red, 0))
// //paraboloic sar
// start = input(0.02)
// increment = input(0.02)
// maximum = input(0.2, 'Max Value')
// out = ta.sar(start, increment, maximum)


buy_4 = ema1 > ema2
//buy_4 = buy1 and not buy1[1]
//plotshape(buy_4 , color = color.green , text = "Buy" , location = location.belowbar , textcolor = color.white , style = shape.labelup , size = size.small)
sell_4 = close < ema2
//sell_4 = sell1 and not sell1[1]
//plotshape(sell_4, color = color.red , text = "Sell" , location = location.abovebar , textcolor = color.white , style = shape.labeldown , size = size.small)
plot(ema1, 'ema1', color=color.new(color.green, 0), linewidth=2)
plot(ema2, 'ema2', color=color.new(color.red, 0), linewidth=2)

// rsi
lenr = input(14, title='Rsi Period')
rs = ta.rsi(close, lenr)

over_sold = input(44)
over_bought = input(56)

buy_5 = rs > over_bought
sell_5 = rs < over_sold
// macd
slow_len_macd = input.int(12)
fast_len_macd = input.int(26)
signal_len_macd = input.int(9)

ema3 = ta.ema(close , slow_len_macd)
ema4 = ta.ema(close , fast_len_macd)
ema5 = ta.ema(close , signal_len_macd)

buy_6 = ema5 > ema4
sell_6 = ema5 < ema4

// adx
adxlen = input(14, title="ADX Smoothing")
dilen = input(14, title="DI Length")
dirmov(len) =>
	up = ta.change(high)
	down = -ta.change(low)
	plusDM = na(up) ? na : (up > down and up > 0 ? up : 0)
	minusDM = na(down) ? na : (down > up and down > 0 ? down : 0)
	truerange = ta.rma(ta.tr, len)
	plus = fixnan(100 * ta.rma(plusDM, len) / truerange)
	minus = fixnan(100 * ta.rma(minusDM, len) / truerange)
	[plus, minus]
adx(dilen, adxlen) =>
	[plus, minus] = dirmov(dilen)
	sum = plus + minus
	adx = 100 * ta.rma(math.abs(plus - minus) / (sum == 0 ? 1 : sum), adxlen)
sig = adx(dilen, adxlen)
//plot(sig, color=color.red, title="ADX")
adx_Greater_than = input.int(25)

signal = sig > adx_Greater_than
// volume ema
volume_ema = input.int(10)

vema = ta.ema(volume,volume_ema)

signal_2 = volume > vema


//define buy sell
g = buy_1 and buy_2 and buy_4 and trend == 1 and buy_5 and buy_6 and signal and signal_2 and window()
r = sell_1 and sell_2 and sell_4 and trend == -1 and sell_5 and sell_6 and signal and signal_2 and window()

rg = 0
rg := r ? 1 : g ? 2 : nz(rg[1])

buy11 = 0
buy11 := r ? 0 : g ? 1 : nz(buy11[1])
sell11 = 0
sell11 := r ? 1 : g ? 0 : nz(sell11[1])

buy = buy11 and not buy11[1]
sell = sell11 and not sell11[1]
multiple_signals = input(true)

if multiple_signals
    buy := g and not g[1] and  window()
    sell := r and not r[1] and  window()
    sell
else
    buy := buy and window()
    sell := sell and window()
    sell


//plotshape(long  , color = color.green , text = "Buy" , location = location.belowbar , textcolor = color.white , style = shape.labelup , size = size.small)
//plotshape(short   , color = color.red , text = "Sell" , location = location.abovebar , textcolor = color.white , style = shape.labeldown , size = size.small)
Stop = input(0.5, title='StopLoss') / 100

ProfitPerc = input(defval=1.5, title='Profit') / 100

rev = input(1024,title = "Reverse Limit")

Averaging_position_ = input(true , title = "Averaging position ? ")

qn = 1
qn := nz(qn[1])


long_short = 0
long_last = buy and (nz(long_short[1]) == 0 or nz(long_short[1]) == -1)
short_last = sell and (nz(long_short[1]) == 0 or nz(long_short[1]) == 1)
long_short := long_last ? 1 : short_last ? -1 : long_short[1]

long_entered = false
long_entered := long_entered[1]

short_entered = false
short_entered := short_entered[1]


longPrice = ta.valuewhen(long_last, close, 0)
shortPrice = ta.valuewhen(short_last, close, 0)


longStop = longPrice * (1 - Stop)
shortStop = shortPrice * (1 + Stop)
longTake = longPrice * (1 + ProfitPerc)
shortTake = shortPrice * (1 - ProfitPerc)
plot(long_short == 1 ? longStop : na, style=plot.style_linebr, color=color.new(color.red, 0), linewidth=1, title='Long Fixed SL')
plot(long_short == -1 ? shortStop : na, style=plot.style_linebr, color=color.new(color.red, 0), linewidth=1, title='Short Fixed SL')
plot(long_short == 1 ? longTake : na, style=plot.style_linebr, color=color.new(color.navy, 0), linewidth=1, title='Long Fixed TP')


plot(long_short == -1 ? shortTake : na, style=plot.style_linebr, color=color.new(color.navy, 0), linewidth=1, title='Short Fixed TP')


longBar1 = ta.barssince(long_last)
longBar2 = longBar1 >= 1 ? true : false
shortBar1 = ta.barssince(short_last)
shortBar2 = shortBar1 >= 1 ? true : false

longSLhit = long_short == 1 and longBar2 and low < longStop

if long_entered and sell
    longSLhit := true
    longSLhit

plotshape(longSLhit and not(sell and not short_entered and long_entered), style=shape.labelup, location=location.belowbar, color=color.new(color.gray, 0), size=size.tiny, title='Stop Loss', text='Long SL', textcolor=color.new(color.white, 0))
shortSLhit = long_short == -1 and shortBar2 and high > shortStop


if short_entered and buy
    shortSLhit := true
    shortSLhit

plotshape(shortSLhit and not(buy and not long_entered and short_entered), style=shape.labeldown, location=location.abovebar, color=color.new(color.gray, 0), size=size.tiny, title='Stop Loss', text='Short SL', textcolor=color.new(color.white, 0))


longTPhit = long_short == 1 and longBar2 and high > longTake
plotshape(longTPhit, style=shape.labeldown, location=location.abovebar, color=color.new(color.navy, 0), size=size.tiny, title='Target', text='Long TP', textcolor=color.new(color.white, 0))
shortTPhit = long_short == -1 and shortBar2 and low < shortTake
plotshape(shortTPhit, style=shape.labelup, location=location.belowbar, color=color.new(color.navy, 0), size=size.tiny, title='Target', text='Short TP', textcolor=color.new(color.white, 0))

long_short := (long_short == 1 or long_short == 0) and longBar2 and (longSLhit or longTPhit) ? 0 : (long_short == -1 or long_short == 0) and shortBar2 and (shortSLhit or shortTPhit) ? 0 : long_short

if(shortSLhit or longSLhit or (long_entered[1] and sell) or (short_entered[1] and buy ))
    qn := qn*2

if(longTPhit or shortTPhit or qn > rev)
    qn := 1

if Averaging_position_
    qn := 1

plotshape(buy and not long_entered, color=color.new(color.green, 0), style=shape.labelup, text='Buy', textcolor=color.new(color.white, 0), location=location.belowbar)
plotshape(sell and not short_entered, color=color.new(color.red, 0), style=shape.labeldown, text='Sell', textcolor=color.new(color.white, 0), location=location.abovebar)


// plotshape(buy and not(long_entered) and (short_entered), color = color.green , style = shape.labelup , text = "FA Buy" , textcolor = color.white , location = location.belowbar)
// plotshape(sell and not(short_entered)  and (long_entered), color = color.red , style = shape.labeldown , text = "FA Sell" , textcolor = color.white , location = location.abovebar)


// alertcondition(condition=buy and  not(long_entered)  and (short_entered), title="Fully Algo Buy")
// alertcondition(condition=sell and  not(short_entered)  and (long_entered), title="Fully Algo sell")

alertcondition(condition=buy and not long_entered, title='Buy')
alertcondition(condition=sell and not short_entered, title='Sell')

if long_last
    long_entered := true
    short_entered := false
    short_entered
if short_last
    short_entered := true
    long_entered := false
    long_entered

alertcondition(condition=longSLhit and not(sell and not short_entered and long_entered), title='Long SL')
alertcondition(condition=shortSLhit and not(buy and not long_entered and short_entered), title='Short SL')

alertcondition(condition=longTPhit, title='Long TP')
alertcondition(condition=shortTPhit, title='Short TP')

if longSLhit or longTPhit
    long_entered := false
    long_entered

if shortSLhit or shortTPhit
    short_entered := false
    short_entered

// if buy
//     strategy.entry('buy', strategy.long)
//     strategy.exit('exit', 'buy', limit=longTake, stop=longStop)


// if sell
//     strategy.entry('sell', strategy.short)
//     strategy.exit('exit', 'sell', limit=shortTake, stop=shortStop)
if(buy)
    strategy.entry("buy",strategy.long,qty = qn)
    strategy.exit("Stop","buy",limit = longTake,stop = longStop)

if(sell)
    strategy.entry("sell",strategy.short,qty = qn)
    strategy.exit("Stop","sell",limit = shortTake,stop = shortStop)

strategy.close("buy",when =  longTPhit or sell or longSLhit, comment = "Target")
strategy.close("sell",when =  shortSLhit or shortTPhit or buy , comment = "Stop Loss")

strategy.cancel("buy",when =  longTPhit or sell or longSLhit)
strategy.cancel("sell",when =  shortSLhit or shortTPhit or buy )