ভিক্স মেরামত লিনিয়ার রিগ্রেশনের উপর ভিত্তি করে কম পয়েন্ট ক্যাপচারিং কৌশল
ওভারভিউ
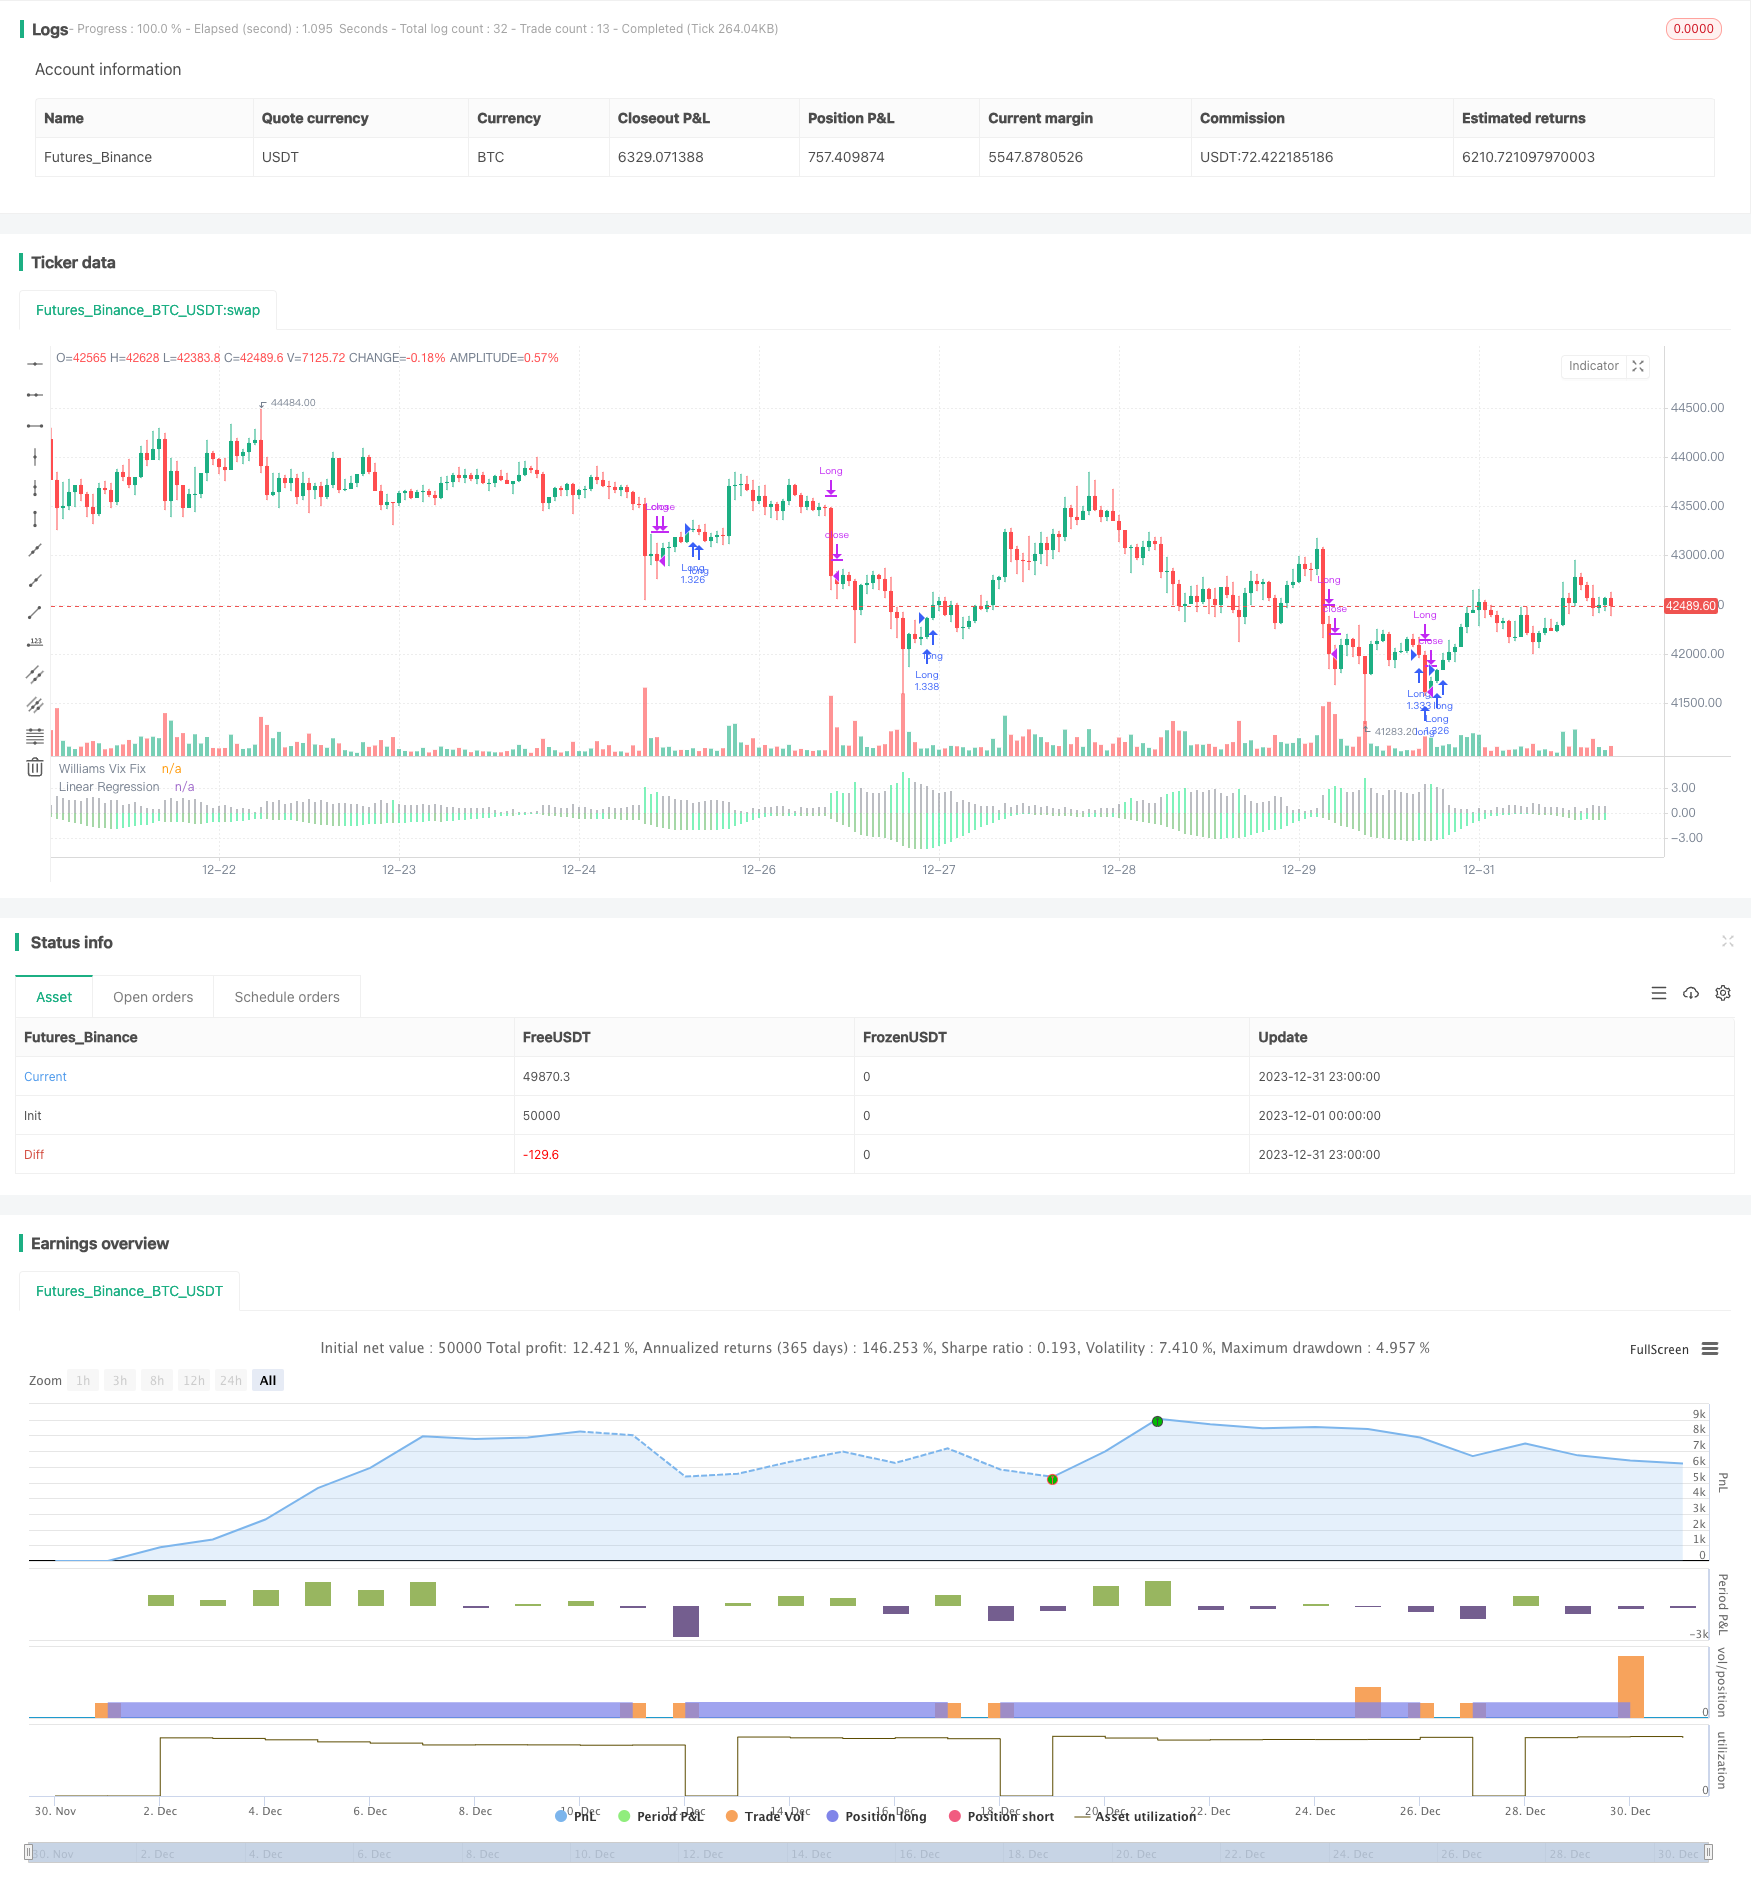
এই কৌশলটির কেন্দ্রীয় ধারণা হল বাজারের নিম্নতম পয়েন্টগুলিকে সঠিকভাবে ক্যাপচার করার জন্য ভিক্স মেরামতের সূচক এবং এর লিনিয়ার রিগ্রেশনকে একত্রিত করা। কৌশলটির নাম হল মেরামতের লিনিয়ার রিগ্রেশন নিম্নতম পয়েন্ট কৌশল।
কৌশল নীতি
- উইক্স মেরামতের সূচক গণনা করুন, এটি বাজারের নিম্নতম স্থানে আরও ভাল বিচার করতে পারে
- লিনিয়ার রিগ্রেশন ভিক্স মেরামত সূচক প্রয়োগ করুন। লিনিয়ার রিগ্রেশন হিস্টোগ্রামের রঙ সবুজ হয়ে গেলে, এটি নির্দেশ করে যে ভিক্স মেরামত লিনিয়ার রিগ্রেশন বাড়তে শুরু করেছে, এটি একটি ক্রয় সংকেত দিতে পারে
- ভিক্স মেরামতের সূচকের সবুজ কলামের সাথে মিলিত হয়ে, ক্রয়ের সময়টি আরও নিশ্চিত করা যায়
- যখন লিনিয়ার রিগ্রেশন হিস্টোগ্রামের রঙ লাল হয়ে যায়, তখন বিক্রির সংকেত দেওয়া হয়
উপরের প্রক্রিয়াটি লিনিয়ার রিগ্রেশন ব্যবহার করে, যা উইক্সকে তার সঠিকতা এবং সময়মততা বাড়ানোর জন্য নির্দেশক সংকেতগুলি মেরামত করে, কিছু মিথ্যা সংকেতগুলি ফিল্টার করে, যার ফলে সঠিকভাবে নিম্ন পয়েন্টগুলি ধরা যায়।
সামর্থ্য বিশ্লেষণ
- কৌশলটি ক্রয়/বিক্রয় সংকেতকে আরও নির্ভুল এবং নির্ভরযোগ্য করে তোলার জন্য লিনিয়ার রিগ্রেশন ফিল্টারিং উইক্স মেরামতের সূচকের আংশিক মিথ্যা সংকেত ব্যবহার করে
- লিনিয়ার রিগ্রেশন সংকেতের সংবেদনশীলতা এবং সময়োপযোগীতা বাড়ায়, দ্রুত বাজারের বিপর্যয়কে ধরতে সক্ষম করে
- কৌশল লজিক সহজ এবং স্পষ্ট, সহজেই বোঝা যায়, পরিমাণগত ব্যবসায়ের জন্য উপযুক্ত
- বাজারের পরিবর্তনের সাথে খাপ খাইয়ে নেওয়ার জন্য অনেকগুলি কনফিগারযোগ্য প্যারামিটার রয়েছে
ঝুঁকি ও সমাধান
- এই কৌশলটি মূলত বাজারের সামগ্রিক নিম্নতম স্থানে বিচার করার জন্য ব্যবহৃত হয়, এটি স্বতন্ত্র শেয়ারের জন্য উপযুক্ত নয়
- লিনিয়ার রিগ্রেশন সম্পূর্ণরূপে জাল সংকেত ফিল্টার করতে পারে না, এবং ভিক্স মেরামত সূচকগুলির সাথে মিলিত হওয়ার ঝুঁকি হ্রাস করতে পারে
- প্যারামিটারগুলি যথাযথভাবে সামঞ্জস্য করতে হবে, পরিবর্তিত পরিস্থিতির সাথে খাপ খাইয়ে নিতে হবে এবং ব্যর্থতা এড়াতে হবে
- অন্যান্য সূচকগুলির সাথে সংযুক্ত হওয়ার পরামর্শ দেওয়া হচ্ছে, যাতে সংকেতটি আরও নিশ্চিত করা যায়
অপ্টিমাইজেশান দিক
- আরও পরিস্রাবণ সংকেত বিবেচনা করা যেতে পারে যদি এটি একটি ওলট-পালট হার সূচক বা একটি পরিমাণগত শক্তি সূচকের সাথে একত্রিত হয়
- প্যারামিটারগুলিকে স্বয়ংক্রিয়ভাবে অপ্টিমাইজ করার উপায়গুলি অনুসন্ধান করুন এবং কৌশলগুলিকে আরও বুদ্ধিমান করুন
- মেশিন লার্নিং পদ্ধতিগুলি অন্বেষণ করা যেতে পারে, যা আরও জটিল মডেলগুলি ব্যবহার করে ভিক্স মেরামতের প্রবণতা পূর্বাভাস দিতে পারে
- এই ধরনের একটি পদ্ধতি ব্যবহার করে, আপনি কীভাবে ভুয়া সংকেতগুলিকে ফিল্টার করবেন তা পরীক্ষা করতে পারেন।
সারসংক্ষেপ
এই কৌশলটি কম পয়েন্টগুলি নির্ধারণের জন্য ভিক্সের মেরামতের সূচক ব্যবহার করে এবং একই সাথে, বাজার কম পয়েন্টগুলিকে কার্যকরভাবে ক্যাপচার করার জন্য সিগন্যালের গুণমান বাড়ানোর জন্য লিনিয়ার রিগ্রেশন প্রবর্তন করে। কৌশলটি সহজ ব্যবহারিক, ফলাফলগুলি আদর্শ, মিথ্যা সংকেতগুলি সম্পূর্ণরূপে ফিল্টার করতে ব্যর্থ হলে মূল ঝুঁকি। আমাদের এখনও প্যারামিটার সেটিংটি অপ্টিমাইজ করতে হবে এবং কৌশলটি আরও উন্নত করতে সংকেতগুলিকে আরও নিশ্চিত করার জন্য অন্যান্য উপায়গুলি প্রবর্তন করার বিষয়ে বিবেচনা করতে হবে। সামগ্রিকভাবে, এই কৌশলটি বাজার কম পয়েন্টগুলি নির্ধারণের জন্য একটি নতুন কার্যকর উপায় সরবরাহ করে যা আরও গবেষণা করার যোগ্য।
/*backtest
start: 2023-12-01 00:00:00
end: 2023-12-31 23:59:59
period: 1h
basePeriod: 15m
exchanges: [{"eid":"Futures_Binance","currency":"BTC_USDT"}]
*/

// This source code is subject to the terms of the Mozilla Public License 2.0 at https://mozilla.org/MPL/2.0/
// © HeWhoMustNotBeNamed

//@version=4
strategy("VixFixLinReg-Strategy", shorttitle="VixFixLinReg - Strategy",
                     overlay=false, initial_capital = 100000,
                     default_qty_type = strategy.percent_of_equity, default_qty_value = 100, commission_type = strategy.commission.percent, pyramiding = 1,
                     commission_value = 0.01)
pd = input(22, title="LookBack Period Standard Deviation High")
bbl = input(20, title="Bolinger Band Length")
mult = input(2.0    , minval=1, maxval=5, title="Bollinger Band Standard Devaition Up")
lb = input(50  , title="Look Back Period Percentile High")
ph = input(.85, title="Highest Percentile - 0.90=90%, 0.95=95%, 0.99=99%")
pl = input(1.01, title="Lowest Percentile - 1.10=90%, 1.05=95%, 1.01=99%")
hp = input(false, title="Show High Range - Based on Percentile and LookBack Period?")
sd = input(false, title="Show Standard Deviation Line?")
i_startTime = input(defval = timestamp("01 Jan 2010 00:00 +0000"), title = "Start Time", type = input.time)
i_endTime = input(defval = timestamp("01 Jan 2099 00:00 +0000"), title = "End Time", type = input.time)
inDateRange = true
considerVIXFixClose = input(false)
lengthKC=input(20, title="KC Length")
multKC = input(1.5, title="KC MultFactor")

atrLen = input(22)
atrMult = input(5)
initialStopBar = input(5)
waitForCloseBeforeStop = input(true)
f_getStop(atrLen, atrMult)=>
    stop = strategy.position_size > 0 ? close - (atrMult * atr(atrLen)) : lowest(initialStopBar)
    stop := strategy.position_size > 0 ? max(stop,nz(stop[1], stop)) : lowest(initialStopBar)
    stop

wvf = ((highest(close, pd)-low)/(highest(close, pd)))*100

sDev = mult * stdev(wvf, bbl)
midLine = sma(wvf, bbl)
lowerBand = midLine - sDev
upperBand = midLine + sDev

rangeHigh = (highest(wvf, lb)) * ph
rangeLow = (lowest(wvf, lb)) * pl


col = wvf >= upperBand or wvf >= rangeHigh ? color.lime : color.gray

val = linreg(wvf, pd, 0)
absVal = abs(val)

linRegColor = val>val[1]? (val > 0 ? color.green : color.orange): (val > 0 ? color.lime : color.red)
plot(hp and rangeHigh ? rangeHigh : na, title="Range High Percentile", style=plot.style_line, linewidth=4, color=color.orange)
plot(hp and rangeLow ? rangeLow : na, title="Range High Percentile", style=plot.style_line, linewidth=4, color=color.orange)
plot(wvf, title="Williams Vix Fix", style=plot.style_histogram, linewidth = 4, color=col)
plot(sd and upperBand ? upperBand : na, title="Upper Band", style=plot.style_line, linewidth = 3, color=color.aqua)

plot(-absVal, title="Linear Regression", style=plot.style_histogram, linewidth=4, color=linRegColor)

vixFixState = (col == color.lime) ? 1: 0
vixFixState := strategy.position_size == 0? max(vixFixState, nz(vixFixState[1],0)) : vixFixState

longCondition = (vixFixState == 1 and linRegColor == color.lime) and inDateRange
exitLongCondition = (linRegColor == color.orange or linRegColor == color.red) and considerVIXFixClose

stop = f_getStop(atrLen, atrMult)
label_x = time+(60*60*24*1000*20)
myLabel = label.new(x=label_x, y=0, text="Stop : "+tostring(stop), xloc=xloc.bar_time, style=label.style_none, textcolor=color.black, size=size.normal)
label.delete(myLabel[1])
strategy.entry("Long", strategy.long, when=longCondition, oca_name="oca_buy")
strategy.close("Long", when=exitLongCondition or (close < stop and waitForCloseBeforeStop and linRegColor == color.green))
strategy.exit("ExitLong", "Long", stop = stop, when=not waitForCloseBeforeStop and linRegColor == color.green)