ব্রেকআউট ট্র্যাকিং কৌশল

ওভারভিউ
এই কৌশলটির মূল ধারণা হল প্রবণতার দিকনির্দেশনাকে বৃহত্তর সময় ফ্রেমে চিহ্নিত করা এবং ছোট সময় ফ্রেমে প্রবেশের ব্রেকপয়েন্ট খুঁজে বের করা। স্টপ লস এক্সট বড় সময় ফ্রেমে চলমান গড় অনুসরণ করে।
কৌশল নীতি
এই কৌশলটি মূলত তিনটি সূচকের উপর ভিত্তি করে নির্ণয় করা হয়ঃ
প্রথমত, একটি দীর্ঘ সময়ের (যেমন সূর্যের রেখা) X-দিনের সরল চলমান গড় গণনা করা হয়, যখন দামের স্টেশনে চলমান গড়ের সময় কেনার অনুমতি দেওয়া হয়। এটি সামগ্রিক প্রবণতার দিকনির্দেশের জন্য ব্যবহার করা যেতে পারে, যাতে ট্রেডিংয়ের ঝড়ের সময় এড়ানো যায়।
দ্বিতীয়ত, একটি স্বল্প সময়ের মধ্যে সর্বোচ্চ মূল্য (যেমন 5 দিন) গণনা করুন, যখন দামটি এই সর্বোচ্চ মূল্য অতিক্রম করে তখন একটি কেনার সংকেত ট্রিগার করে।
তৃতীয়ত, একটি স্টপ লাইন স্থাপন করা। অবস্থান প্রবেশের পরে, স্টপ লাইনটি সর্বনিম্ন মূল্যের নিকটতম সর্বনিম্ন থেকে একটি নির্দিষ্ট সময়ের lbStop-এ লক করা হয়। একই সাথে একটি চলমান গড় (যেমন 10-দিনের ইএমএ) একটি প্রস্থান প্রক্রিয়া হিসাবে সেট করা হয়, যখন দামটি চলমান গড়ের নীচে থাকে তখন অবস্থান থেকে বেরিয়ে আসে।
এই কৌশলটি অতিরিক্ত পয়েন্ট ক্রয় করা এড়াতে ATR মান সেট করে। এছাড়াও, অন্যান্য সহায়ক শর্তগুলি যেমন রিটার্নিং টাইম রেঞ্জ রয়েছে।
এই তিনটি সূচকের পারস্পরিক সম্পর্ক এই কৌশলটির মূল যুক্তি গঠন করে।
কৌশলগত শক্তি বিশ্লেষণ
এটি একটি বিরল ট্র্যাকিং কৌশল, যার কিছু সুবিধা রয়েছেঃ
-
দুটি টাইম ফ্রেম ব্যবহার করুন, যাতে বাজারের ভয়াবহতার ভুয়া ব্রেকআউটে আটকে না পড়ে। দীর্ঘ সময় ফ্রেমগুলি সামগ্রিক প্রবণতা বিচার করে এবং সংক্ষিপ্ত সময় ফ্রেমগুলি নির্দিষ্ট প্রবেশের পয়েন্টগুলি সন্ধান করে।
-
সুইং হাই-এর মাধ্যমে তৈরি হওয়া ব্রেকআউটগুলি বেশ সহজেই ট্র্যাক করা যায়। প্রকৃত কার্যকর ব্রেকআউটগুলি খুঁজে বের করার জন্য lb প্যারামিটারগুলি পর্যালোচনা করা যেতে পারে।
-
স্টপ লস পদ্ধতিটি আরও কঠোর, সাম্প্রতিক নিম্নের ট্র্যাকিং এবং একটি নির্দিষ্ট বাফারিং দূরত্ব রেখে দেওয়া, যাতে এটি বন্ধ না হয়।
-
চলমান গড় ব্যবহার করে প্রস্থান প্রক্রিয়াটি ব্যবহার করা হয়, যার ফলে পরিস্থিতির উপর নির্ভর করে নমনীয়ভাবে বন্ধ করা যায়।
-
এটিআর সূচকটি অতিরিক্ত মাত্রার ঝুঁকি এড়াতে সাহায্য করে।
-
আপনি বিভিন্ন প্যারামিটার সমন্বয় সেট করতে পারেন যা পরীক্ষার জন্য যথেষ্ট।
ঝুঁকি বিশ্লেষণ
এই কৌশলটির কিছু ঝুঁকিও রয়েছেঃ
-
মুভিং এভারেজের কাছাকাছি যখন দাম ওঠানামা করে, তখন বারবার পজিশনে ওঠানামা করার ঝুঁকি থাকে।
-
মুভিং এভারেজের কাছাকাছি ক্রয়-বিক্রয় পয়েন্টটি ভেঙে ফেললে, প্রত্যাহারের ঝুঁকি বেশি থাকে। এটি কৌশলটির নিজস্ব বৈশিষ্ট্য।
-
যখন বাজারে কোন সুস্পষ্ট প্রবণতা নেই, পজিশন ধরে রাখার সময়টি দীর্ঘ হতে পারে, সময় ঝুঁকির সম্মুখীন হতে পারে।
-
এটিআর প্যারামিটারগুলি যুক্তিসঙ্গতভাবে সেট করা দরকার। এটিআর খুব ছোট হলে ফিল্টারিংয়ের কার্যকারিতা দুর্বল হয় এবং খুব বড় হলে প্রবেশের সম্ভাবনা হ্রাস পায়।
-
ফলাফলের উপর বিভিন্ন lb পরামিতির প্রভাব পরীক্ষা করা প্রয়োজন। খুব বড় প্যারামিটারগুলি কিছু সুযোগ মিস করবে, খুব ছোট প্যারামিটারগুলি মিথ্যা বিরতি সনাক্ত করতে পারে।
ঝুঁকি মোকাবিলার উপায়ঃ
- চলমান গড়ের পরামিতিগুলিকে যথাযথভাবে সামঞ্জস্য করুন এবং ফিল্টারিং কার্যকারিতা যুক্ত করুন।
- এটিআর প্যারামিটারগুলিকে অপ্টিমাইজ করুন এবং দৃশ্যমানতার উপর ভিত্তি করে বিচার করুন
- সময়কাল lb এ ফিরে তাকান এবং সর্বোত্তম প্যারামিটার খুঁজুন।
- এই পরিস্থিতিতে বাণিজ্য স্থগিত রাখা।
কৌশল অপ্টিমাইজেশনের দিকনির্দেশনা
এই কৌশলটি নিম্নলিখিত দিকগুলি থেকেও অপ্টিমাইজ করা যেতে পারেঃ
-
চলমান গড়ের বিভিন্ন প্যারামিটার সমন্বয় পরীক্ষা করে সর্বোত্তম প্যারামিটার খুঁজুন।
-
বিভিন্ন ATR প্যারামিটার সেটিং চেষ্টা করুন, প্রবেশের সুযোগ এবং ঝুঁকি নিয়ন্ত্রণের মধ্যে ভারসাম্য বজায় রাখুন।
-
আরও কার্যকরী বিপর্যয় চিহ্নিত করতে lb প্যারামিটারগুলির পুনর্বিবেচনার সময়কালকে অনুকূলিত করুন।
-
গতিশীল স্টপ লস তৈরি করার চেষ্টা করুন, ঝুঁকি নিয়ন্ত্রণের জন্য ওঠানামা এবং প্রত্যাহারের হার অনুযায়ী।
-
ট্রেডিং ভলিউম ইন্ডিকেটরের মতো অন্যান্য বিষয়ের সাথে মিলিতভাবে, এটির কার্যকারিতা মূল্যায়ন করা হয়।
-
উদাহরণস্বরূপ, </>, </,>< ইত্যাদি রেফারেন্সের জন্য পয়েন্টস অফ এক্সপেরিমেন্ট খুঁজে বের করার পদ্ধতি তৈরি করুন।
-
মেশিন লার্নিং ব্যবহার করে প্যারামিটার প্রশিক্ষণের চেষ্টা করুন
সারসংক্ষেপ
এই কৌশলটি সামগ্রিকভাবে একটি প্রচলিত ব্রেক ট্র্যাকিং কৌশল। দ্বিগুণ সময়সীমার বিচার, সুইং হাই প্রবেশের সময়, স্টপ লিন এবং মুভিং এভারেজের দ্বিগুণ বীমা প্রস্থান প্রক্রিয়া সনাক্ত করে, একটি সম্পূর্ণ যৌক্তিক সিস্টেম গঠন করে। এই কৌশলটির ঝুঁকি এবং উপার্জনের বৈশিষ্ট্যগুলি সুস্পষ্ট এবং মাঝারি এবং দীর্ঘ লাইন অনুসরণকারী ধরণের বিনিয়োগকারীদের জন্য উপযুক্ত। যদিও কিছু ঝুঁকি রয়েছে, তবে প্যারামিটার অপ্টিমাইজেশন এবং নিয়ম অপ্টিমাইজেশনের মাধ্যমে ঝুঁকি স্তরকে হ্রাস করা যেতে পারে। এই কৌশলটিতে অনেক উন্নতির জায়গা রয়েছে, যদি আরও সূচকীয় বিচারগুলি যুক্ত করা হয় তবে কৌশলটির কার্যকারিতা আরও বাড়িয়ে তুলতে পারে।
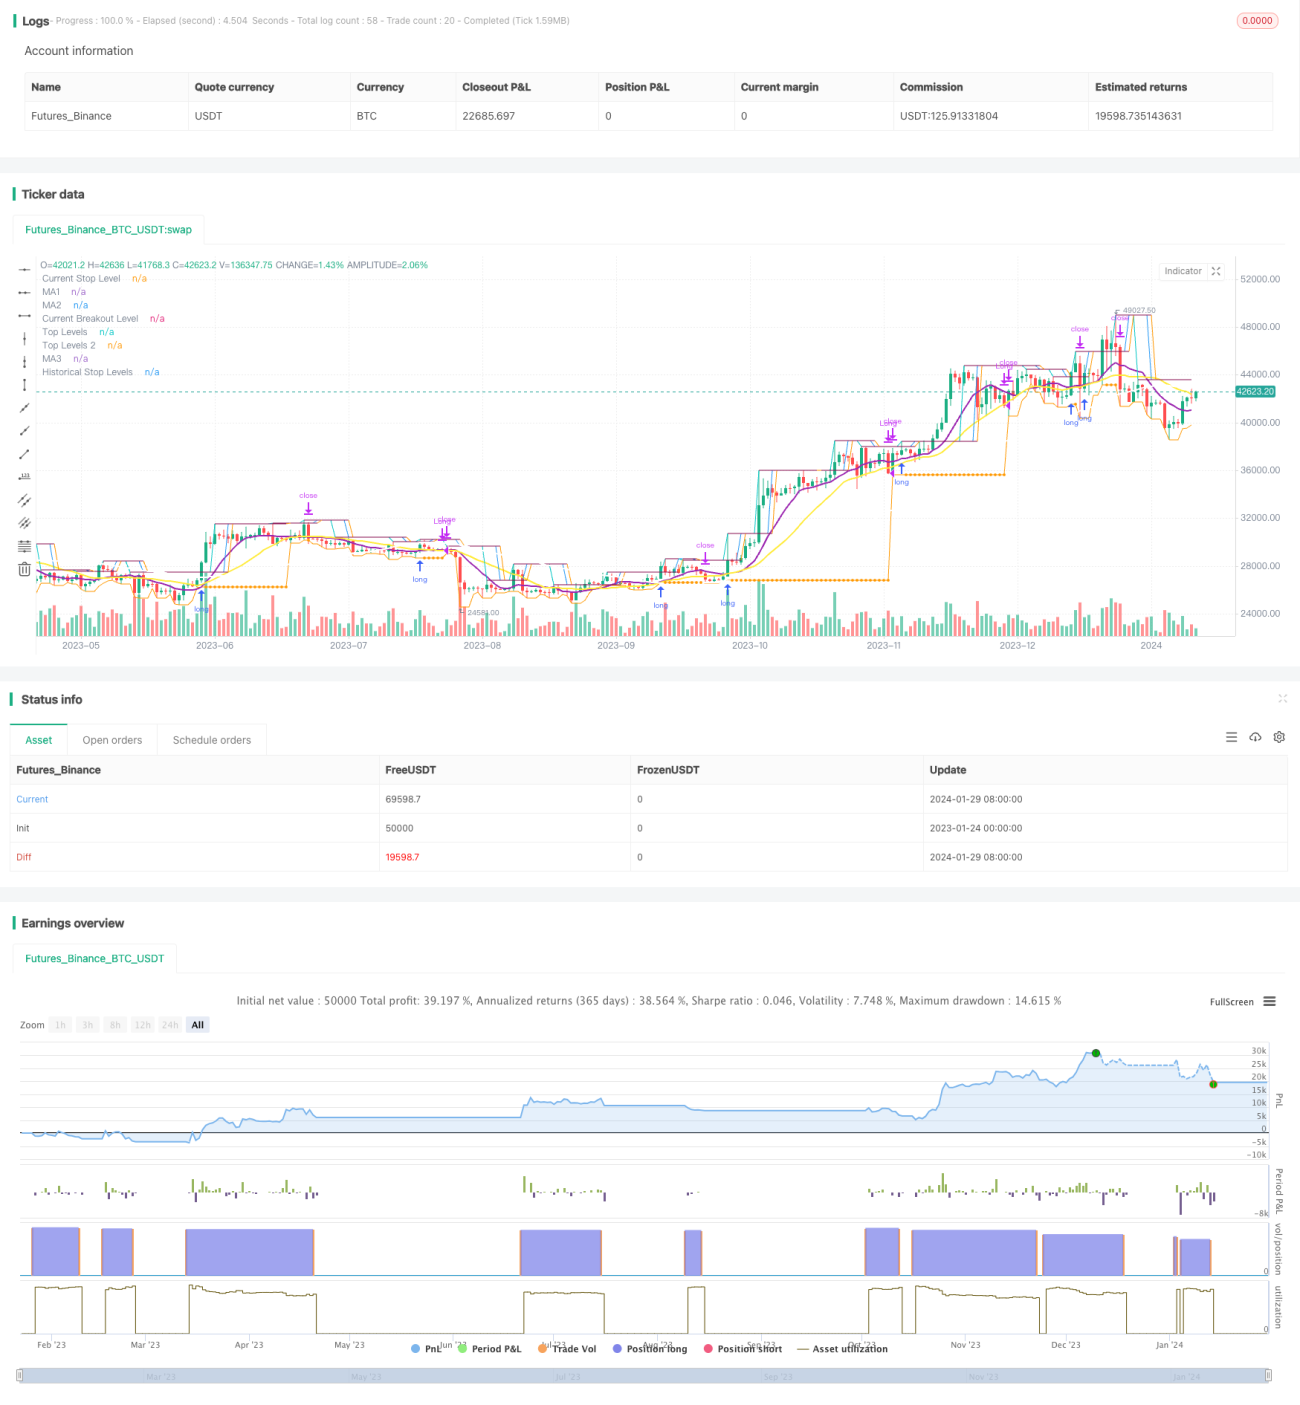
/*backtest
start: 2023-01-24 00:00:00
end: 2024-01-30 00:00:00
period: 1d
basePeriod: 1h
exchanges: [{"eid":"Futures_Binance","currency":"BTC_USDT"}]
*/

// This source code is subject to the terms of the Mozilla Public License 2.0 at https://mozilla.org/MPL/2.0/
// © millerrh

// The intent of this strategy is to buy breakouts with a tight stop on smaller timeframes in the direction of the longer term trend.- 1