দ্বি-মুখী গ্রিড কে-লাইন ট্র্যাকিং ট্রেডিং কৌশল
ওভারভিউ
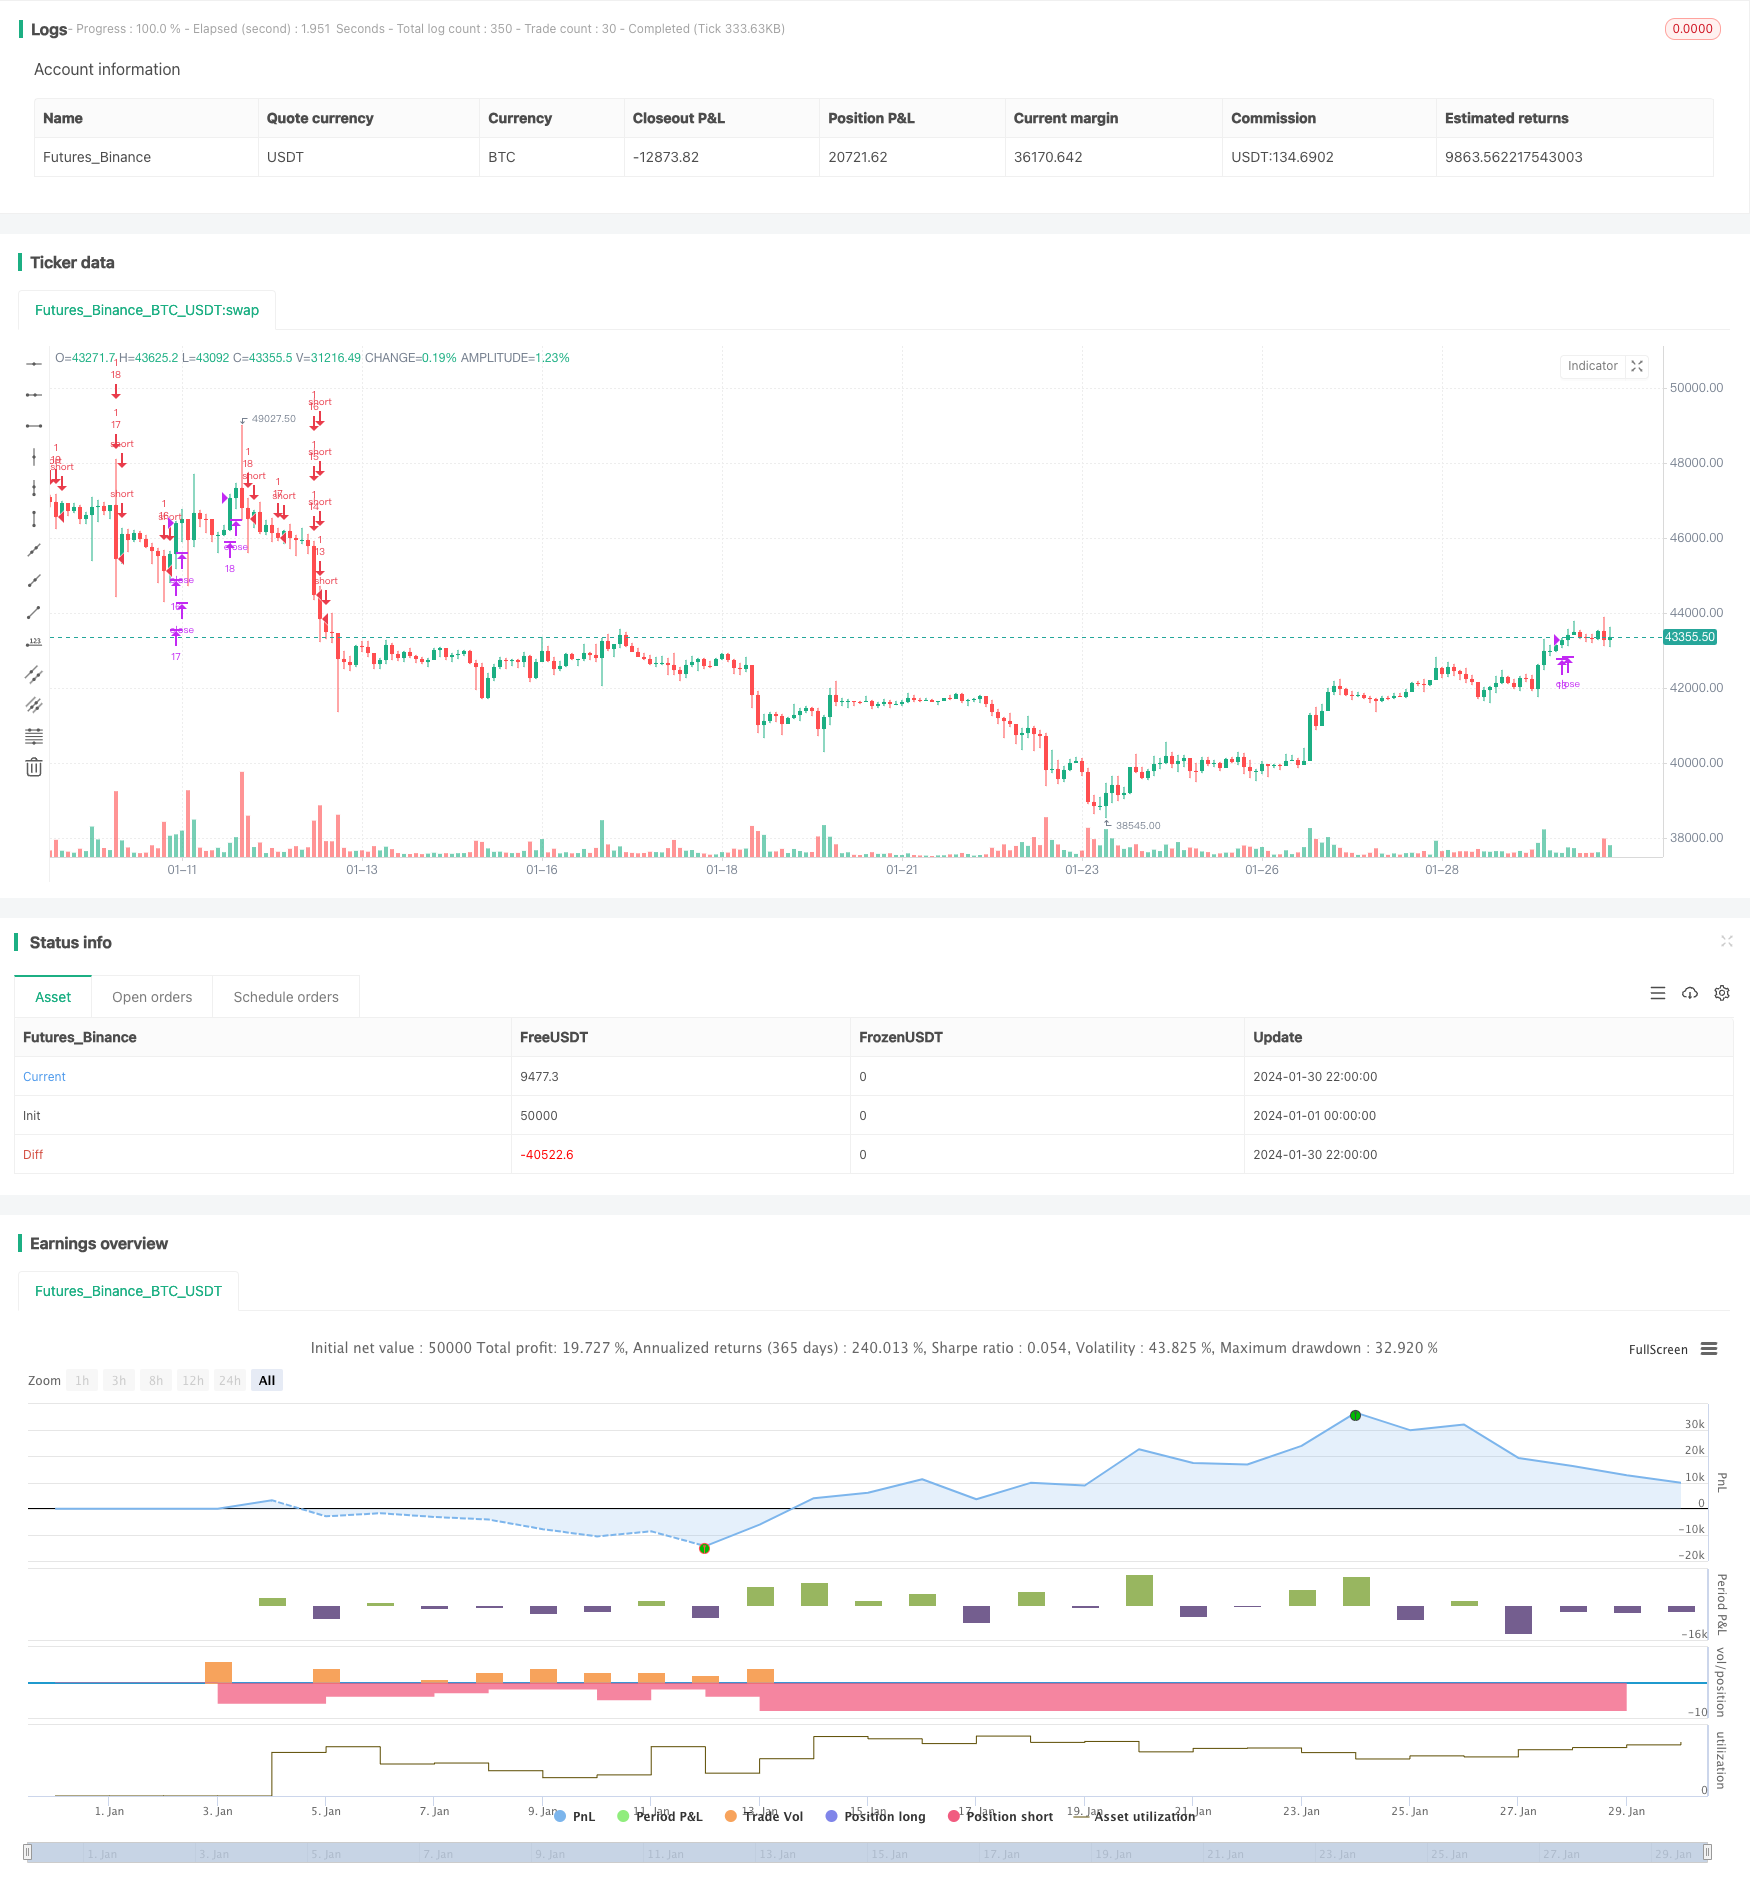
এই কৌশলটি একটি K-লাইন ভিত্তিক, রিয়েল-টাইম পরিবর্তনশীল, দ্বি-মুখী ট্র্যাকিং গ্রিড ট্রেডিং কৌশল। এটি বুল বা বিয়ার বাজার উভয় ক্ষেত্রেই স্থিতিশীল মুনাফা অর্জন করতে পারে।
কৌশল নীতি
ব্যবহারকারীর দ্বারা সেট করা গ্রিডের সংখ্যার উপর ভিত্তি করে, গ্রিডের ব্যাপ্তি এবং প্রতিটি গ্রিডের দাম স্বয়ংক্রিয়ভাবে গণনা করা হয়।
যখন মূল্য নেট মূল্য অতিক্রম করে, তখন স্থির পরিমাণে পজিশন খোলার জন্য আরও বেশি; যখন মূল্য নেট মূল্যের নীচে পড়ে, তখন পজিশন খোলার জন্য আরও বেশি পজিশন খোলার জন্য।
এইভাবে, যখন দামগুলি গ্রিডের মধ্যে ঝাঁকুনি দেয়, তখন দামের পরিবর্তনের উপর নজর রেখে লাভ করা যায়।
সামর্থ্য বিশ্লেষণ
ম্যানুয়ালি সমর্থন প্রতিরোধের নির্ধারণ না করে স্বয়ংক্রিয়ভাবে যুক্তিসঙ্গত গ্রিডের ব্যাপ্তি গণনা করুন।
দ্বিপাক্ষিক লেনদেন, বাজারের পরিবর্তিত পরিবেশের সাথে খাপ খাইয়ে নিতে পারে।
ফিক্সড পজিশনের সংখ্যা ঝুঁকি নিয়ন্ত্রণে সহায়ক।
কোডটি সহজবোধ্য, সহজে বোঝা যায় এবং পরিবর্তন করা যায়।
ঝুঁকি বিশ্লেষণ
এই পরিস্থিতিতে বড় ধরনের অস্থিরতার ফলে ক্ষতির পরিমাণ বাড়তে পারে।
ট্রেডিং চার্জের উপর নির্ভর করে আপনার চূড়ান্ত মুনাফা কেমন হবে।
নেটওয়ার্কের সংখ্যা সঠিকভাবে নির্ধারণ করা প্রয়োজন, অনেকগুলি নেটওয়ার্ক ট্রেডিংয়ের সংখ্যা বাড়ায় তবে প্রতিবারের মুনাফা সীমিত।
অপ্টিমাইজেশান দিক
ক্ষতির বিস্তার রোধে স্টপ লস কৌশল অবলম্বন করুন।
গ্রিড সংখ্যা গতিশীল সমন্বয় যোগ করুন
লিভারেজ যুক্ত করার কথা ভাবুন এবং লেনদেনের পরিমাণ বাড়ান।
সারসংক্ষেপ
এই কৌশলটির সামগ্রিক ধারণাটি পরিষ্কার এবং সংক্ষিপ্ত, দ্বি-মুখী ট্র্যাকিং গ্রিডের লেনদেনের মাধ্যমে স্থিতিশীল উপার্জন করা হয়, তবে একই সাথে কিছু লেনদেনের ঝুঁকিও রয়েছে। ক্রমাগত অপ্টিমাইজেশনের মাধ্যমে আরও ভাল ফলাফল আশা করা যায়।
/*backtest
start: 2024-01-01 00:00:00
end: 2024-01-31 00:00:00
period: 2h
basePeriod: 15m
exchanges: [{"eid":"Futures_Binance","currency":"BTC_USDT"}]
*/

//@version=4

//hk4jerry

strategy("Grid Bot Backtesting", overlay=false, pyramiding=3000, close_entries_rule="ANY", default_qty_type=strategy.cash, initial_capital=100.0, currency="USD", commission_type=strategy.commission.percent, commission_value=0.025)
i_autoBounds    = input(group="Grid Bounds", title="Use Auto Bounds?", defval=true, type=input.bool)                             // calculate upper and lower bound of the grid automatically? This will theorhetically be less profitable, but will certainly require less attention
i_boundSrc      = input(group="Grid Bounds", title="(Auto) Bound Source", defval="Hi & Low", options=["Hi & Low", "Average"])     // should bounds of the auto grid be calculated from recent High & Low, or from a Simple Moving Average
i_boundLookback = input(group="Grid Bounds", title="(Auto) Bound Lookback", defval=250, type=input.integer, maxval=500, minval=0) // when calculating auto grid bounds, how far back should we look for a High & Low, or what should the length be of our sma
i_boundDev      = input(group="Grid Bounds", title="(Auto) Bound Deviation", defval=0.10, type=input.float, maxval=1, minval=-1)  // if sourcing auto bounds from High & Low, this percentage will (positive) widen or (negative) narrow the bound limits. If sourcing from Average, this is the deviation (up and down) from the sma, and CANNOT be negative.
i_upperBound    = input(group="Grid Bounds", title="(Manual) Upper Boundry(상단 가격)", defval=0.285, type=input.float)                      // for manual grid bounds only. The upperbound price of your grid
i_lowerBound    = input(group="Grid Bounds", title="(Manual) Lower Boundry(하단 가격)", defval=0.225, type=input.float)                      // for manual grid bounds only. The lowerbound price of your grid.
i_gridQty       = input(group="Grid Lines",  title="Grid Line Quantity(그리드 수)", defval=30, maxval=999, minval=1, type=input.integer)       // how many grid lines are in your grid
initial_balance = input(group="Trading option", title="Initial balance(투자금액)", defval=100, step=0.01)


start_time = input(group="Trading option",defval=timestamp('15 March 2023 06:00'), title='Start Time', type = input.time)
end_time = input(group="Trading option",defval=timestamp('31 Dec 2035 20:00'), title='End Time', type = input.time)
isAfterStartDate = true

tradingtime= (timenow - start_time)/(86400000*30)
yeartime=tradingtime/12


f_getGridBounds(_bs, _bl, _bd, _up) =>
    if _bs == "Hi & Low"
        _up ? highest(close, _bl) * (1 + _bd) : lowest(close, _bl)  * (1 - _bd)
    else
        avg = sma(close, _bl)
        _up ? avg * (1 + _bd) : avg * (1 - _bd)

f_buildGrid(_lb, _gw, _gq) =>
    gridArr = array.new_float(0)
    for i=0 to _gq-1
        array.push(gridArr, _lb+(_gw*i))
    gridArr

f_getNearGridLines(_gridArr, _price) =>
    arr = array.new_int(3)
    for i = 0 to array.size(_gridArr)-1
        if array.get(_gridArr, i) > _price
            array.set(arr, 0, i == array.size(_gridArr)-1 ? i : i+1)
            array.set(arr, 1, i == 0 ? i : i-1)
            break
    arr

var upperBound      = i_autoBounds ? f_getGridBounds(i_boundSrc, i_boundLookback, i_boundDev, true) : i_upperBound  // upperbound of our grid
var lowerBound      = i_autoBounds ? f_getGridBounds(i_boundSrc, i_boundLookback, i_boundDev, false) : i_lowerBound // lowerbound of our grid
var gridWidth       = (upperBound - lowerBound)/(i_gridQty-1)                                                       // space between lines in our grid
var gridLineArr     = f_buildGrid(lowerBound, gridWidth, i_gridQty)                                                 // an array of prices that correspond to our grid lines
var orderArr        = array.new_bool(i_gridQty, false)                                                              // a boolean array that indicates if there is an open order corresponding to each grid line

var closeLineArr    = f_getNearGridLines(gridLineArr, close)                                                        // for plotting purposes - an array of 2 indices that correspond to grid lines near price
var nearTopGridLine = array.get(closeLineArr, 0)                                                                    // for plotting purposes - the index (in our grid line array) of the closest grid line above current price
var nearBotGridLine = array.get(closeLineArr, 1)                                                                    // for plotting purposes - the index (in our grid line array) of the closest grid line below current price
if isAfterStartDate
    for i = 0 to (array.size(gridLineArr) - 1)
        if close < array.get(gridLineArr, i) and not array.get(orderArr, i) and i < (array.size(gridLineArr) - 1)
            buyId = i
            array.set(orderArr, buyId, true)
            strategy.entry(id=tostring(buyId), long=true, qty=(initial_balance/(i_gridQty-1))/close, comment="#"+tostring(buyId))
        if close > array.get(gridLineArr, i) and i != 0
            if array.get(orderArr, i-1)
                sellId = i-1
                array.set(orderArr, sellId, false)
                strategy.close(id=tostring(sellId), comment="#"+tostring(sellId))

    if i_autoBounds
        upperBound  := f_getGridBounds(i_boundSrc, i_boundLookback, i_boundDev, true)
        lowerBound  := f_getGridBounds(i_boundSrc, i_boundLookback, i_boundDev, false)
        gridWidth   := (upperBound - lowerBound)/(i_gridQty-1)
        gridLineArr := f_buildGrid(lowerBound, gridWidth, i_gridQty)

    closeLineArr    := f_getNearGridLines(gridLineArr, close)
    nearTopGridLine := array.get(closeLineArr, 0)
    nearBotGridLine := array.get(closeLineArr, 1)


var table table = table.new(position.top_right,6,8, frame_color = color.rgb(255, 255, 255),frame_width = 2,border_width = 2, border_color=color.rgb(255, 255, 255))


//제목
table.cell(table,0,0,"Upper limit price :", bgcolor=color.new(color.black,0),text_color =color.white)
table.cell(table,0,1,"Lower limit price :",bgcolor=color.new(color.black,0),text_color =color.white)
table.cell(table,0,2,"Grids quantity :",bgcolor=color.new(color.black,0),text_color =color.white)
table.cell(table,0,3,"Investment :",text_color =color.white,bgcolor=color.new(color.black,0))
table.cell(table,0,4,"USDT per grid :",text_color =color.white,bgcolor=color.new(color.black,0))
//수치
table.cell(table,1,0, tostring(upperBound, '###.#####')+ "  USDT", bgcolor=color.new(#5a637e, 0),text_color =color.white)
table.cell(table,1,1, tostring(lowerBound, '###.#####')+ "  USDT", bgcolor=color.new(#5a637e, 0),text_color =color.white)
table.cell(table,1,2, tostring(i_gridQty, '###'), bgcolor=color.new(#5a637e, 0),text_color =color.white)
table.cell(table,1,3, tostring(initial_balance,'###.##')+ "  USDT", bgcolor=color.new(#5a637e, 0),text_color =color.white)
table.cell(table,1,4, tostring(initial_balance/i_gridQty,'###.##')+ "  USDT", bgcolor=color.new(#5a637e, 0),text_color =color.white)

//제목
table.cell(table,2,0,"Current position :",text_color =color.white,bgcolor=color.new(color.black,0))
table.cell(table,2,1,"Position cost price :",text_color =color.white,bgcolor=color.new(color.black,0))
table.cell(table,2,2,"Unrealized profit :",bgcolor=color.new(color.black,0),text_color =color.white)
table.cell(table,2,3,"Unrealized profit % :",bgcolor=color.new(color.black,0),text_color =color.white)
table.cell(table,2,4,"Fee :",text_color =color.white,bgcolor=color.new(color.black,0))

//수치
table.cell(table,3,0, tostring(strategy.position_size) +   syminfo.basecurrency + "\n"  + tostring(strategy.position_size*strategy.position_avg_price/1, '###.##') + "USDT" ,text_color =color.white,bgcolor=color.new(#5a637e, 0))
table.cell(table,3,1, text=strategy.position_size>0 ? tostring(strategy.position_avg_price,'###.####')+ "  USDT" : "NOT TRADING",text_color =color.white,bgcolor=color.new(#5a637e, 0))
table.cell(table,3,2, tostring(strategy.openprofit, '###.##')+ "  USDT",text_color =color.white,bgcolor=strategy.openprofit > 0 ? color.teal : color.maroon)
table.cell(table,3,3, tostring(strategy.openprofit/initial_balance*100, '###.##')+ "%",text_color =color.white,bgcolor=strategy.openprofit > 0 ? color.teal : color.maroon)
table.cell(table,3,4, "-" + tostring(strategy.position_avg_price*strategy.position_size*0.025/100,'###.##')+ "  USDT",text_color =color.white,bgcolor=color.new(#5a637e, 0))

//제목
table.cell(table,4,0,"Grid profit :",text_color =color.white,bgcolor=color.new(color.black,0))
table.cell(table,4,1,"Grid profit % :",text_color =color.white,bgcolor=color.new(color.black,0))
table.cell(table,4,2,"Net profit :", bgcolor=color.new(color.black,0),text_color =color.white)
table.cell(table,4,3,"Net profit % :",bgcolor=color.new(color.black,0),text_color =color.white)
table.cell(table,4,4,"Balance USDT :",bgcolor=color.new(color.black,0),text_color =color.white)


//수치
table.cell(table,5,0, tostring(strategy.netprofit, '###.#####')+ "USDT", text_color =color.white,bgcolor=strategy.netprofit > 0 ? color.teal : color.maroon)
table.cell(table,5,1, tostring((strategy.netprofit)/initial_balance*100/tradingtime, '####.##') + "%",text_color =color.white,bgcolor=strategy.netprofit > 0 ? color.teal : color.maroon)
table.cell(table,5,2, tostring(strategy.netprofit+strategy.openprofit, '###.##') + "  USDT",text_color =color.white,bgcolor=strategy.netprofit+strategy.openprofit > 0 ? color.teal : color.maroon)
table.cell(table,5,3, tostring((strategy.netprofit+strategy.openprofit)/initial_balance*100, '####.##') + "%",text_color =color.white,bgcolor=strategy.netprofit+strategy.openprofit > 0 ? color.teal : color.maroon)
table.cell(table,5,4, tostring(initial_balance+strategy.netprofit+strategy.openprofit, '###.##')+ "  USDT", text_color =color.white,bgcolor=color.new(#3d4d7c, 0))


// plot(strategy.initial_capital+ strategy.netprofit+strategy.openprofit, "Current Balance",color=color.rgb(81, 137, 128))
// plot(initial_balance, "Investment",color=color.rgb(81, 137, 128))