ডাবল মুভিং এভারেজ কোয়ান্টিটেটিভ ট্রেডিং কৌশল
ওভারভিউ
এই কৌশলটি একটি ট্রেন্ড ট্র্যাকিং টাইপ কৌশল যা একটি দ্রুত চলমান গড় এবং একটি ধীর চলমান গড় গণনা করে এবং প্যারালাইন সূচকগুলির সাথে একত্রিত করে। এটি ধীর চলমান গড়ের উপরে একটি দ্রুত চলমান গড় অতিক্রম করার সময় এটি বেশি করে এবং ধীর চলমান গড়ের নীচে একটি ধীর চলমান গড় অতিক্রম করার সময় এটি খালি করে।
কৌশল নীতি
- দ্রুত চলমান গড় এবং ধীর চলমান গড় গণনা করুন। চলমান গড়ের পরামিতিগুলি কাস্টমাইজ করা যেতে পারে।
- দুইটি চলমান গড়ের তুলনা করে বাজারের প্রবণতার দিক নির্ণয় করা যায়। যখন দ্রুত চলমান গড়ের উপর দিয়ে ধীর চলমান গড় অতিক্রম করা হয়, তখন এটিকে মাল্টি হেড বাজার হিসাবে বিবেচনা করা হয়; যখন দ্রুত চলমান গড়ের নীচে ধীর চলমান গড় অতিক্রম করা হয়, তখন এটিকে ফাঁকা বাজার হিসাবে বিবেচনা করা হয়।
- ক্রয় সংকেত শুধুমাত্র যখন একটি দ্রুত লাইন একটি ধীর লাইন অতিক্রম করে এবং ক্রয় সংকেত শুধুমাত্র যখন একটি ধীর লাইন অতিক্রম করে এবং ক্রয় সংকেত শুধুমাত্র যখন একটি ধীর লাইন অতিক্রম করে এবং ক্রয় সংকেত শুধুমাত্র যখন একটি দ্রুত লাইন অতিক্রম করে এবং ক্রয় সংকেত শুধুমাত্র যখন একটি ধীর লাইন অতিক্রম করে এবং ক্রয় সংকেত শুধুমাত্র যখন একটি দ্রুত লাইন অতিক্রম করে এবং ক্রয় সংকেত শুধুমাত্র যখন একটি ধীর লাইন অতিক্রম করে এবং ক্রয় সংকেত শুধুমাত্র যখন একটি দ্রুত লাইন অতিক্রম করে এবং ক্রয় সংকেত শুধুমাত্র যখন একটি ধীর লাইন অতিক্রম করে এবং ক্রয় সংকেত শুধুমাত্র যখন একটি ধীর লাইন অতিক্রম করে এবং ক্রয় সংকেত শুধুমাত্র যখন একটি ধীর লাইন অতিক্রম করে এবং ক্রয় সংকেত শুধুমাত্র যখন একটি ধীর লাইন অতিক্রম করে এবং ক্রয় সংকেত একটি ধীর লাইন অতিক্রম করে।
- প্যারালাইন সূচক ব্যবহার করে মিথ্যা ব্রেকআপ ফিল্টার করুন। কেবলমাত্র যখন দ্রুত লাইনটি ধীর গতির লাইনটি অতিক্রম করে এবং বন্ধের দাম দ্রুত লাইনের চেয়ে বেশি হয় এবং শেয়ারের দাম প্যারালাইন লাইনের চেয়ে বেশি হয়, তখনই শেষ পর্যন্ত একটি ক্রয় সংকেত তৈরি হয়; এবং বিপরীতভাবে।
- সর্বোচ্চ ক্ষয়ক্ষতির উপর ভিত্তি করে স্টপ লিন সেট করুন। এটিআর সূচকগুলির সাথে মিলিত স্টপ লিনের নির্দিষ্ট মূল্য গণনা করুন
কৌশলগত সুবিধা
- চলমান গড় ব্যবহার করে বাজারের প্রবণতার দিকনির্দেশনা নির্ধারণ করুন এবং অনির্দিষ্ট দিকনির্দেশের সাথে ঘন ঘন ট্রেডিং এড়িয়ে চলুন
- ডাবল ফিল্টারিং কন্ডিশনগুলি সাধারণ ভুয়া ব্রেকিং সমস্যাগুলি এড়াতে কার্যকর
- স্টপ লস স্ট্র্যাটেজির সাথে একক ক্ষতির কার্যকর নিয়ন্ত্রণ
কৌশলগত ঝুঁকি
- সূচক কৌশলগুলি ভুল সংকেত তৈরি করতে পারে
- মুদ্রার ঝুঁকি বিবেচনা করা হয়নি
- আপনি হয়তো শুরুতে অন্য দিক থেকে মিস করেছেন।
উপরের সমস্যাগুলির জন্য, নিম্নলিখিত দিকগুলি থেকে অপ্টিমাইজেশন করা যেতে পারেঃ
- নির্দিষ্ট জাতের জন্য আরও উপযুক্ত করার জন্য চলমান গড়ের প্যারামিটারগুলি অপ্টিমাইজ করা হয়েছে
- অন্যান্য সূচক বা মডেলের সাথে সংযুক্ত করে সংকেত ফিল্টার করা যায়
- রিয়েল-টাইম হিজারি বা স্বয়ংক্রিয়ভাবে ব্রোকার অ্যাকাউন্ট রূপান্তর করার জন্য মুদ্রার ঝুঁকি বিবেচনা করুন
অপ্টিমাইজেশান দিক
- চলমান গড় প্যারামিটারগুলিকে অনুকূলিতকরণ, প্রবণতাকে আরও ভালভাবে ক্যাপচার করা
- মডেলের সমন্বয় বাড়ানো, সংকেতের নির্ভুলতা বাড়ানো
- মাল্টি টাইম সাইকেল ভেরিফিকেশন, ফাঁকি এড়াতে
- অপ্টিমাইজ করা ক্ষতি বন্ধের কৌশল, কৌশল স্থিতিশীলতা বৃদ্ধি
সারসংক্ষেপ
এই কৌশলটি একটি আদর্শ ডাবল মুভিং এভারেজ এবং সূচক সমন্বয় প্রবণতা ট্র্যাকিং কৌশল। দ্রুত এবং ধীর দুটি মুভিং এভারেজ দিকের তুলনা করে বাজারের প্রবণতা বিচার করুন; এবং একাধিক ফিল্টারিং সূচক একত্রিত করুন, যাতে ট্রেডিং সংকেত তৈরি হয়। একই সময়ে, কৌশলটি একক ক্ষতি নিয়ন্ত্রণের জন্য ক্ষতির থামার বৈশিষ্ট্য রয়েছে। কৌশলটির যুক্তিটি সহজ এবং সহজেই বোঝা যায় এবং প্রয়োজন অনুসারে নমনীয়ভাবে অপ্টিমাইজ করা যায়। অসুবিধাটি হ’ল এটি একটি রুক্ষ প্রবণতা নির্ধারণের সরঞ্জাম হিসাবে সংকেতের নির্ভুলতা উন্নত করা যেতে পারে, যা মেশিন লার্নিং উন্নত মডেলের প্রবর্তন দ্বারা অনুকূলিত করা যেতে পারে।
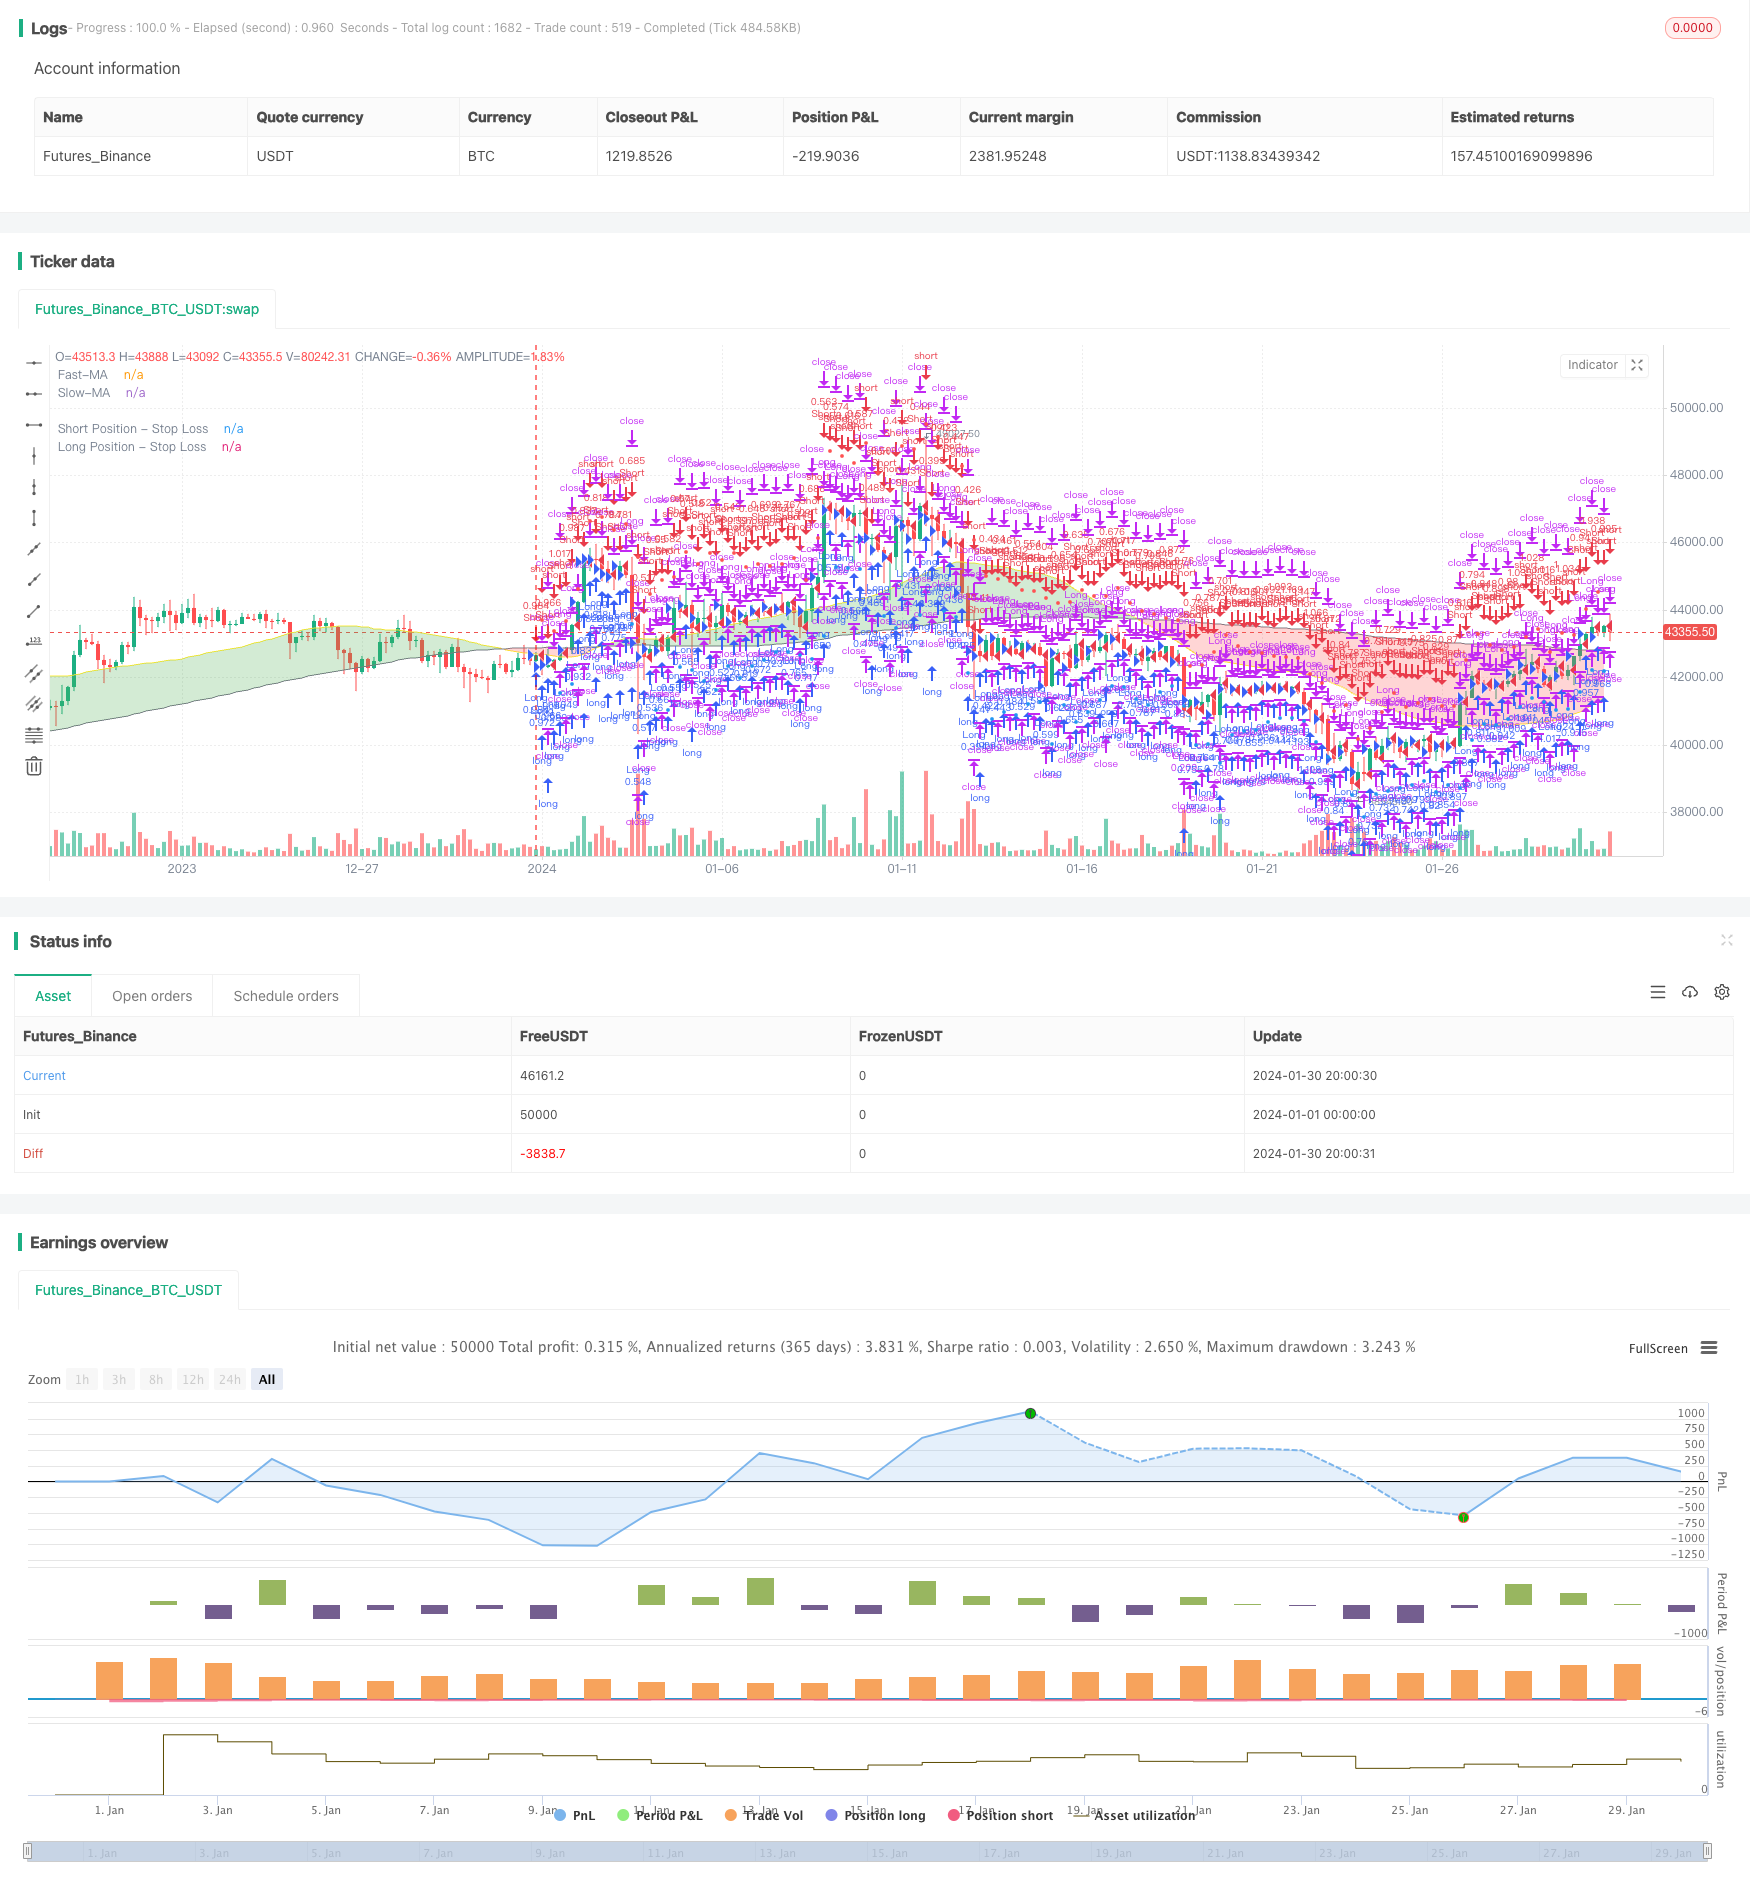
/*backtest
start: 2024-01-01 00:00:00
end: 2024-01-31 00:00:00
period: 4h
basePeriod: 15m
exchanges: [{"eid":"Futures_Binance","currency":"BTC_USDT"}]
*/

// This source code is subject to the terms of the Mozilla Public License 2.0 at https://mozilla.org/MPL/2.0/
// © sosacur01

//@version=5
strategy(title="2 MA | Trend Following", overlay=true, pyramiding=1, commission_type=strategy.commission.percent, commission_value=0.2, initial_capital=10000)

//==========================================


//BACKTEST RANGE
useDateFilter = input.bool(true, title="Filter Date Range of Backtest",
     group="Backtest Time Period")
backtestStartDate = input(timestamp("1 jan 2000"),
     title="Start Date", group="Backtest Time Period",
     tooltip="This start date is in the time zone of the exchange " +
     "where the chart's instrument trades. It doesn't use the time " +
     "zone of the chart or of your computer.")
backtestEndDate = input(timestamp("1 Jul 2100"),
     title="End Date", group="Backtest Time Period",
     tooltip="This end date is in the time zone of the exchange " +
     "where the chart's instrument trades. It doesn't use the time " +
     "zone of the chart or of your computer.")
inTradeWindow = true
if not inTradeWindow and inTradeWindow[1]
    strategy.cancel_all()
    strategy.close_all(comment="Date Range Exit")

//--------------------------------------

//LONG/SHORT POSITION ON/OFF INPUT
LongPositions   = input.bool(title='On/Off Long Postion', defval=true, group="Long & Short Position")
ShortPositions  = input.bool(title='On/Off Short Postion', defval=true, group="Long & Short Position")

//---------------------------------------

//SLOW MA INPUTS
averageType1   = input.string(defval="SMA", group="Slow MA Inputs", title="Slow MA Type", options=["SMA", "EMA", "WMA", "HMA", "RMA", "SWMA", "ALMA", "VWMA", "VWAP"])
averageLength1 = input.int(defval=160, group="Slow MA Inputs", title="Slow MA Length", minval=50)
averageSource1 = input(close, title="Slow MA Source", group="Slow MA Inputs")


//SLOW MA TYPE
MovAvgType1(averageType1, averageSource1, averageLength1) =>
	switch str.upper(averageType1)
        "SMA"  => ta.sma(averageSource1, averageLength1)
        "EMA"  => ta.ema(averageSource1, averageLength1)
        "WMA"  => ta.wma(averageSource1, averageLength1)
        "HMA"  => ta.hma(averageSource1, averageLength1)
        "RMA"  => ta.rma(averageSource1, averageLength1)
        "SWMA" => ta.swma(averageSource1)
        "ALMA" => ta.alma(averageSource1, averageLength1, 0.85, 6)
        "VWMA" => ta.vwma(averageSource1, averageLength1)
        "VWAP" => ta.vwap(averageSource1)
        => runtime.error("Moving average type '" + averageType1 +
             "' not found!"), na


//----------------------------------

//FAST MA INPUTS
averageType2   = input.string(defval="SMA", group="Fast MA Inputs", title="Fast MA Type", options=["SMA","EMA","WMA","HMA","RMA","SWMA","ALMA","VWMA","VWAP"])
averageLength2 = input.int(defval=40, group="Fast MA Inputs", title="Fast MA Length", maxval=40)
averageSource2 = input(close, title="Fast MA Source", group="Fast MA Inputs")

//FAST MA TYPE
MovAvgType2(averageType2, averageSource2, averageLength2) =>
	switch str.upper(averageType2)
        "SMA"  => ta.sma(averageSource2, averageLength2)
        "EMA"  => ta.ema(averageSource2, averageLength2)
        "WMA"  => ta.wma(averageSource2, averageLength2)
        "HMA"  => ta.hma(averageSource2, averageLength2)
        "RMA"  => ta.rma(averageSource2, averageLength2)
        "SWMA" => ta.swma(averageSource2)
        "ALMA" => ta.alma(averageSource2, averageLength2, 0.85, 6)
        "VWMA" => ta.vwma(averageSource2, averageLength2)
        "VWAP" => ta.vwap(averageSource2)
        => runtime.error("Moving average type '" + averageType2 +
             "' not found!"), na

//---------------------------------------------------

//MA VALUES
FASTMA = MovAvgType2(averageType2, averageSource2, averageLength2)
SLOWMA = MovAvgType1(averageType1, averageSource1, averageLength1)

//BUY/SELL TRIGGERS
bullish_trend = FASTMA > SLOWMA and close > FASTMA
bearish_trend = FASTMA < SLOWMA and close < FASTMA

//MAs PLOT
plot1 = plot(SLOWMA,color=color.gray, linewidth=1, title="Slow-MA")
plot2 = plot(FASTMA,color=color.yellow, linewidth=1, title="Fast-MA")
fill(plot1, plot2, color=SLOWMA>FASTMA ? color.new(color.red, 70) : color.new(color.green, 70), title="EMA Clouds")

//-----------------------------------------------------

//PARABOLIC SAR USER INPUT
usepsarFilter = input.bool(title='Use Parabolic Sar?', defval=true, group = "Parabolic SAR Inputs")
psar_display  = input.bool(title="Display Parabolic Sar?", defval=false, group="Parabolic SAR Inputs")
start         = input.float(title="Start", defval=0.02, group="Parabolic SAR Inputs", step=0.001)
increment     = input.float(title="Increment", defval=0.02, group="Parabolic SAR Inputs", step=0.001)
maximum       = input.float(title="Maximum", defval=0.2, group="Parabolic SAR Inputs", step=0.001)

//SAR VALUES
psar        = request.security(syminfo.tickerid, "D", ta.sar(start, increment, maximum))

//BULLISH & BEARISH PSAR CONDITIONS
bullish_psar = (usepsarFilter ? low > psar : bullish_trend )
bearsish_psar = (usepsarFilter ? high < psar : bearish_trend)

//SAR PLOT
psar_plot    = if low > psar
    color.rgb(198, 234, 199, 13)
else
    color.rgb(219, 134, 134, 48)

plot(psar_display ? psar : na, color=psar_plot, title="Par SAR")

//-------------------------------------

//ENTRIES AND EXITS
long_entry  = if inTradeWindow and bullish_trend  and bullish_psar and LongPositions
    true
long_exit   = if inTradeWindow and bearish_trend
    true

short_entry = if inTradeWindow  and bearish_trend and bearsish_psar and ShortPositions
    true
short_exit  = if inTradeWindow  and bullish_trend
    true

//--------------------------------------

//RISK MANAGEMENT - SL, MONEY AT RISK, POSITION SIZING
atrPeriod                = input.int(14, "ATR Length", group="Risk Management Inputs")
sl_atr_multiplier        = input.float(title="Long Position - Stop Loss - ATR Multiplier", defval=2, group="Risk Management Inputs", step=0.5)
sl_atr_multiplier_short  = input.float(title="Short Position - Stop Loss - ATR Multiplier", defval=2, group="Risk Management Inputs", step=0.5)
i_pctStop                = input.float(2, title="% of Equity at Risk", step=.5, group="Risk Management Inputs")/100

//ATR VALUE
_atr = ta.atr(atrPeriod)

//CALCULATE LAST ENTRY PRICE
lastEntryPrice = strategy.opentrades.entry_price(strategy.opentrades - 1)

//STOP LOSS - LONG POSITIONS
var float sl = na

//CALCULTE SL WITH ATR AT ENTRY PRICE - LONG POSITION
if (strategy.position_size[1] != strategy.position_size)
    sl := lastEntryPrice - (_atr * sl_atr_multiplier)

//IN TRADE - LONG POSITIONS
inTrade = strategy.position_size > 0

//PLOT SL - LONG POSITIONS
plot(inTrade ? sl : na, color=color.blue, style=plot.style_circles, title="Long Position - Stop Loss")

//CALCULATE ORDER SIZE - LONG POSITIONS
positionSize = (strategy.equity * i_pctStop) / (_atr * sl_atr_multiplier)

//============================================================================================

//STOP LOSS - SHORT POSITIONS
var float sl_short = na

//CALCULTE SL WITH ATR AT ENTRY PRICE - SHORT POSITIONS
if (strategy.position_size[1] != strategy.position_size)
    sl_short := lastEntryPrice + (_atr * sl_atr_multiplier_short)

//IN TRADE SHORT POSITIONS
inTrade_short = strategy.position_size < 0

//PLOT SL - SHORT POSITIONS
plot(inTrade_short ? sl_short : na, color=color.red, style=plot.style_circles, title="Short Position - Stop Loss")

//CALCULATE ORDER - SHORT POSITIONS
positionSize_short = (strategy.equity * i_pctStop) / (_atr * sl_atr_multiplier_short)


//===============================================

//LONG STRATEGY
strategy.entry("Long", strategy.long, comment="Long", when = long_entry, qty=positionSize)
if (strategy.position_size > 0)
    strategy.close("Long", when = (long_exit), comment="Close Long")
    strategy.exit("Long", stop = sl, comment="Exit Long")

//SHORT STRATEGY
strategy.entry("Short", strategy.short, comment="Short", when = short_entry, qty=positionSize_short)
if (strategy.position_size < 0)
    strategy.close("Short", when = (short_exit), comment="Close Short")
    strategy.exit("Short", stop = sl_short, comment="Exit Short")

//ONE DIRECTION TRADING COMMAND (BELLOW ONLY ACTIVATE TO CORRECT BUGS)