অলস বিয়ার মোমেন্টাম স্কুইজ কৌশল
ওভারভিউ
কুইন-বার্জ ডায়নামিক এক্সট্রুশন কৌশল হল একটি পরিমাণগত ট্রেডিং কৌশল যা বুলিন-ব্যান্ড, কেল্টনার চ্যানেল এবং ডায়নামিক সূচকগুলিকে একত্রিত করে। এটি বুলিন-ব্যান্ড এবং কেল্টনার চ্যানেল ব্যবহার করে বর্তমান বাজারটি এক্সট্রুশন অবস্থায় রয়েছে কিনা তা নির্ধারণ করে এবং তারপরে ডায়নামিক সূচকগুলির সাথে ট্রেডিং সংকেত তৈরি করে।
এই কৌশলটির প্রধান সুবিধা হল যে এটি স্বয়ংক্রিয়ভাবে ট্রেন্ডিংয়ের সূচনা সনাক্ত করতে পারে এবং গতিশীলতার সূচকগুলির সাথে মিলিত হয়ে প্রবেশের সময় নির্ধারণ করতে পারে। তবে বিভিন্ন জাতের জন্য প্যারামিটার অপ্টিমাইজেশনের প্রয়োজনীয়তাও রয়েছে।
কৌশল নীতি
নীচের তিনটি সূচকের উপর ভিত্তি করে একটি ভালুকের আউটপুট এক্সট্রুশন কৌশল নির্ধারণ করা হয়ঃ
- বোলিংগার ব্যান্ডঃ মধ্যম, উপরের এবং নীচের ট্র্যাকগুলি অন্তর্ভুক্ত করে
- কেল্টনার চ্যানেলঃ মধ্যম, উপরের এবং নিম্ন রেল অন্তর্ভুক্ত
- Momentum Indicator: বর্তমান মূল্য এবং n দিন আগের মূল্যের মধ্যে পার্থক্য
যখন বুলিন বন্ডের ঊর্ধ্বরেখা কেল্টনার চ্যানেলের ঊর্ধ্বরেখার নিচে থাকে এবং বুলিন বন্ডের ঊর্ধ্বরেখা কেল্টনার চ্যানেলের ঊর্ধ্বরেখার নিচে থাকে, তখন আমরা মনে করি যে বাজারটি চাপের মধ্যে রয়েছে। এটি সাধারণত বোঝায় যে বর্তমান প্রবণতাটি শুরু হতে চলেছে।
প্রবেশের সময় নির্ধারণের জন্য, আমরা গতিশীলতার সূচক ব্যবহার করে দামের পরিবর্তনের গতি নির্ধারণ করি। যখন গতিশীলতা তার গড়ের উপরে উঠে যায় তখন একটি ক্রয় সংকেত উত্পন্ন হয়; যখন গতিশীলতা তার গড়ের নীচে পড়ে তখন একটি বিক্রয় সংকেত উত্পন্ন হয়।
কৌশলগত শক্তি বিশ্লেষণ
এর প্রধান সুবিধাগুলি হলঃ
- প্রবণতা কখন শুরু হয় তা স্বয়ংক্রিয়ভাবে সনাক্ত করা এবং প্রারম্ভিক প্রবেশে সহায়তা করা
- ভুল সংকেত এড়ানোর জন্য বিভিন্ন সূচককে একত্রিত করুন
- প্রবণতা এবং বিপরীতমুখী দুই ধরণের লেনদেন
- কাস্টমাইজযোগ্য প্যারামিটার, বিভিন্ন জাতের জন্য অপ্টিমাইজ করা
ঝুঁকি বিশ্লেষণ
কিন্তু এই কৌশলগুলোতে কিছু ঝুঁকিও রয়েছেঃ
- বুলিন বেল্ট এবং কেল্টনার চ্যানেলের মাধ্যমে মিথ্যা সংকেত প্রেরণের সম্ভাবনা বেশি
- গতিশীলতার সূচকগুলি অস্থির, সম্ভবত সেরা প্রবেশের পয়েন্টটি মিস করেছে
- প্যারামিটারগুলি অপ্টিমাইজ করা দরকার, অন্যথায় এটি কার্যকর হবে না
- ট্রেডিং প্রজাতির সাথে সম্পর্কিত প্রভাব
ঝুঁকি কমানোর জন্য, বুলিন বেল্ট এবং কেল্টনার চ্যানেলের দৈর্ঘ্য প্যারামিটারগুলিকে অনুকূলিতকরণ, স্টপ পয়েন্টগুলিকে সমন্বয় করা, আরও বেশি তরলতার সাথে লেনদেনের জাতগুলি বেছে নেওয়া এবং অন্যান্য সূচকগুলির সাথে মিলিতভাবে যাচাইকরণের পরামর্শ দেওয়া হয়।
কৌশল অপ্টিমাইজেশনের দিকনির্দেশনা
এই কৌশলকে আরও শক্তিশালী করার জন্য, নিম্নলিখিত অপ্টিমাইজেশানগুলি করা উচিতঃ
- বিভিন্ন জাত এবং সময়কালের জন্য পরামিতি সমন্বয় পরীক্ষা করা
- বুলিন বেল্ট এবং কেল্টনার খালের দৈর্ঘ্য অনুকূলিতকরণ
- অপ্টিমাইজড গতির সূচক দৈর্ঘ্য
- মাল্টি-হেড এবং খালি-হেডের জন্য আলাদা স্টপ-অফ-লস কৌশল তৈরি করা
- সংকেত যাচাইকরণের জন্য অন্যান্য সূচক যোগ করুন
এই কৌশলটি বহু-পাক্ষিক পরীক্ষার এবং অপ্টিমাইজেশনের মাধ্যমে সফল এবং লাভজনক হতে পারে।
সারসংক্ষেপ
এই কৌশলটি বেশ কয়েকটি সূচককে একত্রিত করে এবং প্রবণতা শুরুর সময়কে কার্যকরভাবে সনাক্ত করতে পারে। তবে এর সাথে কিছু ঝুঁকিও রয়েছে এবং বিভিন্ন ধরণের লেনদেনের জন্য প্যারামিটার অপ্টিমাইজেশনের প্রয়োজন। ক্রমাগত পরীক্ষা এবং অপ্টিমাইজেশনের মাধ্যমে, কৌশলটি একটি কার্যকর অ্যালগরিদমিক ট্রেডিং সিস্টেম হতে পারে।
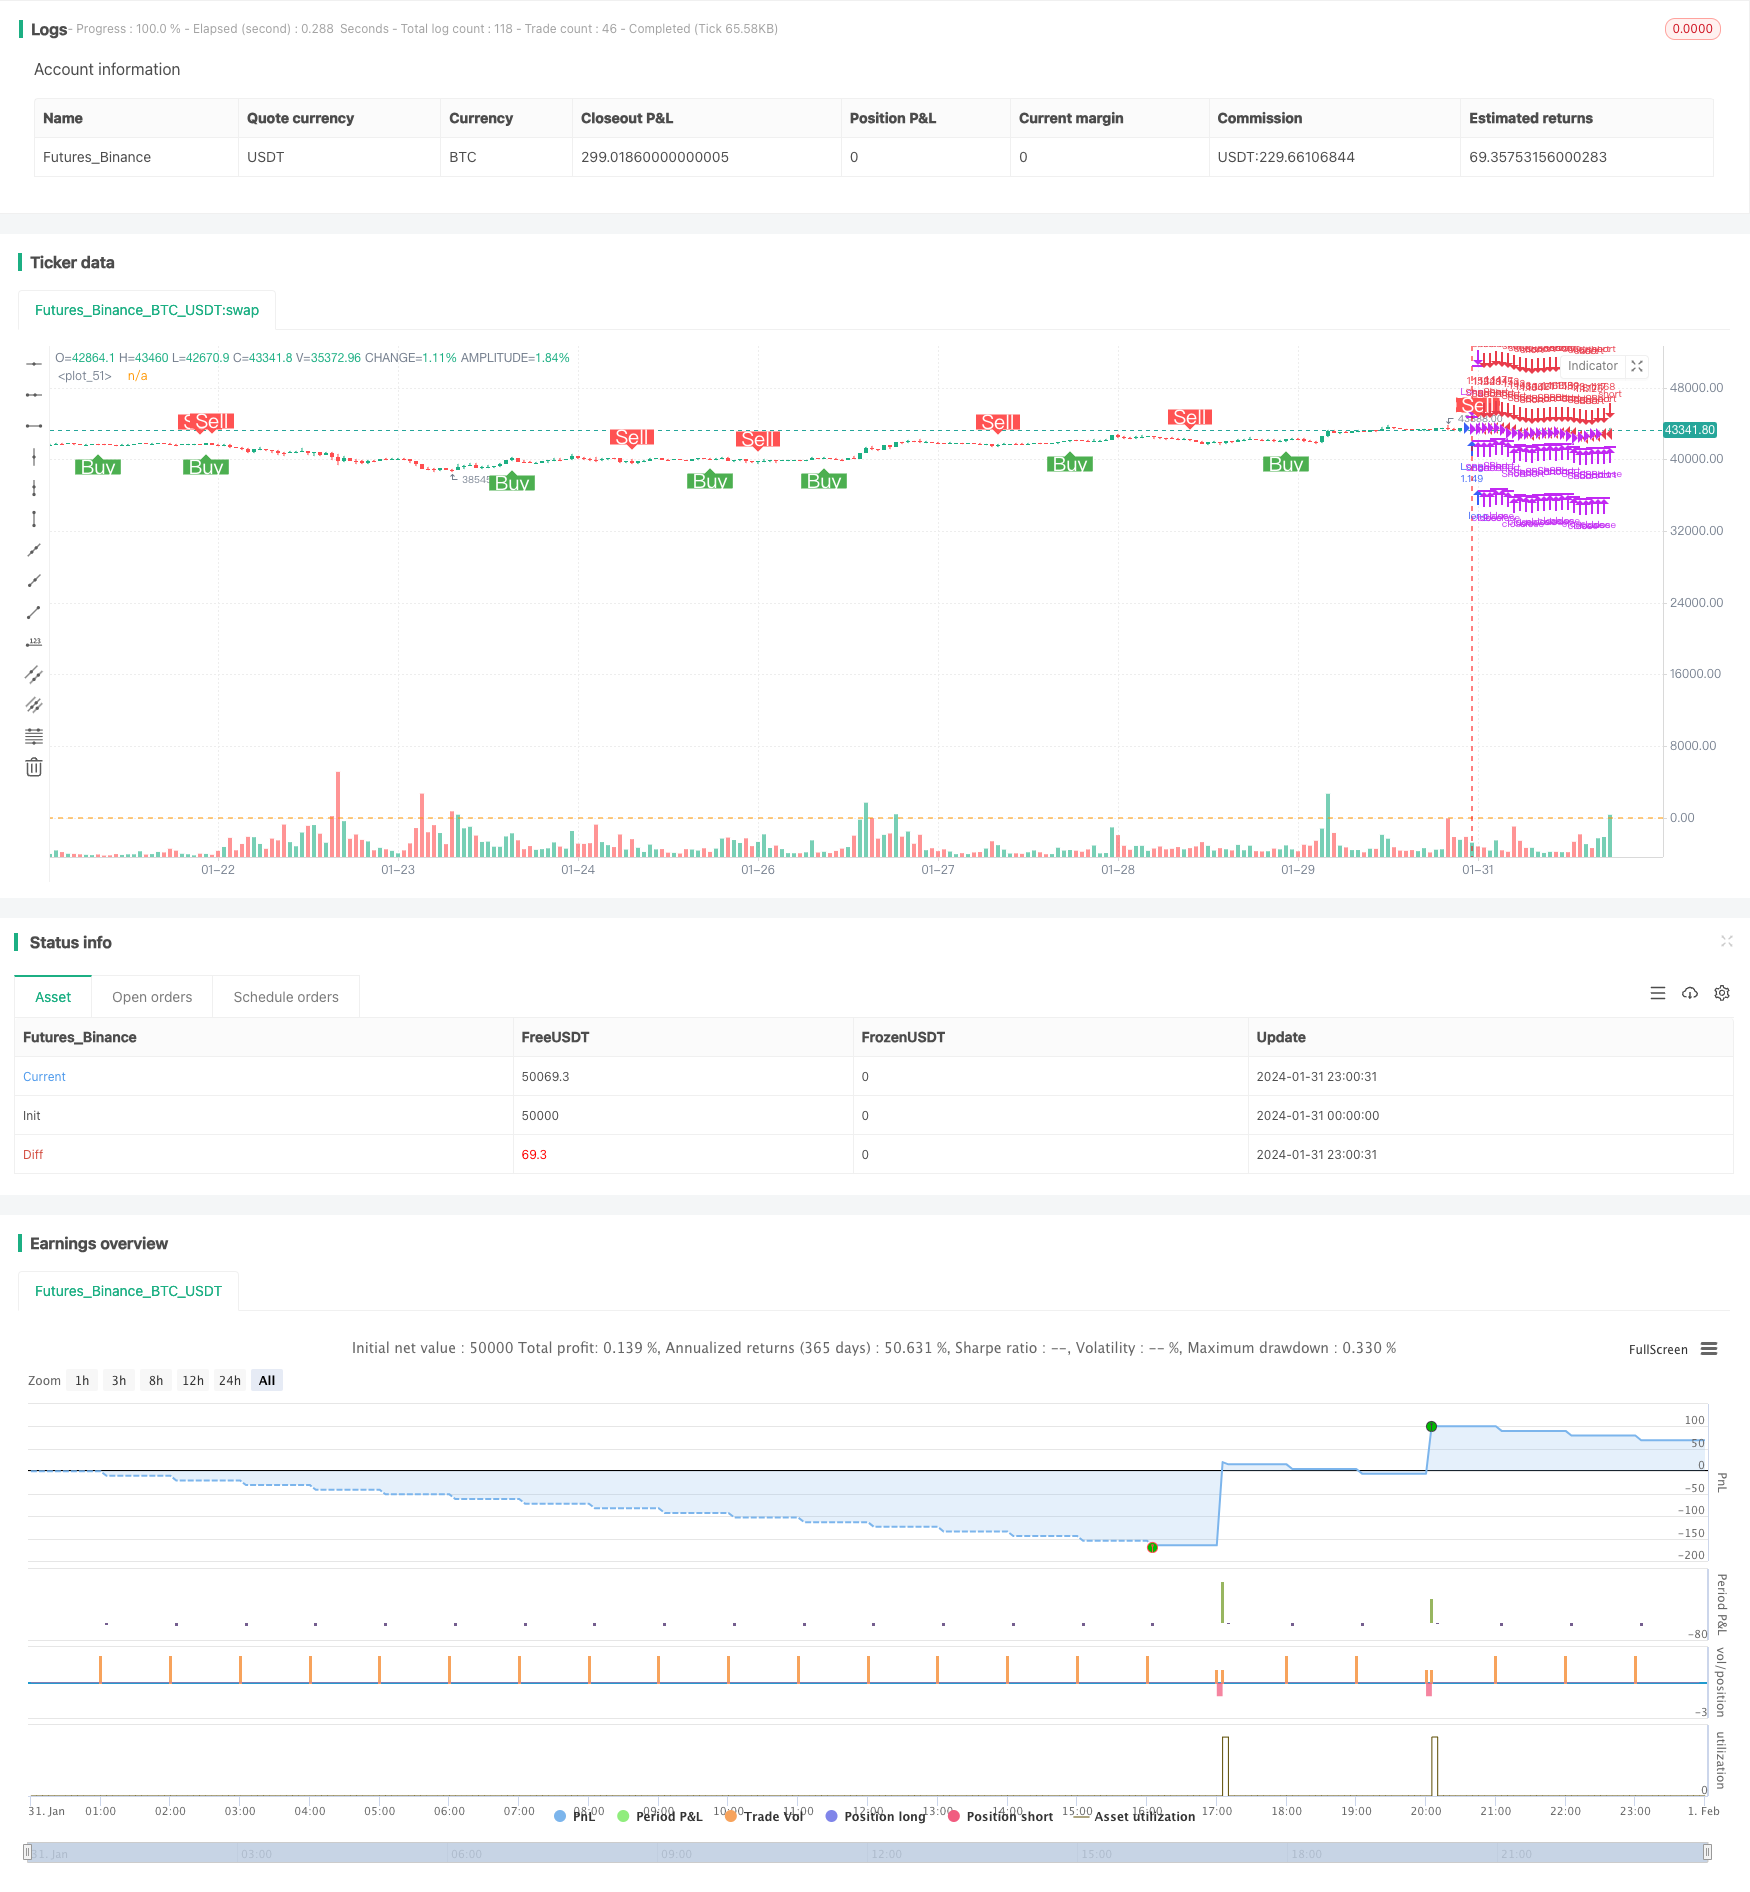
/*backtest
start: 2024-01-31 00:00:00
end: 2024-02-01 00:00:00
period: 1h
basePeriod: 15m
exchanges: [{"eid":"Futures_Binance","currency":"BTC_USDT"}]
*/

//@version=5
// This source code is subject to the terms of the Mozilla Public License 2.0 at https://mozilla.org/MPL/2.0/
// © mtahreemalam original strategy by LazyBear

strategy(title = 'SQM Strategy, TP & SL',
         shorttitle = 'Squeeze.M Strat',
         overlay = true,
         pyramiding = 0,
         default_qty_type = strategy.percent_of_equity,
         default_qty_value = 100,
         initial_capital = 1000,
         commission_type=strategy.commission.percent,
         commission_value=0.0,
         process_orders_on_close=true,
         use_bar_magnifier=true)
//Strategy logic
strategy_logic = input.string("Cross above 0", "Strategy Logic", options = ["LazyBear", "Cross above 0"])

// Date Range
testPeriodSwitch = input(false, "Custom Backtesting Date Range",group="Backtesting Date Range")
i_startTime = input(defval = timestamp("01 Jan 2022 00:01 +0000"), title = "Backtesting Start Time",group="Backtesting Date Range")
i_endTime = input(defval = timestamp("31 Dec 2022 23:59 +0000"), title = "Backtesting End Time",group="Backtesting Date Range")
timeCond = true
isPeriod = testPeriodSwitch == true ? timeCond : true

//// Stoploss and Take Profit Parameters
// Enable Long Strategy
enable_long_strategy = input.bool(true, title='Enable Long Strategy', group='SL/TP For Long Strategy', inline='1')
long_stoploss_value = input.float(defval=5, title='Stoploss %', minval=0.1, group='SL/TP For Long Strategy', inline='2')
long_stoploss_percentage = close * (long_stoploss_value / 100) / syminfo.mintick
long_takeprofit_value = input.float(defval=5, title='Take Profit %', minval=0.1, group='SL/TP For Long Strategy', inline='2')
long_takeprofit_percentage = close * (long_takeprofit_value / 100) / syminfo.mintick

// Enable Short Strategy
enable_short_strategy = input.bool(true, title='Enable Short Strategy', group='SL/TP For Short Strategy', inline='3')
short_stoploss_value = input.float(defval=5, title='Stoploss %', minval=0.1, group='SL/TP For Short Strategy', inline='4')
short_stoploss_percentage = close * (short_stoploss_value / 100) / syminfo.mintick
short_takeprofit_value = input.float(defval=5, title='Take Profit %', minval=0.1, group='SL/TP For Short Strategy', inline='4')
short_takeprofit_percentage = close * (short_takeprofit_value / 100) / syminfo.mintick

//// Inputs
//SQUEEZE MOMENTUM STRATEGY
length = input(20, title='BB Length', group = "Squeeze Momentum Settings")
mult = input(2.0, title='BB MultFactor', group = "Squeeze Momentum Settings")
source = close
lengthKC = input(20, title='KC Length', group = "Squeeze Momentum Settings")
multKC = input(1.5, title='KC MultFactor', group = "Squeeze Momentum Settings")
useTrueRange = input(true, title='Use TrueRange (KC)', group = "Squeeze Momentum Settings")
signalPeriod=input(5, title="Signal Length", group = "Squeeze Momentum Settings")
show_labels_sqm = input(title='Show Buy/Sell SQM Labels', defval=true, group = "Squeeze Momentum Settings")
h0 = hline(0)

// Defining MA
ma = ta.sma(source, length)

// Calculate BB
basis = ma
dev = mult * ta.stdev(source, length)
upperBB = basis + dev
lowerBB = basis - dev

// Calculate KC
range_1 = useTrueRange ? ta.tr : high - low
rangema = ta.sma(range_1, lengthKC)
upperKC = ma + rangema * multKC
lowerKC = ma - rangema * multKC


// SqzON | SqzOFF | noSqz
sqzOn = lowerBB > lowerKC and upperBB < upperKC
sqzOff = lowerBB < lowerKC and upperBB > upperKC
noSqz = sqzOn == false and sqzOff == false

// Momentum
val = ta.linreg(source - math.avg(math.avg(ta.highest(high, lengthKC), ta.lowest(low, lengthKC)), ta.sma(close, lengthKC)), lengthKC, 0)

red_line = ta.sma(val,signalPeriod)
blue_line = val

// lqm = if val > 0
//         if val > nz(val[1])
        // long_sqm_custom
        // if val < nz(val[1])
        // short_sqm_custom
// Plots
//plot(val, style = plot.style_line, title = "blue line", color= color.blue, linewidth=2)
//plot(ta.sma(val,SignalPeriod), style = plot.style_line, title = "red line",color = color.red, linewidth=2)

//plot(val, color=blue, linewidth=2)
//plot(0, color=color.gray, style=plot.style_cross, linewidth=2)
//plot(red_line, color=red, linewidth=2)

//LOGIC
//momentum filter
//filterMom = useMomAverage ? math.abs(val) > MomentumMin / 100000 ? true : false : true
//}

////SQM Long Short Conditions
//Lazy Bear Buy Sell Condition
// long_sqm_lazy = (blue_line>red_line)
// short_sqm_lazy = (blue_line<red_line)

long_sqm_lazy = ta.crossover(blue_line,red_line)
short_sqm_lazy = ta.crossunder(blue_line,red_line)


//Custom Buy Sell Condition
dir_sqm = val < 0 ? -1 : 1
long_sqm_custom = dir_sqm == 1 //and dir_sqm[1] == -1
short_sqm_custom = dir_sqm == -1 //and dir_sqm[1] == 1

long_sqm = strategy_logic == "LazyBear" ? long_sqm_lazy : long_sqm_custom
short_sqm = strategy_logic == "LazyBear" ? short_sqm_lazy : short_sqm_custom


// Plot Stoploss & Take Profit Levels
long_stoploss_price = strategy.position_avg_price * (1 - long_stoploss_value / 100)
long_takeprofit_price = strategy.position_avg_price * (1 + long_takeprofit_value / 100)
short_stoploss_price = strategy.position_avg_price * (1 + short_stoploss_value / 100)
short_takeprofit_price = strategy.position_avg_price * (1 - short_takeprofit_value / 100)
plot(enable_long_strategy and not enable_short_strategy ? long_stoploss_percentage : na, color=color.red, style=plot.style_linebr, linewidth=2, title='Long SL Level')
plot(enable_long_strategy and not enable_short_strategy ? long_takeprofit_percentage : na, color=color.green, style=plot.style_linebr, linewidth=2, title='Long TP Level')
plot(enable_short_strategy and not enable_long_strategy ? short_stoploss_price : na, color=color.red, style=plot.style_linebr, linewidth=2, title='Short SL Level')
plot(enable_short_strategy and not enable_long_strategy ? short_takeprofit_price : na, color=color.green, style=plot.style_linebr, linewidth=2, title='Short TP Level')


// Long Strategy
if long_sqm and enable_long_strategy == true
    strategy.entry('Long', strategy.long)
    strategy.exit('Long  SL/TP', from_entry='Long', loss=long_stoploss_percentage, profit=long_takeprofit_percentage)
    strategy.close('Long', comment = "L. CL")

// Short Strategy
if short_sqm and enable_short_strategy == true
    strategy.entry('Short', strategy.short)
    strategy.exit('Short SL/TP', from_entry='Short', loss=short_stoploss_percentage, profit=short_takeprofit_percentage)
    strategy.close('Short', comment = "S.Cl")

plot_sqm_long = long_sqm and not long_sqm[1]
plot_sqm_short = short_sqm and not short_sqm[1]

plotshape(plot_sqm_long and show_labels_sqm, title='Buy', style=shape.labelup, location=location.belowbar, size=size.normal, text='Buy', textcolor=color.new(color.white, 0), color=color.new(color.green, 0))
plotshape(plot_sqm_short and show_labels_sqm, title='Sell', style=shape.labeldown, location=location.abovebar, size=size.normal, text='Sell', textcolor=color.new(color.white, 0), color=color.new(color.red, 0))

// Date Range EXIT
if (not isPeriod)
    strategy.cancel_all()
    strategy.close_all()