ডুয়াল রেঞ্জ ফিল্টার ট্রেন্ড অনুসরণ কৌশল
ওভারভিউ
ডাবল রেঞ্জ ফিল্টার ট্রেন্ড ট্র্যাকিং কৌশল হল একটি পরিমাণযুক্ত ট্রেডিং কৌশল যা ডাবল ইএমএ রেঞ্জ ফিল্টার ব্যবহার করে ট্রেন্ডের দিকনির্দেশনা সনাক্ত করতে এবং ট্রেন্ডটি অনুসরণ করে। এই কৌশলটি ডাবল ইকুয়ালাইন ফিল্টার এবং এটিআর রেঞ্জ গণনার সাথে মিলিত হয়, যা কার্যকরভাবে মাঝারি এবং দীর্ঘ লাইন ট্রেন্ডের দিকনির্দেশনা সনাক্ত করতে পারে এবং স্টপ লস ট্র্যাকিং ব্যবহার করে মুনাফা লক করতে পারে।
কৌশল নীতি
এই কৌশলটির মূল অংশ হল ডাবল ইএমএ রেঞ্জ ফিল্টারিং। এটি কে লাইনের এটিআর রেঞ্জ গণনা করে এবং মসৃণ করে, এবং তারপরে দুটি ইএমএকে একত্রিত করে যেখানে কে লাইনটি রেঞ্জের মধ্যে অবস্থিত তা নির্ধারণ করে যে এটি বর্তমানে ট্রেন্ডের মধ্যে রয়েছে কিনা। যখন দামটি রেঞ্জটি ভেঙে যায় তখন এটি নির্দেশ করে যে প্রবণতাটি পরিবর্তিত হয়েছে।
বিশেষত, কৌশলটি প্রথমে কে লাইনের এটিআর পরিসরের আকার গণনা করে এবং তারপরে দুটি ইএমএর সাথে মিলিত হয় যাতে এটি মসৃণ হয়। এটিআর পরিসীমা কে লাইনের স্বাভাবিক ওঠানামা অঞ্চলকে উপস্থাপন করে। যখন দামগুলি এই পরিসরের বাইরে চলে যায়, তখন ট্রেন্ডের পরিবর্তন হয়। কৌশলটি ইএমএ পরিসীমাটি ভেঙে যাওয়ার দিকটি রেকর্ড করে। যখন দিকটি পরিবর্তিত হয়, তখন ট্রেন্ডের বিপরীতকরণ নির্দেশ করে, তখন প্রবেশের বিকল্প থাকে।
প্রবেশের পরে, কৌশলটি মুনাফা লক করার জন্য ফ্লোটিং স্টপ ব্যবহার করে। পজিশনের সময়, এটি রিয়েল-টাইমে সিদ্ধান্ত নেবে যে কে লাইনটি প্রান্তের বাইরে ফিরে এসেছে কিনা এবং যদি এটি ফিরে আসে তবে বর্তমান অবস্থান থেকে বেরিয়ে আসে। এটি কার্যকরভাবে ট্রেন্ডিং ট্রেডিংয়ের মুনাফা লক করতে পারে।
সামর্থ্য বিশ্লেষণ
দ্বৈত পরিসীমা ফিল্টারিং প্রবণতা ট্র্যাকিং কৌশল সমান্তরাল ফিল্টারিং এবং পরিসীমা গণনার সুবিধাগুলি একত্রিত করে, যা প্রবণতার দিকনির্দেশকে সঠিকভাবে নির্ধারণ করতে পারে এবং ঘন ঘন ঘন ঘন ঘন ঘন ঘন ঘন ঘন ঘন ঘন ঘন ঘন ঘন ঘন ঘন ঘন ঘন ঘন ঘন ঘন ঘন ঘন ঘন ঘন ঘন ঘন ঘন ঘন ঘন ঘন ঘন ঘন ঘন ঘন ঘন ঘন ঘন ঘন ঘন ঘন ঘন ঘন ঘন ঘন ঘন ঘন ঘন ঘন ঘন ঘন ঘন ঘন ঘন ঘন ঘন ঘন ঘন ঘন ঘন ঘন ঘন ঘন ঘন ঘন ঘন ঘন ঘন ঘন ঘন ঘন ঘন ঘন ঘন ঘন ঘন ঘন ঘন ঘন ঘন ঘন ঘন ঘন ঘন ঘন ঘন ঘন ঘন ঘন ঘন ঘন ঘন ঘন ঘন ঘন ঘন ঘন ঘন ঘ
- এটিআর নীতি ব্যবহার করে কে-লাইন ওঠানামার পরিধি নির্ধারণ করুন এবং বাজারের অস্থিরতার মধ্যে অনির্দেশ্য প্রবেশ এড়িয়ে চলুন
- ডাবল ইএমএ ফিল্টারগুলি সঠিকতা বাড়ায় এবং মিথ্যা সংকেত হ্রাস করে
- রিয়েল-টাইম ফ্লোটিং স্টপ, যা ট্রেন্ডিং লাভকে কার্যকরভাবে লক করে
- কৌশলগত লজিক সহজ, স্পষ্ট, সহজে বোঝা যায় এবং অপ্টিমাইজ করা যায়
ঝুঁকি বিশ্লেষণ
এই কৌশলটির কিছু ঝুঁকিও রয়েছে, যা নিম্নলিখিত দিকগুলিতে কেন্দ্রীভূতঃ
- বড় আকারের উড়োজাহাজ ATR পরিসীমা অতিক্রম করতে পারে, যার ফলে অগ্রিম প্রবেশ করা যায়
- শক্তিশালী প্রবণতা চলাকালীন, স্টপ লস খুব তাড়াতাড়ি ট্রিগার হতে পারে
- ভুল প্যারামিটার সেট করাও পলিসির পারফরম্যান্সকে প্রভাবিত করে
এই ঝুঁকিগুলিকে যথাযথ অপ্টিমাইজেশান প্যারামিটার, মিথ্যা ব্রেকিং প্রতিরোধ এবং প্রবণতার শক্তি নির্ণয়ের মাধ্যমে মোকাবেলা করা যেতে পারে।
অপ্টিমাইজেশান পরামর্শ
ডাবল-স্পেস ফিল্টারিং ট্রেন্ড ট্র্যাকিং কৌশলটি আরও অপ্টিমাইজেশনের সম্ভাবনা রয়েছে, প্রধান অপ্টিমাইজেশনের দিকগুলি হলঃ
- ATR প্যারামিটার অপ্টিমাইজ করুন, K-লাইন ওভারল্যাপ সমতল করুন
- ট্রেডিং ভলিউম ইন্ডিকেটরের সাথে মিথ্যে ব্রেকডাউন এড়ানো
- প্রবণতার তীব্রতা নির্ণয় করুন, একক বিপর্যয় এবং টেকসই প্রবণতা মধ্যে পার্থক্য করুন
- স্টপ লস পয়েন্ট অপ্টিমাইজ করুন, লভ্যাংশ নিশ্চিত করার জন্য লম্বা ট্রেন্ড অনুসরণ করুন
এই অপ্টিমাইজেশনের মাধ্যমে, কৌশলগুলিকে আরও বেশি বাজারের পরিবেশে স্থিতিশীল উপার্জন করতে পারে।
সারসংক্ষেপ
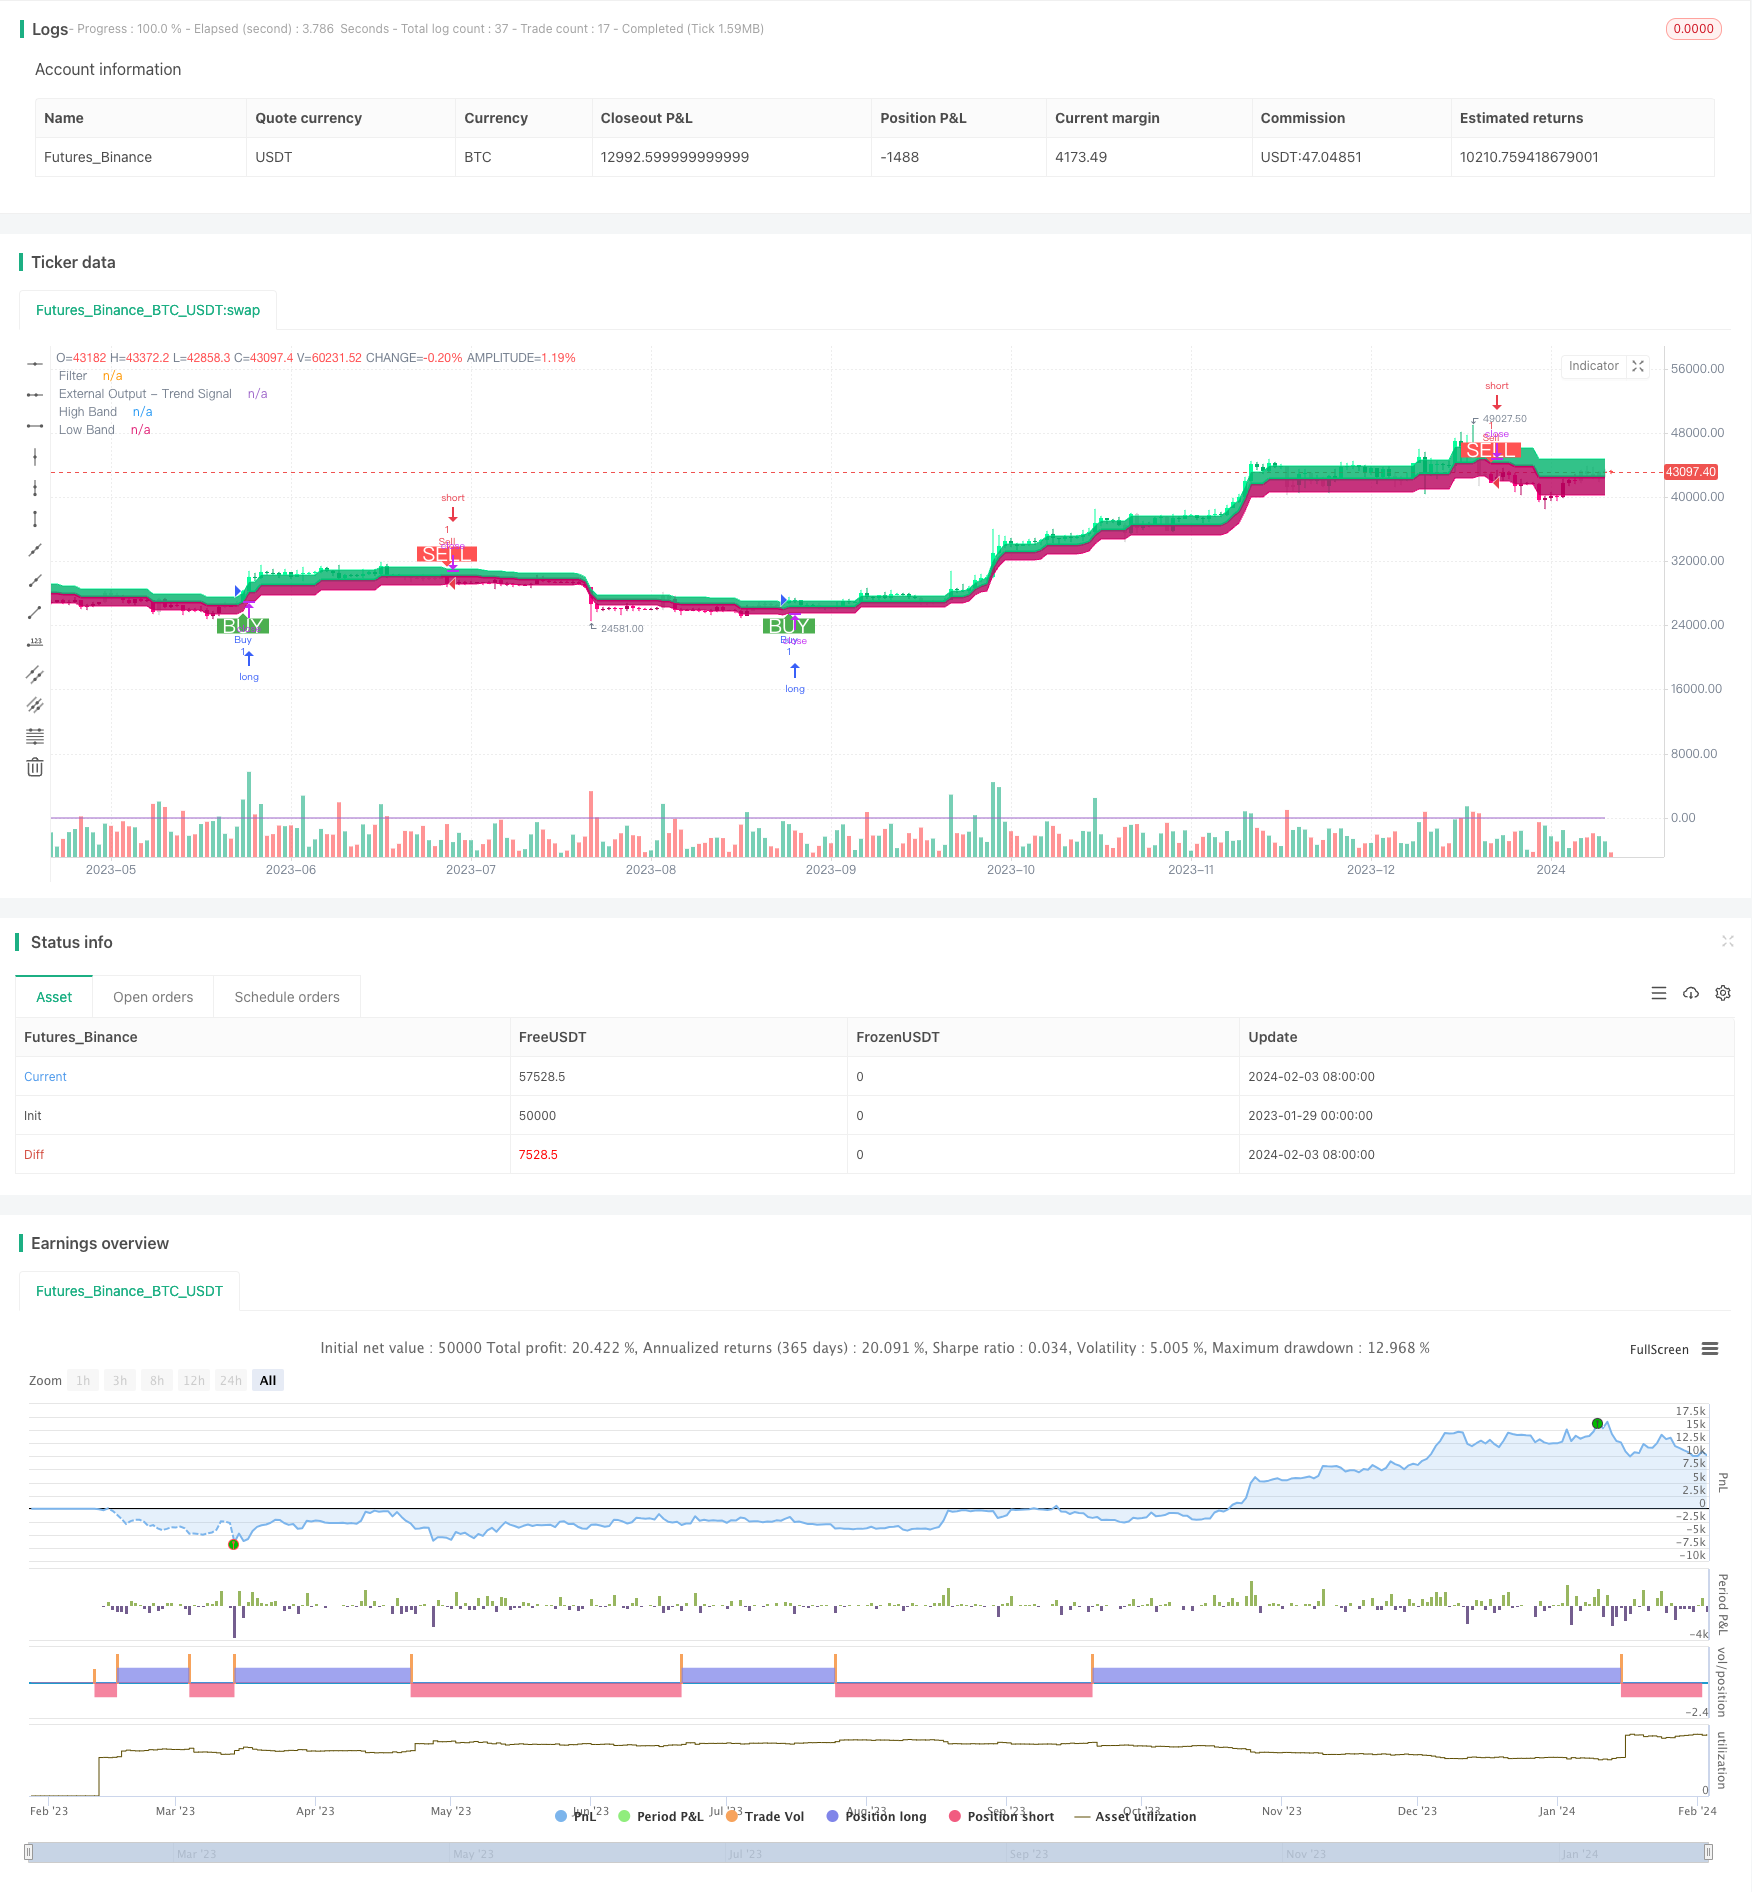
দ্বৈত পরিসীমা ফিল্টারিং ট্রেন্ড ট্র্যাকিং কৌশলটি মিডল লাইন ফিল্টারিং এবং এটিআর পরিসীমা বিচারের বিভিন্ন সুবিধার সমন্বয় করে, কার্যকরভাবে মধ্য-লং লাইনের টেকসই প্রবণতার দিক এবং প্রবেশের সময়কে সনাক্ত করতে পারে। এটি কেবলমাত্র প্রবণতা পরিবর্তনের সময় মাঠে প্রবেশ করে এবং লাভের জন্য লকিংয়ের জন্য ভাসমান স্টপ ব্যবহার করে। এই কৌশলটির যুক্তিটি সহজ এবং পরিষ্কার এবং মধ্য-লং লাইনের ট্রেন্ড ট্রেডিংয়ের জন্য উপযুক্ত। প্যারামিটার এবং বিচারের নিয়মগুলিকে ক্রমাগত অপ্টিমাইজ করে এই কৌশলটি একাধিক বাজারে আরও ভাল আয় করতে পারে।
/*backtest
start: 2023-01-29 00:00:00
end: 2024-02-04 00:00:00
period: 1d
basePeriod: 1h
exchanges: [{"eid":"Futures_Binance","currency":"BTC_USDT"}]
*/

//@version=4
strategy("Range Filter [DW] & Labels", shorttitle="RF [DW] & Labels", overlay=true)

//Conditional Sampling EMA Function
Cond_EMA(x, cond, n)=>
    var val     = array.new_float(0)
    var ema_val = array.new_float(1)
    if cond
        array.push(val, x)
        if array.size(val) > 1
            array.remove(val, 0)
        if na(array.get(ema_val, 0))
            array.fill(ema_val, array.get(val, 0))
        array.set(ema_val, 0, (array.get(val, 0) - array.get(ema_val, 0))*(2/(n + 1)) + array.get(ema_val, 0))
    EMA = array.get(ema_val, 0)
    EMA

//Conditional Sampling SMA Function
Cond_SMA(x, cond, n)=>
    var vals = array.new_float(0)
    if cond
        array.push(vals, x)
        if array.size(vals) > n
            array.remove(vals, 0)
    SMA = array.avg(vals)
    SMA

//Standard Deviation Function
Stdev(x, n)=>
    sqrt(Cond_SMA(pow(x, 2), 1, n) - pow(Cond_SMA(x, 1, n), 2))

//Range Size Function
rng_size(x, scale, qty, n)=>
    ATR      = Cond_EMA(tr(true), 1, n)
    AC       = Cond_EMA(abs(x - x[1]), 1, n)
    SD       = Stdev(x, n)
    rng_size = scale=="Pips" ? qty*0.0001 : scale=="Points" ? qty*syminfo.pointvalue : scale=="% of Price" ? close*qty/100 : scale=="ATR" ? qty*ATR :
               scale=="Average Change" ? qty*AC : scale=="Standard Deviation" ? qty*SD : scale=="Ticks" ? qty*syminfo.mintick : qty

//Two Type Range Filter Function
rng_filt(h, l, rng_, n, type, smooth, sn, av_rf, av_n)=>
    rng_smooth = Cond_EMA(rng_, 1, sn)
    r          = smooth ? rng_smooth : rng_
    var rfilt  = array.new_float(2, (h + l)/2)
    array.set(rfilt, 1, array.get(rfilt, 0))
    if type=="Type 1"
        if h - r > array.get(rfilt, 1)
            array.set(rfilt, 0, h - r)
        if l + r < array.get(rfilt, 1)
            array.set(rfilt, 0, l + r)
    if type=="Type 2"
        if h >= array.get(rfilt, 1) + r
            array.set(rfilt, 0, array.get(rfilt, 1) + floor(abs(h - array.get(rfilt, 1))/r)*r)
        if l <= array.get(rfilt, 1) - r
            array.set(rfilt, 0, array.get(rfilt, 1) - floor(abs(l - array.get(rfilt, 1))/r)*r)
    rng_filt1 = array.get(rfilt, 0)
    hi_band1  = rng_filt1 + r
    lo_band1  = rng_filt1 - r
    rng_filt2 = Cond_EMA(rng_filt1, rng_filt1 != rng_filt1[1], av_n)
    hi_band2  = Cond_EMA(hi_band1, rng_filt1 != rng_filt1[1], av_n)
    lo_band2  = Cond_EMA(lo_band1, rng_filt1 != rng_filt1[1], av_n)
    rng_filt  = av_rf ? rng_filt2 : rng_filt1
    hi_band   = av_rf ? hi_band2 : hi_band1
    lo_band   = av_rf ? lo_band2 : lo_band1
    [hi_band, lo_band, rng_filt]

//-----------------------------------------------------------------------------------------------------------------------------------------------------------------
//Inputs
//-----------------------------------------------------------------------------------------------------------------------------------------------------------------

//Filter Type
f_type = input(defval="Type 1", options=["Type 1", "Type 2"], title="Filter Type")

//Movement Source
mov_src = input(defval="Close", options=["Wicks", "Close"], title="Movement Source")

//Range Size Inputs
rng_qty   = input(defval=2.618, minval=0.0000001, title="Range Size")
rng_scale = input(defval="Average Change", options=["Points", "Pips", "Ticks", "% of Price", "ATR", "Average Change", "Standard Deviation", "Absolute"], title="Range Scale")

//Range Period
rng_per = input(defval=14, minval=1, title="Range Period (for ATR, Average Change, and Standard Deviation)")

//Range Smoothing Inputs
smooth_range = input(defval=true, title="Smooth Range")
smooth_per   = input(defval=27, minval=1, title="Smoothing Period")

//Filter Value Averaging Inputs
av_vals    = input(defval=true, title="Average Filter Changes")
av_samples = input(defval=2, minval=1, title="Number Of Changes To Average")

// New inputs for take profit and stop loss
take_profit_percent = input(defval=100.0, minval=0.1, maxval=1000.0, title="Take Profit Percentage", step=0.1)
stop_loss_percent = input(defval=100, minval=0.1, maxval=1000.0, title="Stop Loss Percentage", step=0.1)

//-----------------------------------------------------------------------------------------------------------------------------------------------------------------
//Definitions
//-----------------------------------------------------------------------------------------------------------------------------------------------------------------

//High And Low Values
h_val = mov_src=="Wicks" ? high : close
l_val = mov_src=="Wicks" ? low : close

//Range Filter Values
[h_band, l_band, filt] = rng_filt(h_val, l_val, rng_size((h_val + l_val)/2, rng_scale, rng_qty, rng_per), rng_per, f_type, smooth_range, smooth_per, av_vals, av_samples)

//Direction Conditions
var fdir = 0.0
fdir    := filt > filt[1] ? 1 : filt < filt[1] ? -1 : fdir
upward   = fdir==1 ? 1 : 0
downward = fdir==-1 ? 1 : 0

//Colors
filt_color = upward ? #05ff9b : downward ? #ff0583 : #cccccc
bar_color  = upward and (close > filt) ? (close > close[1] ? #05ff9b : #00b36b) :
             downward and (close < filt) ? (close < close[1] ? #ff0583 : #b8005d) : #cccccc

//-----------------------------------------------------------------------------------------------------------------------------------------------------------------
//Outputs
//-----------------------------------------------------------------------------------------------------------------------------------------------------------------

//Filter Plot
filt_plot = plot(filt, color=filt_color, transp=0, linewidth=3,  title="Filter")

//Band Plots
h_band_plot = plot(h_band, color=#05ff9b, transp=100, title="High Band")
l_band_plot = plot(l_band, color=#ff0583, transp=100, title="Low Band")

//Band Fills
fill(h_band_plot, filt_plot, color=#00b36b, transp=85, title="High Band Fill")
fill(l_band_plot, filt_plot, color=#b8005d, transp=85, title="Low Band Fill")

//Bar Color
barcolor(bar_color)

//External Trend Output
plot(fdir, transp=100, editable=false, display=display.none, title="External Output - Trend Signal")

// Trading Conditions Logic
longCond = close > filt and close > close[1] and upward > 0 or close > filt and close < close[1] and upward > 0
shortCond = close < filt and close < close[1] and downward > 0 or close < filt and close > close[1] and downward > 0

CondIni = 0
CondIni := longCond ? 1 : shortCond ? -1 : CondIni[1]
longCondition = longCond and CondIni[1] == -1
shortCondition = shortCond and CondIni[1] == 1

// Strategy Entry and Exit
strategy.entry("Buy", strategy.long, when = longCondition)
strategy.entry("Sell", strategy.short, when = shortCondition)

// New: Close conditions based on percentage change
long_take_profit_condition = close > strategy.position_avg_price * (1 + take_profit_percent / 100)
short_take_profit_condition = close < strategy.position_avg_price * (1 - take_profit_percent / 100)

long_stop_loss_condition = close < strategy.position_avg_price * (1 - stop_loss_percent / 100)
short_stop_loss_condition = close > strategy.position_avg_price * (1 + stop_loss_percent / 100)

strategy.close("Buy", when = shortCondition or long_take_profit_condition or long_stop_loss_condition)
strategy.close("Sell", when = longCondition or short_take_profit_condition or short_stop_loss_condition)

// Plot Buy and Sell Labels
plotshape(longCondition, title = "Buy Signal", text ="BUY", textcolor = color.white, style=shape.labelup, size = size.normal, location=location.belowbar, color = color.green, transp = 0)
plotshape(shortCondition, title = "Sell Signal", text ="SELL", textcolor = color.white, style=shape.labeldown, size = size.normal, location=location.abovebar, color = color.red, transp = 0)

// Alerts
alertcondition(longCondition, title="Buy Alert", message = "BUY")
alertcondition(shortCondition, title="Sell Alert", message = "SELL")