ডায়নামিক স্লোপ ট্রেন্ডলাইন ট্রেডিং কৌশল
ওভারভিউ
এই কৌশলটির মূল ধারণাগুলি হ’ল গতিশীল স্লাইডিং ব্যবহার করে মূল্যের প্রবণতার দিক নির্ধারণ করা এবং বিরতি নির্ধারণের সাথে ট্রেডিং সংকেত তৈরি করা। বিশেষত, এটি রিয়েল-টাইমে নতুন উচ্চতা এবং নতুন নিম্নের উপর নজর রাখে, বিভিন্ন সময়ের মধ্যে দামের পরিবর্তনের উপর ভিত্তি করে গতিশীল স্লাইডিং গণনা করে এবং তারপরে প্রবণতা লাইনের সাথে দামের বিরতি নির্ধারণ করে।
কৌশল নীতি
এই কৌশলটি মূলত নিম্নলিখিত ধাপে বিভক্তঃ
সর্বোচ্চ এবং সর্বনিম্ন মূল্য নির্ধারণঃ একটি নির্দিষ্ট সময়ের মধ্যে সর্বোচ্চ এবং সর্বনিম্ন মূল্য ট্র্যাক করুন (যেমন 20 কে লাইন) এবং সিদ্ধান্ত নিন যে এটি একটি উদ্ভাবনী উচ্চ বা নতুন নিম্ন
গতিশীল স্লাইড গণনা করুনঃ নতুন উদ্ভাবনী উচ্চ বা নতুন নিম্নের K লাইন নম্বরগুলি রেকর্ড করুন, একটি নির্দিষ্ট সময়ের পরে উদ্ভাবনী উচ্চ-নিম্ন থেকে উচ্চ-নিম্নের গতিশীল স্লাইড গণনা করুন (যেমন 9 টি K লাইন)
ট্রেন্ড লাইন আঁকুনঃ গতিশীল ঢালুতা অনুযায়ী, একটি উত্থান এবং পতনের ট্রেন্ড লাইন আঁকুন
প্রবণতা লাইন প্রসারিত এবং আপডেট করুনঃ প্রবণতা লাইন প্রসারিত এবং আপডেট করা হয় যখন মূল্য প্রবণতা লাইন অতিক্রম করে
লেনদেনের সংকেতঃ প্রবণতা রেখার সাথে দামের বিরতি, ওভার এবং ডাউন সংকেত
কৌশলগত সুবিধা
এই কৌশলটির সুবিধাগুলো হলঃ
গতিশীলতা, প্রবণতার দিকনির্দেশনা, বাজার পরিবর্তনের সাথে নমনীয়ভাবে মোকাবিলা করা
স্টপ লস, রিটার্নিং এবং রিডাকশনের উপর যুক্তিসঙ্গত নিয়ন্ত্রণ
ট্রেডিং সিগন্যালের মাধ্যমে ট্রেডিং করা সহজ
কাস্টমাইজযোগ্য প্যারামিটার, অভিযোজিত
কোডের কাঠামো পরিষ্কার, সহজে বোঝা এবং পুনর্ব্যবহারযোগ্য
ঝুঁকি ও সমাধান
এই কৌশলটির কিছু ঝুঁকিও রয়েছেঃ
প্রবণতা ঝাঁকুনির সময়, ফিল্টার শর্ত যুক্ত করার পরামর্শ দেওয়া হয়
ব্রেকিং ফালস সিগন্যালের সম্ভাবনা বেশি, প্যারামিটারগুলি যথাযথভাবে সামঞ্জস্য করা বা ফিল্টার শর্ত যুক্ত করা যেতে পারে
স্টপ লস রিস্ক, যা পরিস্থিতির তীব্র পরিবর্তন হলে স্টপ লস বাড়িয়ে দেয়
সংক্ষিপ্ত ট্রেডিংয়ের জন্য সীমিত স্থান এবং লাভজনকতা
অপ্টিমাইজেশান দিক
এই নীতিমালার উন্নতি করতে পারে এমন জায়গাগুলি হলঃ
ফিল্টারিং সিগন্যালের জন্য আরও প্রযুক্তিগত নির্দেশক যোগ করুন
প্যারামিটার সমন্বয় অপ্টিমাইজ করুন, সর্বোত্তম প্যারামিটার খুঁজুন
“আমি মনে করি, এটা আমাদের জন্য অনেক বড় একটা অর্জন।
স্বয়ংক্রিয়ভাবে প্রবেশাধিকার সামঞ্জস্য করার জন্য যোগ করা হয়েছে
অন্যান্য কৌশলগুলির সাথে সমন্বয় করে আরও বেশি সুযোগের সন্ধান করুন
সারসংক্ষেপ
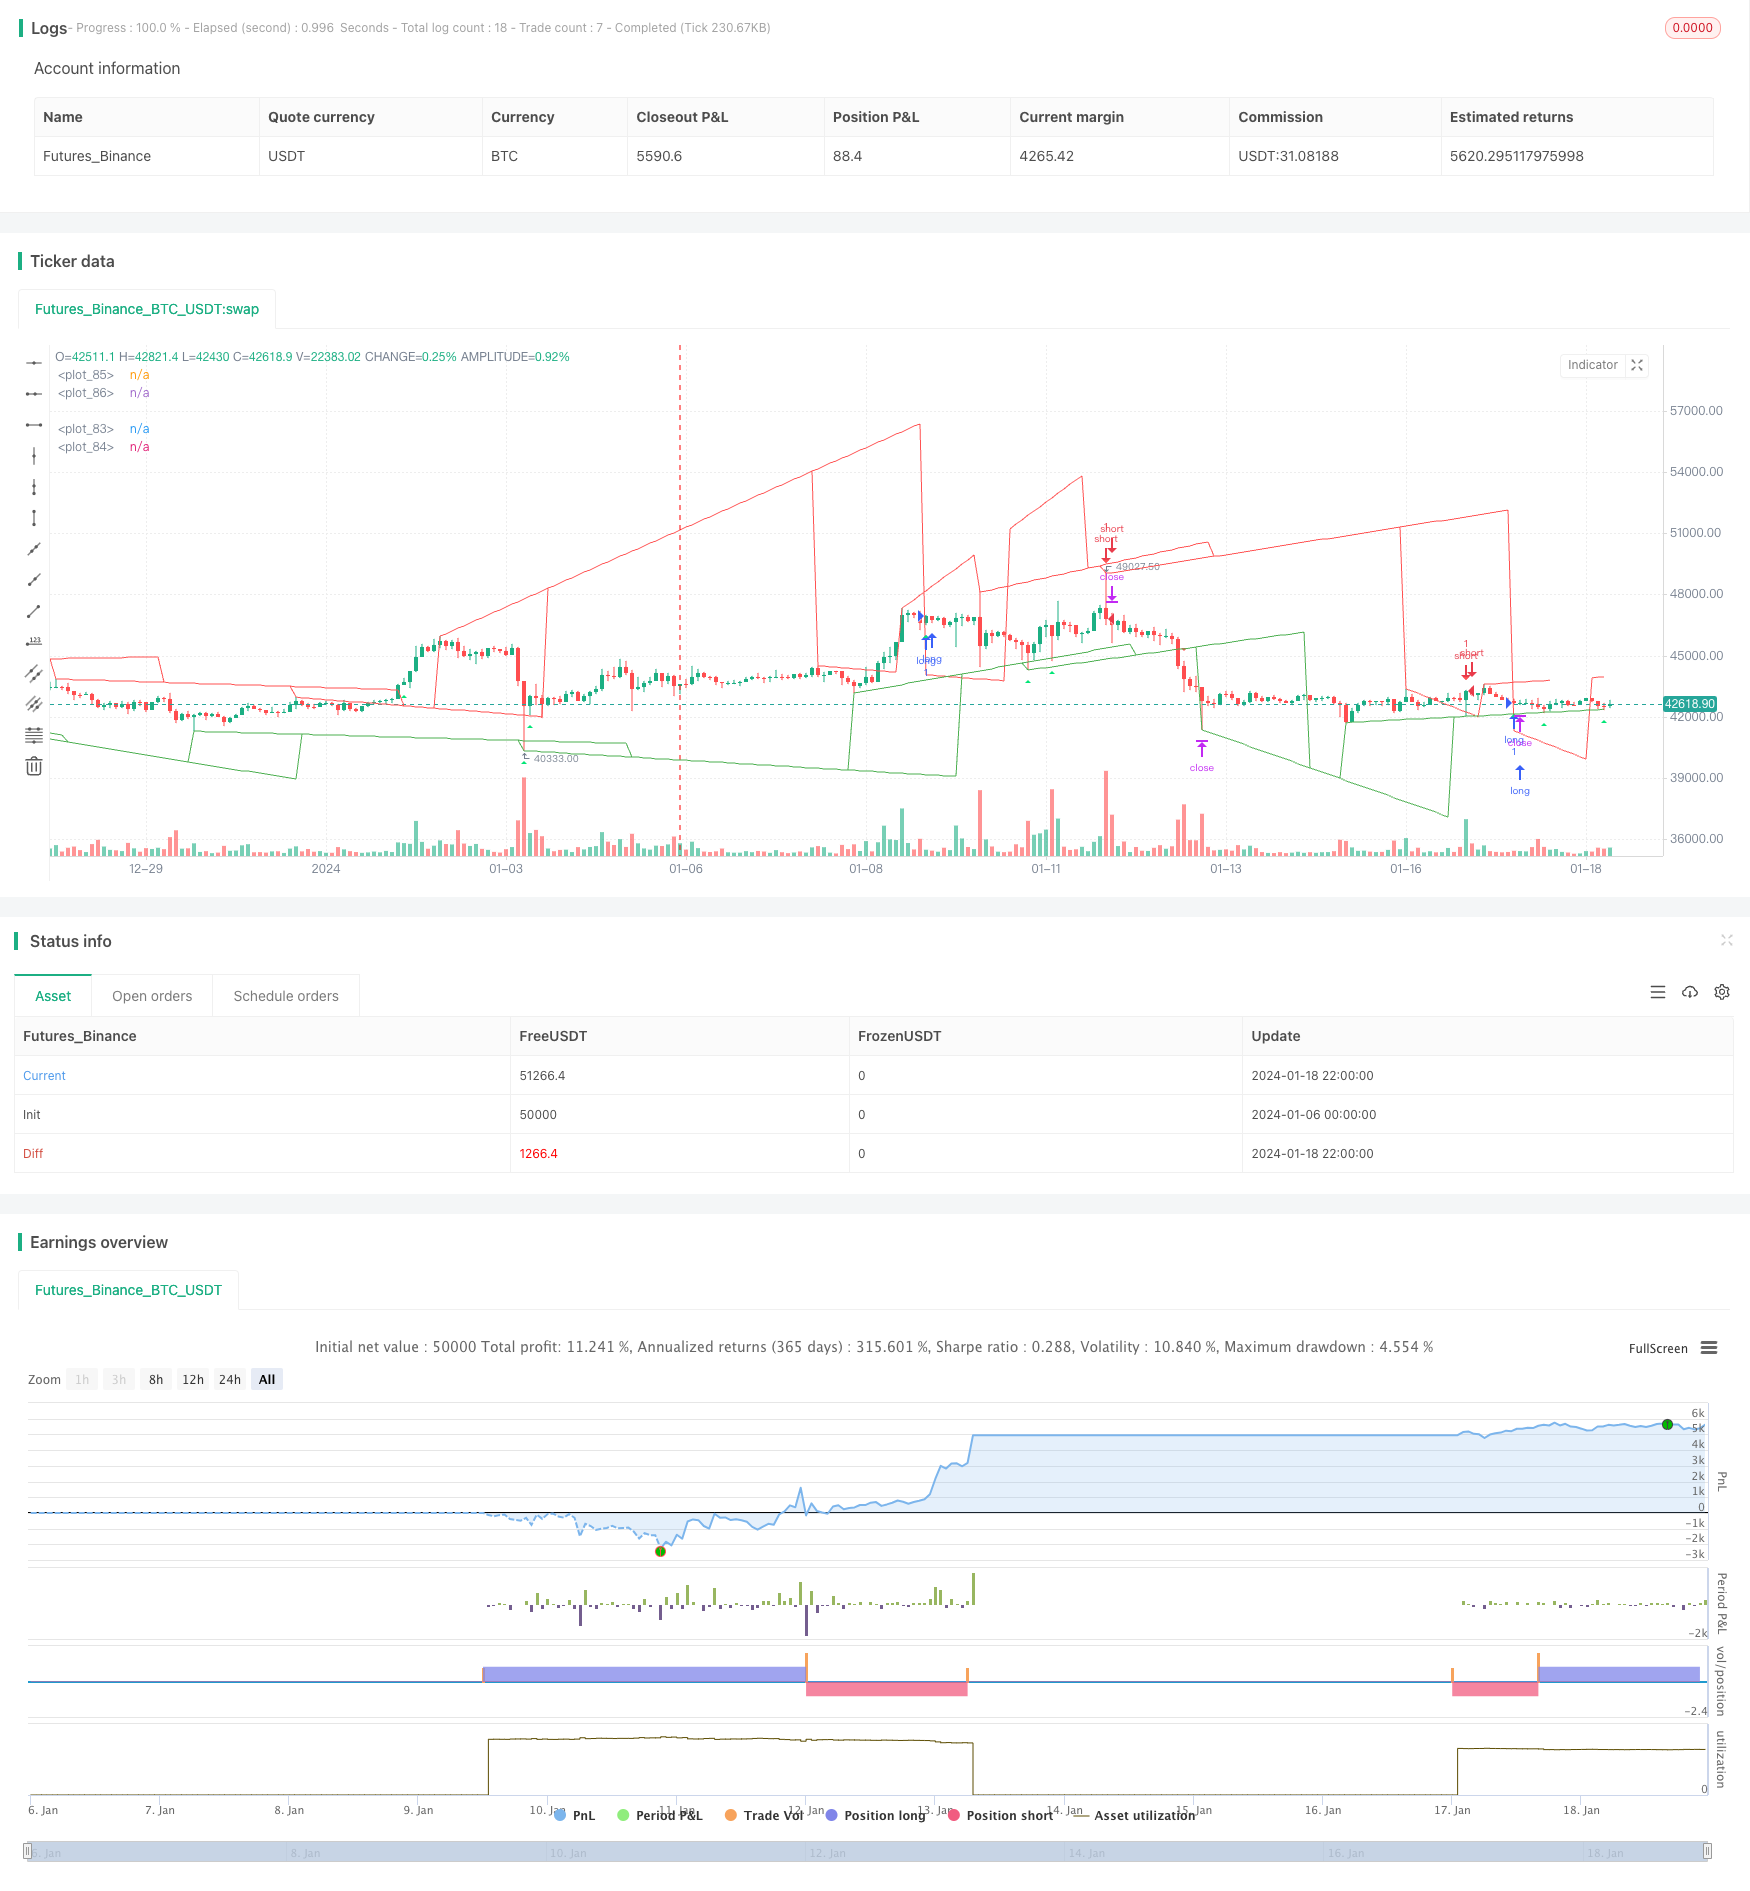
এই কৌশলটি সামগ্রিকভাবে একটি উচ্চ কার্যকর শর্ট লাইন কৌশল যা গতিশীল প্রান্তিকতার উপর ভিত্তি করে প্রবণতা নির্ধারণ করে এবং লেনদেনকে ভেঙে দেয়। এটি সঠিক, ঝুঁকি নিয়ন্ত্রণযোগ্য এবং বাজারে শর্ট লাইন সুযোগ ক্যাপচার করার জন্য উপযুক্ত। প্যারামিটারগুলি আরও অনুকূলিতকরণ এবং ফিল্টার শর্তগুলি যুক্ত করে কৌশলটির বিজয়ীতা এবং মুনাফা স্তর বাড়ানো যেতে পারে।
/*backtest
start: 2024-01-06 00:00:00
end: 2024-01-19 00:00:00
period: 2h
basePeriod: 15m
exchanges: [{"eid":"Futures_Binance","currency":"BTC_USDT"}]
*/

// This source code is subject to the terms of the Mozilla Public License 2.0 at https://mozilla.org/MPL/2.0/
// © pune3tghai

//Originally posted by matsu_bitmex

//tried adding alerts on plots and cleared the chart for a cleaner view.
//Publishing the script in hope of getting it improved by someone else.

//Added strategy code for easier calculations

//Needs work on TP and SL part.

//P.S - THE ORIGINAL CODE IS MUCH BETTER BUT I have tried to be more usable and understandable.

//@version=4
strategy("TrendLines with Alerts", overlay=true)     //study("TrendLines with Alerts", overlay=true)
//update

length1 = input(20)
check = input(9)
//length2 = input(200)


u=0.0
u := u[1]

l=0.0
l := l[1]

y=0.0
y := y[1]

yl=0.0
yl := yl[1]

angle = 0.0
angle := angle[1]

anglel = 0.0
anglel := anglel[1]

if (highest(length1) == high[check] and highest(length1) == highest(length1)[check] and barssince(barstate.isfirst) > check)
    u := high[check]


if (lowest(length1) == low[check] and lowest(length1) == lowest(length1)[check] and barssince(barstate.isfirst) > check)
    l := low[check]


p = round(barssince(u == high[check]))

pl = round(barssince(l == low[check]))

if p == 0 and barssince(barstate.isfirst) > check
    y := high[abs(p[1]+1+check)]

if pl == 0 and barssince(barstate.isfirst) > check
    yl := low[abs(pl[1]+1+check)]


if p == 0
    angle := (u-y)/p[1]

if pl == 0
    anglel := (l-yl)/pl[1]

uppertrend = u+ (p * angle)

lowertrend = l+ (pl * anglel)

extendup = if barssince(barstate.isfirst) > check
    uppertrend[check] + angle[check] * check*2

extenddown = if barssince(barstate.isfirst) > check
    lowertrend[check] + anglel[check] * check*2


//plot(l[offset]-u,color=red)
//plot(u[offset]-l,color = green )
plot(lowertrend, color = color.green, transp=30,offset = -check)
plot(extenddown, color = color.green, transp=100)
plot(uppertrend, color = color.red, transp=30, offset = -check)
plot(extendup, color = color.red, transp=100)
//plot(l[offset], color = red)

l1 = lowertrend
l2 = extenddown
u1 = uppertrend
u2 = extendup


l2sell = crossunder(high, l2)
u2buy = crossover(low, u2)
buy1 = (low<=lowertrend) and open>lowertrend and high>lowertrend and close>lowertrend
buy2 = (low<=extenddown) and open>extenddown and high>extenddown and close>extenddown
buy = buy1 or buy2 or u2buy
plotshape(series=buy, title="Buy", style=shape.triangleup, size=size.tiny, color=color.lime, location=location.belowbar)
sell1 = (high>=uppertrend) and open<uppertrend and low<uppertrend and close<uppertrend
sell2 = (high>=extendup) and open<extendup and low<extendup and close<extendup
sell = sell1 or sell2 or l2sell
plotshape(series=sell, title="Sell", style=shape.triangledown, size=size.tiny, color=color.red, location=location.abovebar)

longCond = buy
shortCond = sell

tp = input(0.2, title="Take Profit")

tpbuyval = valuewhen(buy, close, 1) + (tp/100)*(valuewhen(buy, close, 1))
tpsellval = valuewhen(sell, close, 1) - (tp/100)*(valuewhen(sell, close, 1))


sl = input(0.2, title="Stop Loss")
slbuyval = valuewhen(buy, close, 0) - (sl/100)*(valuewhen(buy, close, 0))
slsellval = valuewhen(sell, close, 0) + (sl/100)*(valuewhen(sell, close, 0))
// === STRATEGY ===
tradeType = input("BOTH", title="What trades should be taken : ", options=["LONG", "SHORT", "BOTH", "NONE"])

// stop loss
slPoints = input(defval=0, title="Initial Stop Loss Points (zero to disable)", minval=0)
tpPoints = input(defval=0, title="Initial Target Profit Points (zero for disable)", minval=0)

//>>>>>>>>>>>>>>>>>>>>>>>>>>>>>>>>>>>>>>>>>>>>>>>>>>>>>>>>>>>>>>>>>>>>>>>>>>>>>//

testStartYear = input(2019, "Backtest Start Year", minval=1980)
testStartMonth = input(1, "Backtest Start Month", minval=1, maxval=12)
testStartDay = input(1, "Backtest Start Day", minval=1, maxval=31)
testPeriodStart = timestamp(testStartYear, testStartMonth, testStartDay, 0, 0)

testStopYear = input(9999, "Backtest Stop Year", minval=1980)
testStopMonth = input(12, "Backtest Stop Month", minval=1, maxval=12)
testStopDay = input(31, "Backtest Stop Day", minval=1, maxval=31)
testPeriodStop = timestamp(testStopYear, testStopMonth, testStopDay, 0, 0)

testPeriod() =>
    time >= testPeriodStart and time <= testPeriodStop ? true : false

//<<<<<<<<<<<<<<<<<<<<<<<<<<<<<<<<<<<<<<<<<<<<<<<<<<<<<<<<<<<<<<<<<<<<<<<<<<<<<//

//
//set up exit parameters
TP = tpPoints > 0 ? tpPoints : na
SL = slPoints > 0 ? slPoints : na

// Make sure we are within the bar range, Set up entries and exit conditions
if testPeriod() and tradeType != "NONE"
    strategy.entry("long", strategy.long, when=longCond == true and tradeType != "SHORT")
    strategy.entry("short", strategy.short, when=shortCond == true and tradeType != "LONG")
    strategy.close("long", when=shortCond == true and tradeType == "LONG")
    strategy.close("short", when=longCond == true and tradeType == "SHORT")
    strategy.exit("XL", from_entry="long", profit=tpbuyval, loss=slbuyval)
    strategy.exit("XS", from_entry="short", profit=tpsellval, loss=slsellval)

// === /STRATEGY ===
//EOF


////ALERT SYNTEX
//alertcondition(longCond, title="Long", message="Killer Market")
//alertcondition(shortCond, title="Short", message="Poopy Market")