হাইকিন আশির উপর ভিত্তি করে সুপারট্রেন্ড ট্রেলিং স্টপ লস কৌশল
কৌশল ওভারভিউ
এই কৌশলটি হেইকিন আশি স্ট্রিং এবং সুপারট্রেন্ড সূচকগুলির সমন্বয়ে একটি প্রবণতা ট্র্যাকিং স্টপ কৌশল। এটি হেইকিন আশি স্ট্রিং ব্যবহার করে বাজার শব্দ, সুপারট্রেন্ড সূচকগুলি ট্রেন্ডের দিকনির্দেশনা নির্ধারণ করে এবং সুপারট্রেন্ডগুলিকে গতিশীল স্টপ লাইন হিসাবে ব্যবহার করে, কার্যকর প্রবণতা ট্র্যাকিং এবং ঝুঁকি নিয়ন্ত্রণের জন্য।
কৌশল নীতি
- Heikin Ashi ক্যালকুলেট করুনঃ ওপেন, ক্লোজ, হাই, লো-ওভার।
- সুপার ট্রেন্ডিং সূচক গণনা করুনঃ এটিআর এবং দামের উপর ভিত্তি করে ট্র্যাকের উপরে এবং নীচে।
- Heikin Ashi এবং সুপার ট্রেন্ডের সমন্বয়ে ট্রেন্ডের দিকনির্দেশনা নির্ধারণ করুন।
- যখন Heikin Ashi এর শেষের মূল্য পূর্ববর্তী K-লাইন শেষের মূল্যের চেয়ে সুপার ট্রেন্ডের কাছাকাছি থাকে তখন এটি একটি বিউটি ট্রেন্ড; যখন Heikin Ashi এর শেষের মূল্য পূর্ববর্তী K-লাইন শেষের মূল্যের চেয়ে সুপার ট্রেন্ডের কাছাকাছি থাকে তখন এটি একটি বিউটি ট্রেন্ড।
- মুদ্রাস্ফীতির প্রবণতায়, সুপারট্রেন্ডের ট্র্যাকিং স্টপ লাইন হিসাবে সুপারট্রেন্ডের ট্র্যাকিং স্টপ লাইন হিসাবে; পতনের প্রবণতায়, সুপারট্রেন্ডের ট্র্যাকিং স্টপ লাইন হিসাবে সুপারট্রেন্ডের ট্র্যাকিং স্টপ লাইন হিসাবে।
কৌশলগত সুবিধা
- ট্রেন্ড সিগন্যাল সনাক্তকরণের জন্য Heikin Ashi ফিল্টার ব্যবহার করা হয়।
- সুপার ট্রেন্ডগুলি গতিশীল স্টপ লস হিসাবে কাজ করে, ট্রেন্ডের লাভকে সর্বাধিক লক করে এবং খুব বেশি প্রত্যাহার এড়ানো যায়।
- বিভিন্ন সময়কালের সাথে মিলিতভাবে, উচ্চ-নিম্ন সংকেতগুলি নিশ্চিত করার জন্য আরও বেশি খালি রয়েছে।
- নির্দিষ্ট সময়ে অযৌক্তিক কার্যকলাপের প্রভাব এড়ানোর জন্য সময় নির্ধারণের পজিশন ফাংশন।
কৌশলগত ঝুঁকি
- প্রবণতা বিপরীত হলে স্টপ লস করা সহজ। স্টপ লাইন যথাযথভাবে শিথিল করা এই ঝুঁকি কমাতে পারে।
- সুপারট্রেন্ড প্যারামিটার সেটিং ভুল হলে স্টপড্রোম খুব বড় বা খুব ছোট হতে পারে। বিভিন্ন প্যারামিটার সমন্বয় পরীক্ষা করা যেতে পারে।
- তহবিল পরিচালনার বিষয় বিবেচনা করা হয়নি।
কৌশল অপ্টিমাইজেশনের দিকনির্দেশনা
- সুপারট্রেন্ড প্যারামিটার সমন্বয়কে অপ্টিমাইজ করুন এবং সর্বোত্তম প্যারামিটার খুঁজুন।
- পজিশন কন্ট্রোল যোগ করা হয়েছে।
- অতিরিক্ত খরচ বিবেচনা করুন, যেমন ফি, স্লাইড পয়েন্ট ইত্যাদি।
- ট্রেন্ডের শক্তি এবং দুর্বলতার উপর নির্ভর করে স্টপ লসকে নমনীয়ভাবে সামঞ্জস্য করা যায়।
- অন্যান্য সূচকগুলির সাথে মিলিতভাবে প্রবেশের সংকেতগুলি ফিল্টার করার বিষয়টি বিবেচনা করুন।
সারসংক্ষেপ
এই কৌশলটি হেইকিন আশি এবং সুপার ট্রেন্ডস দুটি সূচকের সুবিধাগুলিকে একত্রিত করে, যা ট্রেন্ডের দিকনির্দেশনা ক্যাপচার করতে পারে এবং একই সাথে সুপার ট্রেন্ডগুলি ব্যবহার করে স্বয়ংক্রিয় গতিশীল ট্র্যাকিং স্টপ লস করতে পারে, যার ফলে ট্রেন্ডের মুনাফা লক করা যায়। কৌশলগত ঝুঁকিগুলি মূলত ট্রেন্ড রিভার্স এবং প্যারামিটার অপ্টিমাইজেশনের থেকে আসে, উভয়ই আরও অপ্টিমাইজেশনের মাধ্যমে উন্নত করা যায়। সামগ্রিকভাবে, এই কৌশলটি সূচকগুলির সমন্বয় ব্যবহার করে ট্রেডিং সিস্টেমের স্থিতিশীলতা এবং উপার্জনের জায়গা বাড়ায়।
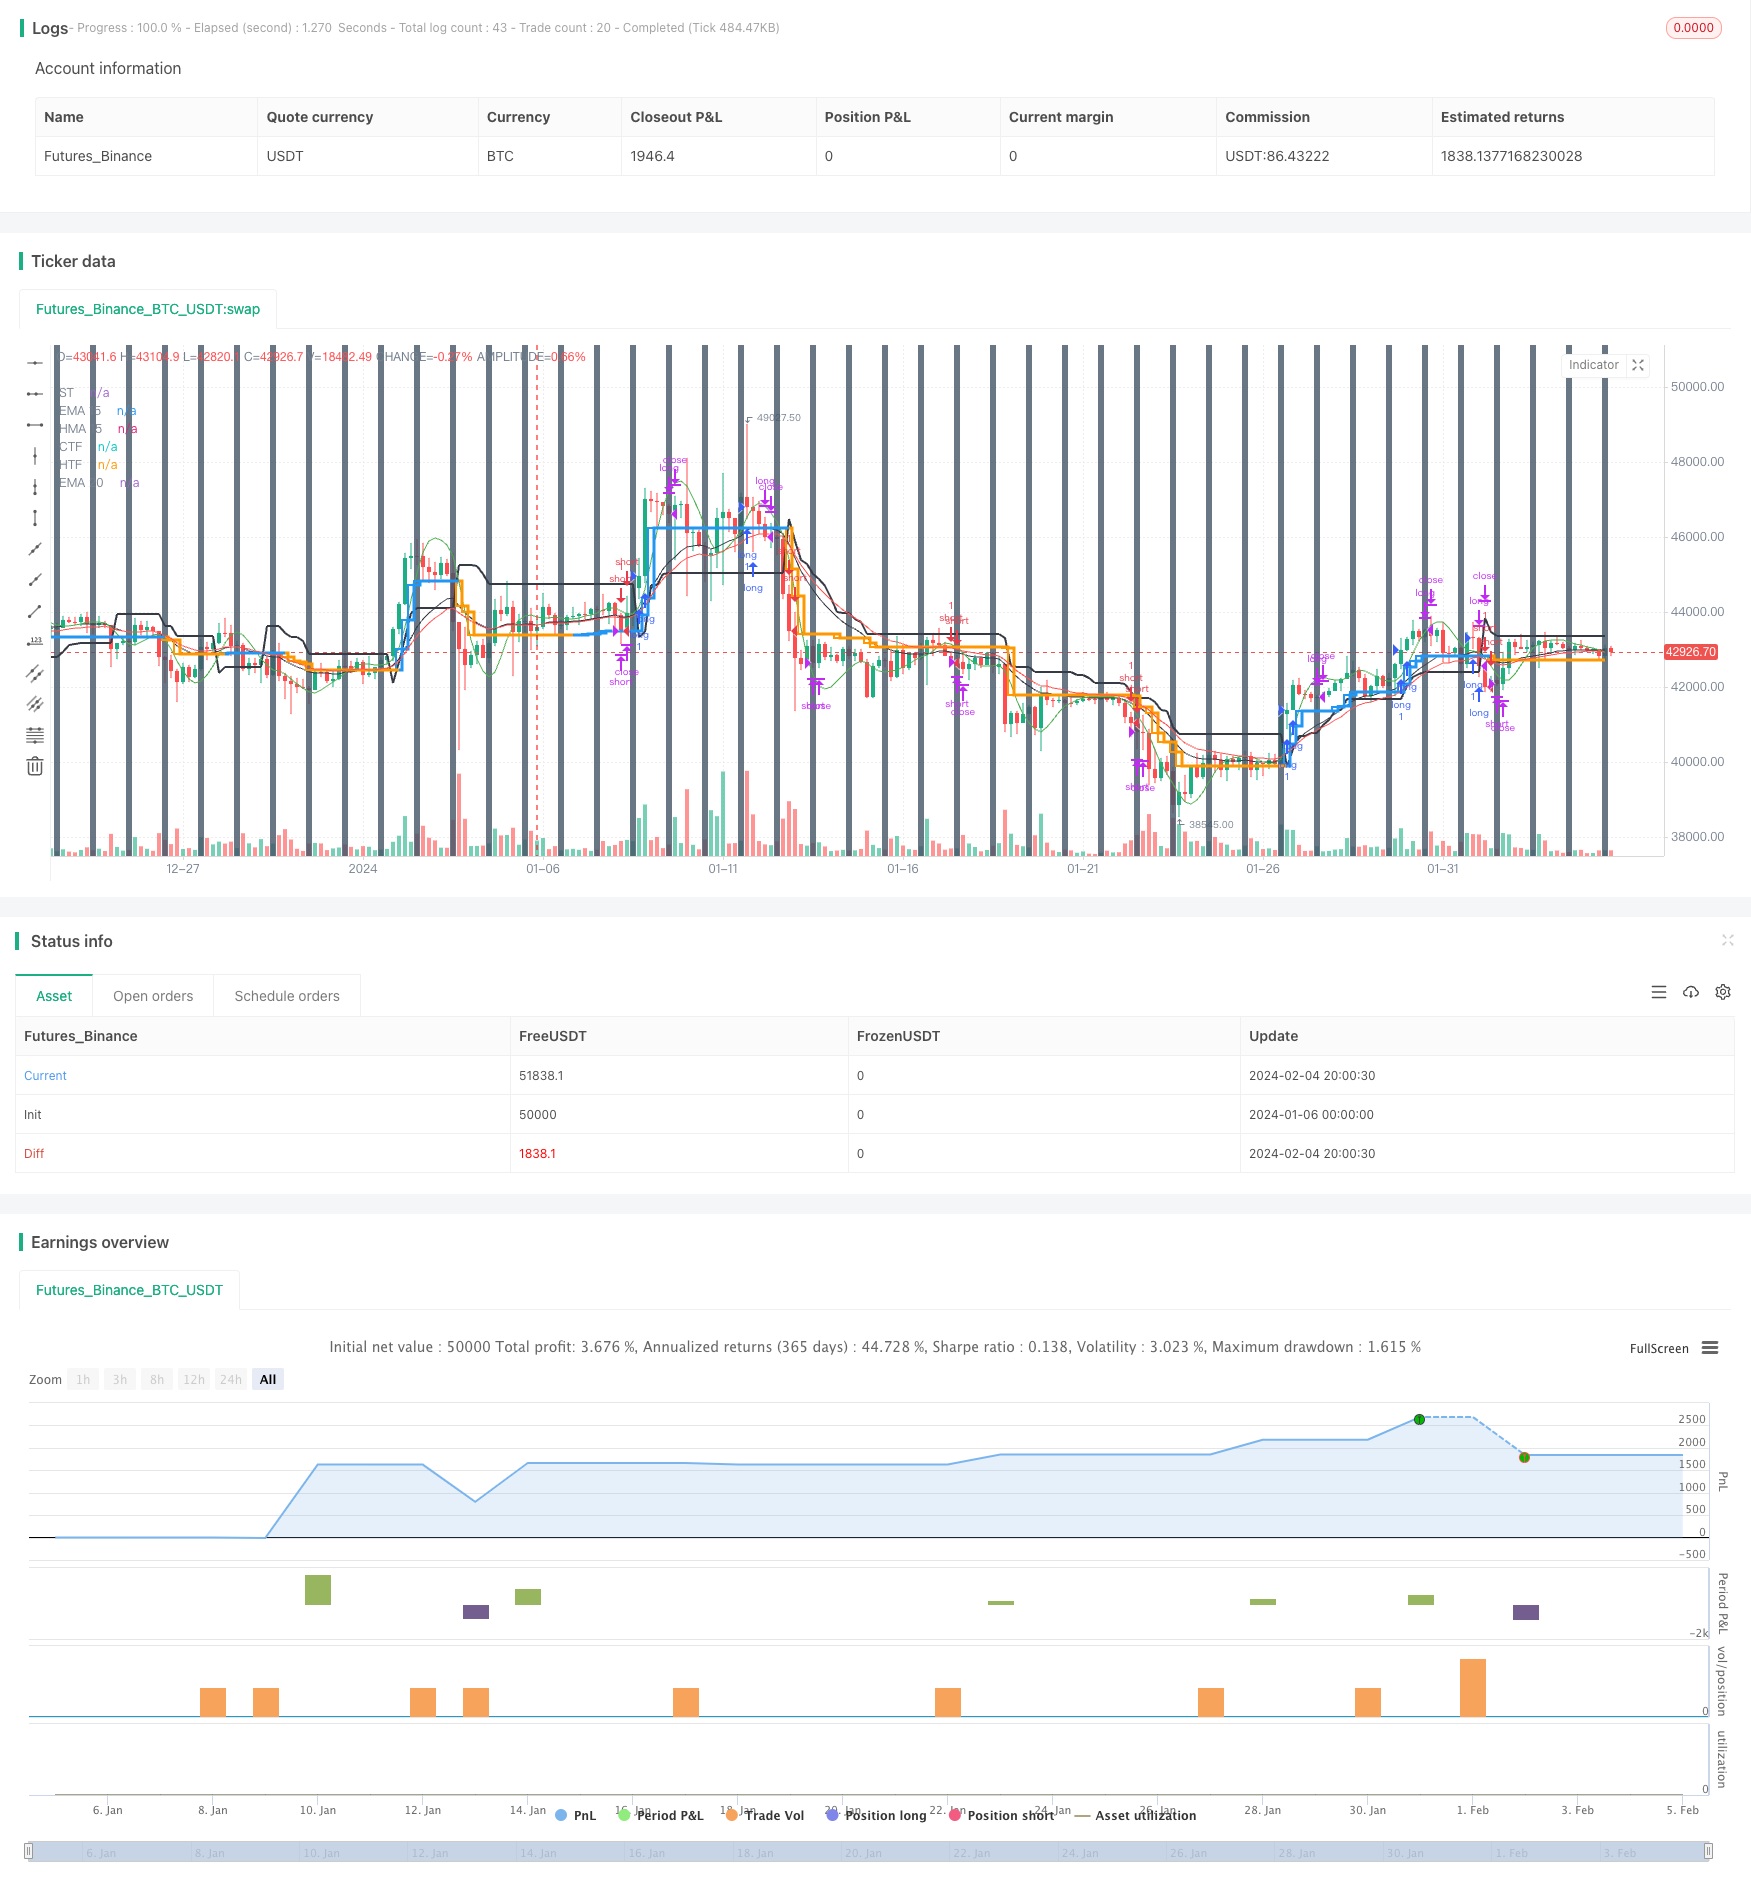
/*backtest
start: 2024-01-06 00:00:00
end: 2024-02-05 00:00:00
period: 4h
basePeriod: 15m
exchanges: [{"eid":"Futures_Binance","currency":"BTC_USDT"}]
*/

// This source code is subject to the terms of the Mozilla Public License 2.0 at https://mozilla.org/MPL/2.0/
// © ringashish

//@version=4
strategy("sa-strategy with HTF-TSL", overlay=true)


Pd = input(title="ATR Period", type=input.integer, defval=4)
Factor = input(title="ATR Multiplier", type=input.float, step=0.1, defval=2)
ST= supertrend(Factor, Pd)

heikinashi_close = security(heikinashi(syminfo.tickerid), timeframe.period, close)
heikinashi_low = security(heikinashi(syminfo.tickerid), timeframe.period, low)
heikinashi_open = security(heikinashi(syminfo.tickerid), timeframe.period, open)
heikinashi_high = security(heikinashi(syminfo.tickerid), timeframe.period, high)

heikinashi_close30 = security(heikinashi(syminfo.tickerid), "30", close)
//res1 = input("30", type=input.resolution, title="higher Timeframe")


//CCI TSL

res = input("240",type=input.resolution,title = "Higher Time Frame")
CCI = input(20)
ATR = input(5)
Multiplier=input(1,title='ATR Multiplier')
original=input(false,title='original coloring')
thisCCI = cci(close, CCI)
lastCCI = nz(thisCCI[1])


calcx()=>
    bufferDn= high + Multiplier * sma(tr,ATR)
    bufferUp= low - Multiplier * sma(tr,ATR)
    if (thisCCI >= 0 and lastCCI < 0)
        bufferUp := bufferDn[1]
    if (thisCCI <= 0 and lastCCI > 0)
        bufferDn := bufferUp[1]

    if (thisCCI >= 0)
        if (bufferUp < bufferUp[1])
            bufferUp := bufferUp[1]
    else
        if (thisCCI <= 0)
            if (bufferDn > bufferDn[1])
                bufferDn := bufferDn[1]


    x = 0.0
    x := thisCCI >= 0 ?bufferUp:thisCCI <= 0 ?bufferDn:x[1]
    x

tempx = calcx()

calcswap() =>
    swap = 0.0
    swap := tempx>tempx[1]?1:tempx<tempx[1]?-1:swap[1]
    swap

tempswap = calcswap()

swap2=tempswap==1?color.blue:color.orange
swap3=thisCCI >=0 ?color.blue:color.orange
swap4=original?swap3:swap2

//display current timeframe's Trend

plot(tempx,"CTF",color=swap4,transp=0,linewidth=2, style = plot.style_stepline)


htfx = security(syminfo.tickerid,res,tempx[1],lookahead = barmerge.lookahead_on)
htfswap4 = security(syminfo.tickerid,res,swap4[1],lookahead = barmerge.lookahead_on)

plot(htfx,"HTF",color=htfswap4,transp=0,linewidth=3,style = plot.style_stepline)


//supertrend
Supertrend(Factor, Pd) =>
    Up=hl2-(Factor*atr(Pd))
    Dn=hl2+(Factor*atr(Pd))

    TrendUp = 0.0
    TrendUp := heikinashi_close[1]>TrendUp[1] ? max(Up,TrendUp[1]) : Up
    TrendDown = 0.0
    TrendDown := heikinashi_close[1]<TrendDown[1]? min(Dn,TrendDown[1]) : Dn
    Trend = 0.0
    Trend := heikinashi_close > TrendDown[1] ? 1: heikinashi_close< TrendUp[1]? -1: nz(Trend[1],1)
    Tsl = Trend==1? TrendUp: TrendDown

    S_Buy = Trend == 1 ? 1 : 0
    S_Sell = Trend != 1 ? 1 : 0

    [Trend, Tsl]

[Trend,Tsl] = Supertrend(Factor, Pd)
// Security
//ST1_Trend_MTF = security(syminfo.tickerid, res1, Tsl,barmerge.lookahead_on)
//plot(ST1_Trend_MTF, "higher ST")

crossdn = crossunder(heikinashi_close,Tsl) or crossunder(heikinashi_close[1],Tsl) or crossunder(heikinashi_close[2],Tsl) or heikinashi_close < Tsl
crossup = crossover(heikinashi_close,Tsl) or crossover(heikinashi_close[1],Tsl) or crossover(heikinashi_close[2],Tsl) or heikinashi_close > Tsl
plot(Tsl,"ST",color = color.black,linewidth =2)
plot(ema(heikinashi_close,20),"EMA 20",color=color.red)
plot(hma(heikinashi_close,15),"HMA 15",color=color.green)
plot(ema(heikinashi_close,15),"EMA 15",color=color.black)

closedown = (heikinashi_close < hma(heikinashi_close,15) and heikinashi_high > hma(heikinashi_close,15)) or(heikinashi_close < ema(heikinashi_close,20) and heikinashi_high > ema(heikinashi_close,20))
closeup = (heikinashi_close > hma(heikinashi_close,15) and heikinashi_low < hma(heikinashi_close,15)) or (heikinashi_close > ema(heikinashi_close,20) and heikinashi_low < ema(heikinashi_close,20))

buy = heikinashi_open == heikinashi_low and closeup and crossup  and close > htfx
//buy = heikinashi_open == heikinashi_low and heikinashi_close > ema(close,20) and heikinashi_low < ema(close,20) and crossup
buyexit = cross(close,tempx) //heikinashi_open == heikinashi_high //and heikinashi_close < ema(close,15) and heikinashi_high > ema(close,15)

//if heikinashi_close30[1] < ST1_Trend_MTF
//sell = heikinashi_open == heikinashi_high and heikinashi_close < ema(close,20) and heikinashi_high > ema(close,20) and rsi(close,14)<60 and crossdn
sell = heikinashi_open == heikinashi_high and closedown and rsi(close,14)<55 and crossdn  and close < htfx
sellexit = cross(close,tempx) //heikinashi_open == heikinashi_low //and heikinashi_close > ema(close,15) and heikinashi_low < ema(close,15)

rg = 0
rg := buy ? 1 : buyexit ? 2 : nz(rg[1])

longLogic = rg != rg[1] and rg == 1
longExit = rg != rg[1] and rg == 2

//plotshape(longExit,"exit buy",style = shape.arrowup,location = location.belowbar,color = color.red, text ="buy exit", textcolor = color.red)
//plotshape(longLogic,"BUY",style = shape.arrowup,location = location.belowbar,color = color.green, text ="buy", textcolor= color.green)

nm = 0
nm := sell ? 1 : sellexit ? 2 : nz(nm[1])

shortLogic = nm != nm[1] and nm == 1
shortExit = nm != nm[1] and nm == 2

//plotshape(shortExit,"exit sell",style = shape.arrowup,location = location.belowbar,color = color.red, text ="sell exit", textcolor = color.red)
//plotshape(shortLogic,"SELL",style = shape.arrowup,location = location.belowbar,color = color.green, text ="sell", textcolor= color.green)


//Exit at particular time

ExitHour = input(title="Exit Hour Of Day", type=input.integer, defval=15, step = 5, maxval = 24, minval = 0)
ExitMint = input(title="Exit Minute Of Day", type=input.integer, defval=15, step = 5, maxval = 24, minval = 0)
bgc = input(title="Highlight Background Color?", type=input.bool, defval=true)
mRound(num,rem) => (floor(num/rem)*rem)
exitTime = (hour(time) >= ExitHour and (minute == mRound(ExitMint, timeframe.multiplier))) ? 1 : 0
exitTime := exitTime == 0 ? (hour(time) >= ExitHour and (minute + timeframe.multiplier >= ExitMint)) ? 1 : 0 : exitTime

MarketClose =  exitTime and not exitTime[1]

alertcondition(exitTime and not exitTime[1], title="Intraday Session Close Time", message="Close All Positions")
bgcolor(exitTime and not exitTime[1] and bgc ? #445566 : na, transp =40)


longCondition = longLogic
if (longCondition)
    strategy.entry("long", strategy.long)


shortCondition = shortLogic
if (shortCondition)
    strategy.entry("short", strategy.short)


strategy.close("short", when =cross(close,tempx)  or MarketClose)
strategy.close( "long", when =cross(close,tempx) or MarketClose )