মুভিং এভারেজের উপর ভিত্তি করে MACD গতিশীল ট্রেন্ড বিচার কৌশল

1
Follow
1782
Followers
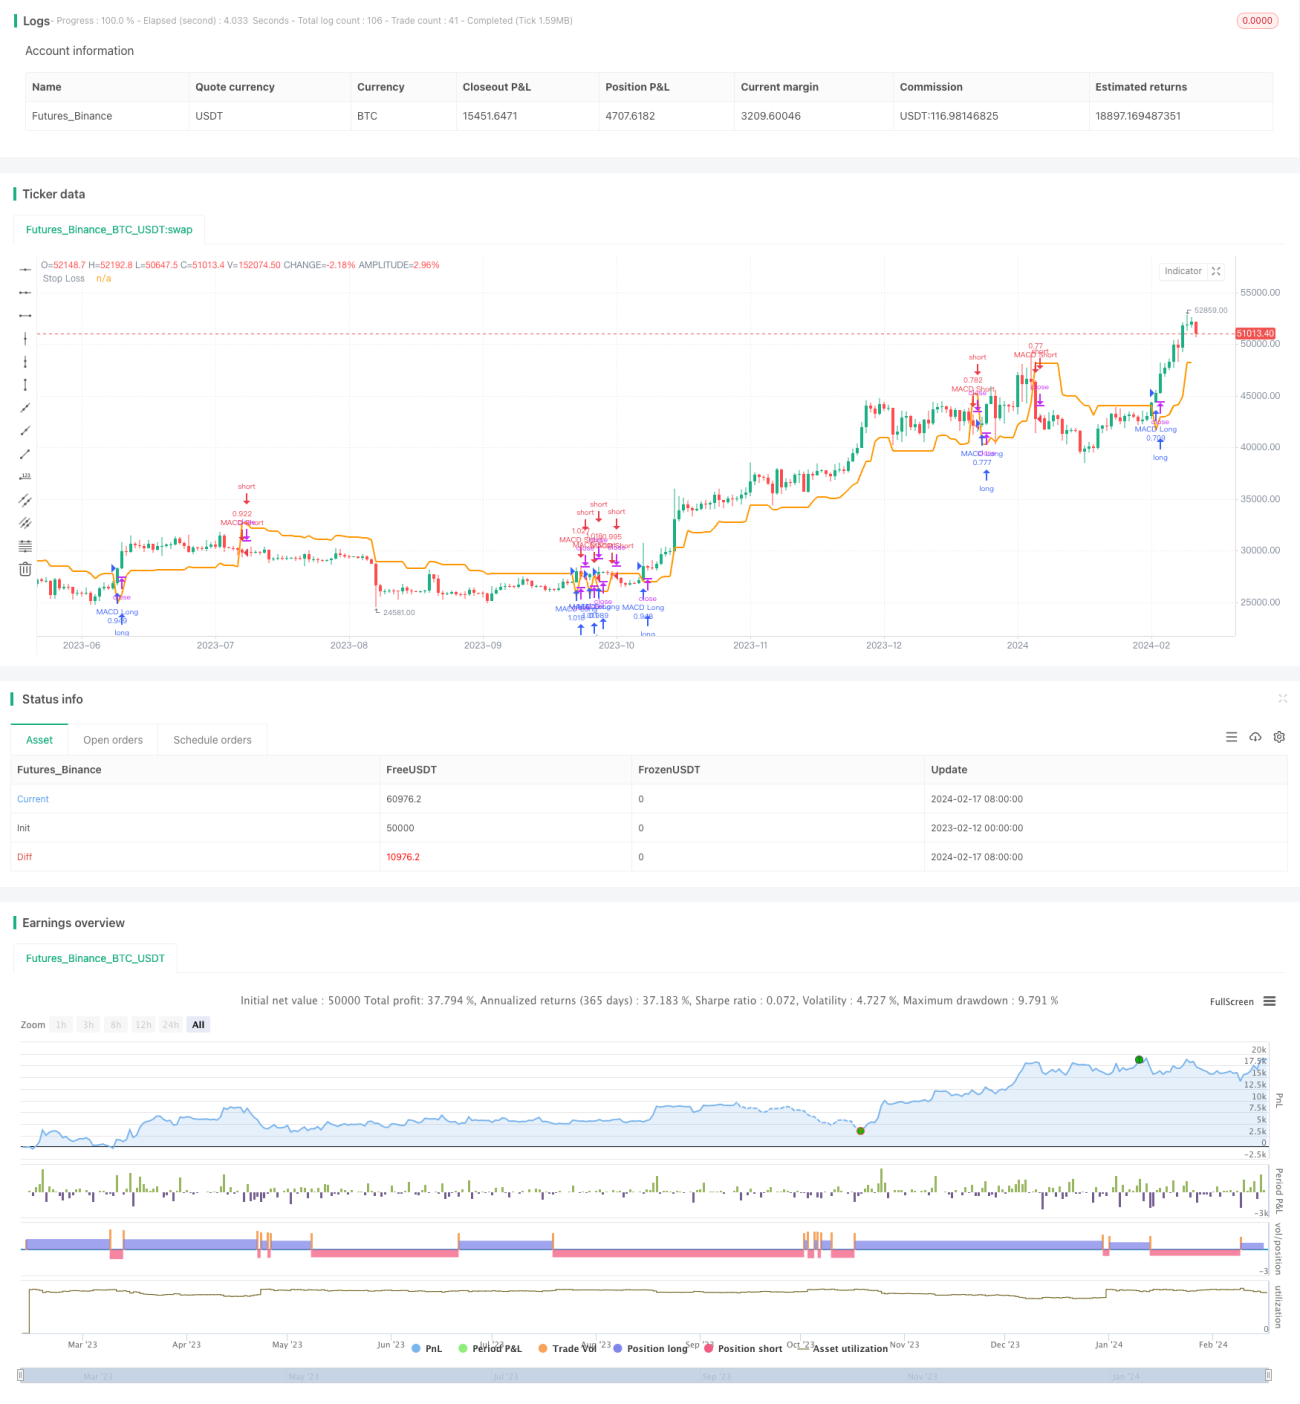
ওভারভিউ
এই কৌশলটি MACD সূচকগুলির সমান্তরাল সমন্বয় ভিত্তিক, সময়কালের মধ্যে গতিশীল প্রবণতা বিচার করতে সক্ষম, এটি একটি ক্লাসিক ট্রেন্ড ট্র্যাকিং কৌশল। প্রধানত দ্রুত এবং ধীর গড়ের পার্থক্য MACD এবং এর সংকেত লাইনের সম্পর্ক দ্বারা বর্তমান প্রবণতার দিকনির্দেশ এবং শক্তি নির্ধারণ করে। একই সাথে ক্রস-সাইক্লিক বিচারটি সঠিকতা বাড়ানোর জন্য, গতিশীলভাবে অবস্থানের সমন্বয় করে।
কৌশল নীতি
- MACD সূচক এবং তার সিগন্যাল লাইন সম্পর্কিত গড় রেখার পার্থক্যের উপর ভিত্তি করে বর্তমান প্রবণতা দিকনির্দেশনা
- MACD পার্থক্যের উপরে সিগন্যাল লাইনটি মাল্টি সিগন্যাল হিসাবে এবং নীচে ফাঁকা সিগন্যাল হিসাবে রয়েছে
- MACD পার্থক্য এবং MACD কলামের সমান্তরাল কৌশলগত সংকেত বৃদ্ধি প্রবর্তন
- একটি ট্রান্স-সাইক্লিকাল বিচার মডিউল যোগ করা হয়েছে, উচ্চতর সময়কালের MACD সূচকগুলি সংকেত ফিল্টার এবং পজিশনের নিয়ন্ত্রণের ভিত্তিতে
- পজিশন ডায়নামিক অ্যাডজাস্টমেন্ট, ক্রস-সাইক্লিক সংকেত দুর্বল হলে পজিশনের আকার হ্রাস করুন, সংকেত শক্তিশালী হলে পজিশন বাড়ান
সামর্থ্য বিশ্লেষণ
- MACD সূচক নিজেই প্রবণতা দিক নির্ণয় করার জন্য বেশি কার্যকর
- সংমিশ্রণ MACD পার্থক্য এবং কলামযুক্ত লাইন দ্বৈত যাচাইকরণ, যা সংকেত নির্ভুলতা উন্নত করতে পারে
- উচ্চ-ফ্রিকোয়েন্সি সংকেত দ্বারা বিভ্রান্ত হওয়া এড়াতে কৌশলটির স্থায়িত্ব বাড়ানোর জন্য ট্রান্স-সাইকেল বিচার
- ডায়নামিক পজিশনের সমন্বয় কৌশলকে সুযোগগুলি আরও ভালভাবে কাজে লাগাতে এবং অতিরিক্ত উপার্জন বাড়াতে সহায়তা করে
ঝুঁকি বিশ্লেষণ এবং সমাধান
- MACD সংকেত বিলম্বিত হয়, যার ফলে সংকেতটি কিছুটা দুর্বল হতে পারে
- সমাধানঃ দ্রুত গড় এবং ধীর গড়ের পার্থক্য নির্ধারণ করে সংকেতটি আগে ধরার জন্য
- ক্রস-সাইকেল সংকেতগুলি সঠিক হতে পারে না এবং কৌশলগুলিকে বিভ্রান্ত করতে পারে
- সমাধানঃ পজিশনের গতিশীল সমন্বয় ব্যবস্থা প্রবর্তন করা, যাতে প্রধান চক্রের কৌশলগুলি প্রভাবশালী হয়
- মাল্টি-ফ্যাক্টর সমন্বয় কৌশল সামগ্রিক স্থিতিশীলতা কম হতে পারে
- সমাধানঃ সামগ্রিক স্থিতিশীলতা নিশ্চিত করার জন্য কৌশলগত প্যারামিটারগুলিকে সাবধানে সামঞ্জস্য করুন
অপ্টিমাইজেশান দিক
- বিভিন্ন পিরিয়ড প্যারামিটার সমন্বয় পরীক্ষা
- কৌশলগত কার্যকারিতার উপর বিভিন্ন ক্রস-চক্রের সংমিশ্রণের প্রভাব পরীক্ষা করা
- MACD সূচক প্যারামিটারগুলিকে সামঞ্জস্য করুন, যেমন ধীর গড় লাইন সময়কাল, সিগন্যাল লাইন সময়কাল ইত্যাদি
- বিভিন্ন পজিশনে নিয়ন্ত্রক ফ্যাক্টরের প্রভাব পরীক্ষা করা
- অন্যান্য জাতের উপর পরীক্ষার ফলাফল
সারসংক্ষেপ
MACD সমান্তরাল সমন্বয় ক্রস-চক্র গতিশীল প্রবণতা কৌশল, ক্লাসিক সূচক বিচার এবং একাধিক সময় ফ্রেম রেফারেন্সের সুবিধাগুলি একত্রিত করে। প্যারামিটার অপ্টিমাইজেশন এবং সমন্বয় পরীক্ষার মাধ্যমে, একটি স্থিতিশীল, ভাল উপার্জন প্রবণতা ট্র্যাকিং কৌশল তৈরি করা যেতে পারে। এটি রিয়েল-স্টোর পরীক্ষার এবং প্রয়োগের জন্য উপযুক্ত।
Source
Pine
Strategy parameters
Related strategies
Comment
All comments (0)
No data
- 1