গতি এবং স্ট্যান্ডার্ড ডেভিয়েশনের উপর ভিত্তি করে সোনার ট্রেডিং কৌশল
ওভারভিউ
এই কৌশলটি 21 তম সূচকীয় চলমান গড়ের তুলনায় সোনার দামের বিচ্যুতির পরিমাণ গণনা করে বাজারের ওভারবয় ও ওভারসেলের বিষয়ে বিচার করার জন্য স্ট্যান্ডার্ড ডিফারেনশিয়ালের সাথে মিলিত হয়। যখন বিচ্যুতি একটি নির্দিষ্ট স্ট্যান্ডার্ড ডিফারেনশিয়ালের স্তরে পৌঁছে যায়, তখন ট্রেন্ড ট্র্যাকিং কৌশল গ্রহণ করা হয় এবং ঝুঁকি নিয়ন্ত্রণের জন্য স্টপ লস ব্যবস্থা স্থাপন করা হয়।
কৌশল নীতি
- মধ্যম অক্ষ হিসেবে ২১ দিনের চলমান গড় গণনা করা
- চলমান গড় থেকে স্বর্ণের মূল্যের বিচ্যুতি গণনা করা
- Z-Score-এ পরিণত করা হয়েছে
- যখন Z-স্কোর 0.5 হয়, তখন বেশি কাজ করুন; যখন Z-স্কোর -0.5 হয়, তখন খালি করুন
- জেড-স্কোর 0.5/-0.5 এর নীচে নেমে যায়, সমান্তরাল
- Z-Score 3⁄3 এর বেশি হলে, স্টপ লস
সামর্থ্য বিশ্লেষণ
এটি একটি ট্রেন্ড ট্র্যাকিং কৌশল যা বাজারে অতিরিক্ত ক্রয় ও বিক্রয়কে মূল্যের গতিশীলতা এবং মানদণ্ডের উপর ভিত্তি করে নির্ধারণ করে এবং নিম্নলিখিত সুবিধাগুলি রয়েছেঃ
- গতিশীল সমর্থন / প্রতিরোধ হিসাবে চলমান গড় ব্যবহার করে, আপনি ট্রেন্ডটি ধরতে পারেন
- স্ট্যান্ডার্ড ব্যালেন্স এবং জেড-স্কোর ওভারবয় ও ওভারসেলের জন্য ভালো, যা ভুয়া সংকেত হ্রাস করে।
- সূচকীয় চলমান গড় ব্যবহার করে, সাম্প্রতিক মূল্যের উপর আরো বেশি প্রভাব এবং সংবেদনশীল
- জেড-স্কোর মূল্যের বিচ্যুতিকে মানসম্মত করে, যা বিচারকে আরও একীভূত করে
- স্টপ লস ম্যানেজমেন্ট, সময়মতো স্টপ লস, ঝুঁকি নিয়ন্ত্রণ
ঝুঁকি বিশ্লেষণ
এই কৌশলটির কিছু ঝুঁকিও রয়েছেঃ
- মুভিং এভারেজ একটি বেঞ্চমার্ক হিসাবে ব্যবহৃত হয়, যখন দামের একটি সুস্পষ্ট উঁচু বা বিপর্যয় দেখা দেয় তখন একটি ভুল সংকেত দেয়
- স্ট্যান্ডার্ড ডিভাইস এবং জেড-স্কোরের থ্রেশহোল্ডগুলি যথাযথভাবে সেট করা দরকার, খুব বড় বা খুব ছোট হওয়া কৌশলটির কার্য সম্পাদনকে প্রভাবিত করে
- ভুল স্টপ লস সেটিং, যা অপ্রয়োজনীয় ক্ষতির কারণ হতে পারে
- হঠাৎ ঘটনাগুলি মূল্যের ব্যাপক ওঠানামা সৃষ্টি করে, যা স্টপ লস ট্রিগার করে এবং ট্রেন্ডের সুযোগ মিস করে
সমাধানঃ
- মূল প্রবণতা সনাক্ত করুন
- অপ্টিমাইজড স্ট্যান্ডার্ড ডিভার্জেন্স প্যারামিটারগুলি পুনরায় পরিমাপ করে সর্বোত্তম থ্রেশহোল্ডগুলি সন্ধান করুন
- ট্রেইলিং স্টপ ক্ষতির পরীক্ষা নীতির জন্য যুক্তিসঙ্গততা সেট করুন
- ঘটনার পরে সময়মত বাজার পরিস্থিতি পুনর্বিবেচনা করুন, কৌশলগত প্যারামিটারগুলি সামঞ্জস্য করুন
অপ্টিমাইজেশান দিক
এই কৌশলটি নিম্নলিখিত দিকগুলি থেকে উন্নত করা যেতে পারেঃ
- Risk appetite নির্ধারণের জন্য সহজ স্ট্যান্ডার্ড ডিভার্সের পরিবর্তে ATR এর মতো ওলট-পালট হার সূচক ব্যবহার করা হয়
- বিভিন্ন ধরণের চলমান গড়ের সাথে চেষ্টা করুন এবং আরও উপযুক্ত মিড-অ্যাক্সেসের সন্ধান করুন
- অপ্টিমাইজড চলমান গড় প্যারামিটার, Identify সেরা গড় লাইন সময়কাল
- Z- স্কোর থ্রেশহোল্ডগুলিকে অপ্টিমাইজ করুন, সর্বোত্তম কৌশল পারফরম্যান্স প্যারামিটারগুলি সন্ধান করুন
- অস্থিরতার উপর ভিত্তি করে ক্ষতির পরিমাণ বাড়ানো, যাতে ক্ষতির পরিমাণ আরও স্মার্ট এবং যুক্তিসঙ্গত হয়
সারসংক্ষেপ
এই কৌশলটি সামগ্রিকভাবে একটি মৌলিক যুক্তিসঙ্গত প্রবণতা ট্র্যাকিং কৌশল। এটি মূল প্রবণতার দিকনির্দেশের জন্য চলমান গড় ব্যবহার করে এবং দামের বিচ্যুতির মানসম্মত প্রক্রিয়াকরণের মাধ্যমে বাজারের ওভার-বিক্রয় ওভার-বিক্রয় পরিস্থিতি স্পষ্টভাবে নির্ধারণ করতে পারে, যার ফলে একটি লেনদেনের সংকেত তৈরি হয়। যুক্তিসঙ্গত স্টপ-ও-স্টপ পদ্ধতিটি কৌশলটিকে লাভজনকতার গ্যারান্টি দেওয়ার সময় ঝুঁকি নিয়ন্ত্রণ করতে দেয়। প্যারামিটারগুলি আরও অনুকূলিতকরণ এবং আরও শর্তাধীন বিচার যুক্ত করে কৌশলটিকে আরও স্থিতিশীল, নির্ভরযোগ্য এবং খুব শক্তিশালী ব্যবহারের মান তৈরি করতে পারে।
/*backtest
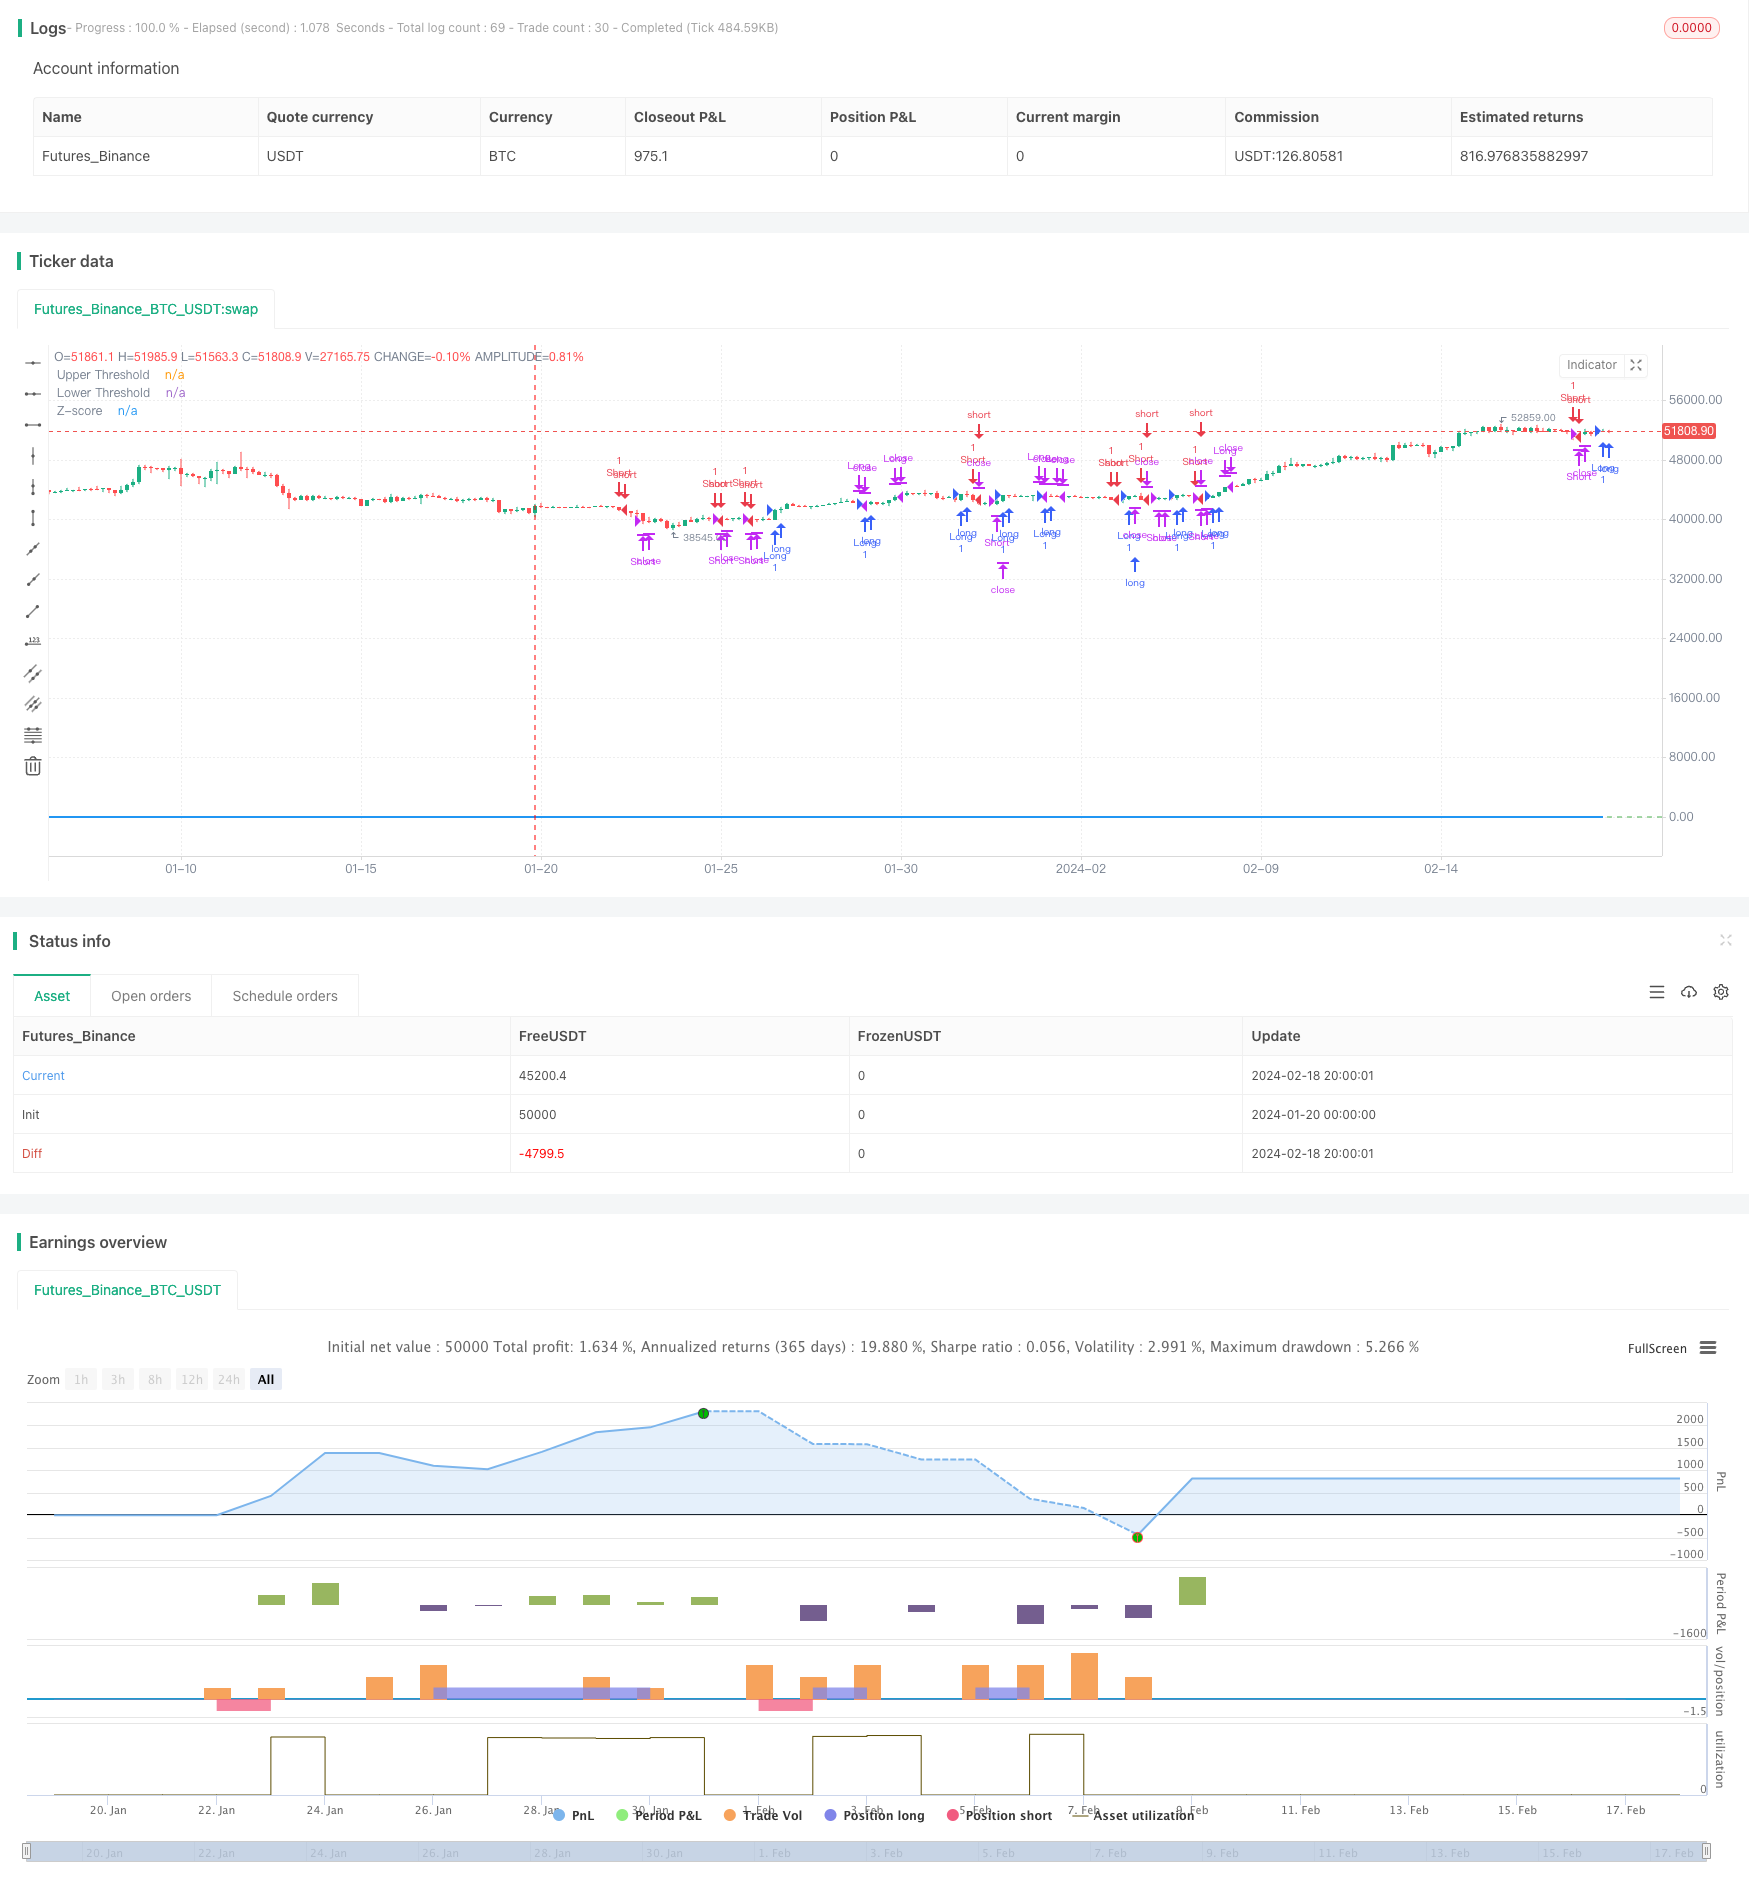
start: 2024-01-20 00:00:00
end: 2024-02-19 00:00:00
period: 4h
basePeriod: 15m
exchanges: [{"eid":"Futures_Binance","currency":"BTC_USDT"}]
*/
//@version=5
strategy("GC Momentum Strategy with Stoploss and Limits", overlay=true)
// Input for the length of the EMA
ema_length = input.int(21, title="EMA Length", minval=1)
// Exponential function parameters
steepness = 2
// Calculate the EMA
ema = ta.ema(close, ema_length)
// Calculate the deviation of the close price from the EMA
deviation = close - ema
// Calculate the standard deviation of the deviation
std_dev = ta.stdev(deviation, ema_length)
// Calculate the Z-score
z_score = deviation / std_dev
// Long entry condition if Z-score crosses +0.5 and is below 3 standard deviations
long_condition = ta.crossover(z_score, 0.5)
// Short entry condition if Z-score crosses -0.5 and is above -3 standard deviations
short_condition = ta.crossunder(z_score, -0.5)
// Exit long position if Z-score converges below 0.5 from top
exit_long_condition = ta.crossunder(z_score, 0.5)
// Exit short position if Z-score converges above -0.5 from below
exit_short_condition = ta.crossover(z_score, -0.5)
// Stop loss condition if Z-score crosses above 3 or below -3
stop_loss_long = ta.crossover(z_score, 3)
stop_loss_short = ta.crossunder(z_score, -3)
// Enter and exit positions based on conditions
if (long_condition)
strategy.entry("Long", strategy.long)
if (short_condition)
strategy.entry("Short", strategy.short)
if (exit_long_condition)
strategy.close("Long")
if (exit_short_condition)
strategy.close("Short")
if (stop_loss_long)
strategy.close("Long")
if (stop_loss_short)
strategy.close("Short")
// Plot the Z-score on the chart
plot(z_score, title="Z-score", color=color.blue, linewidth=2)
// Optional: Plot zero lines for reference
hline(0.5, "Upper Threshold", color=color.red)
hline(-0.5, "Lower Threshold", color=color.green)