গতিশীল তিনটি মুভিং এভারেজ ট্রেন্ড অনুসরণ কৌশল
ওভারভিউ
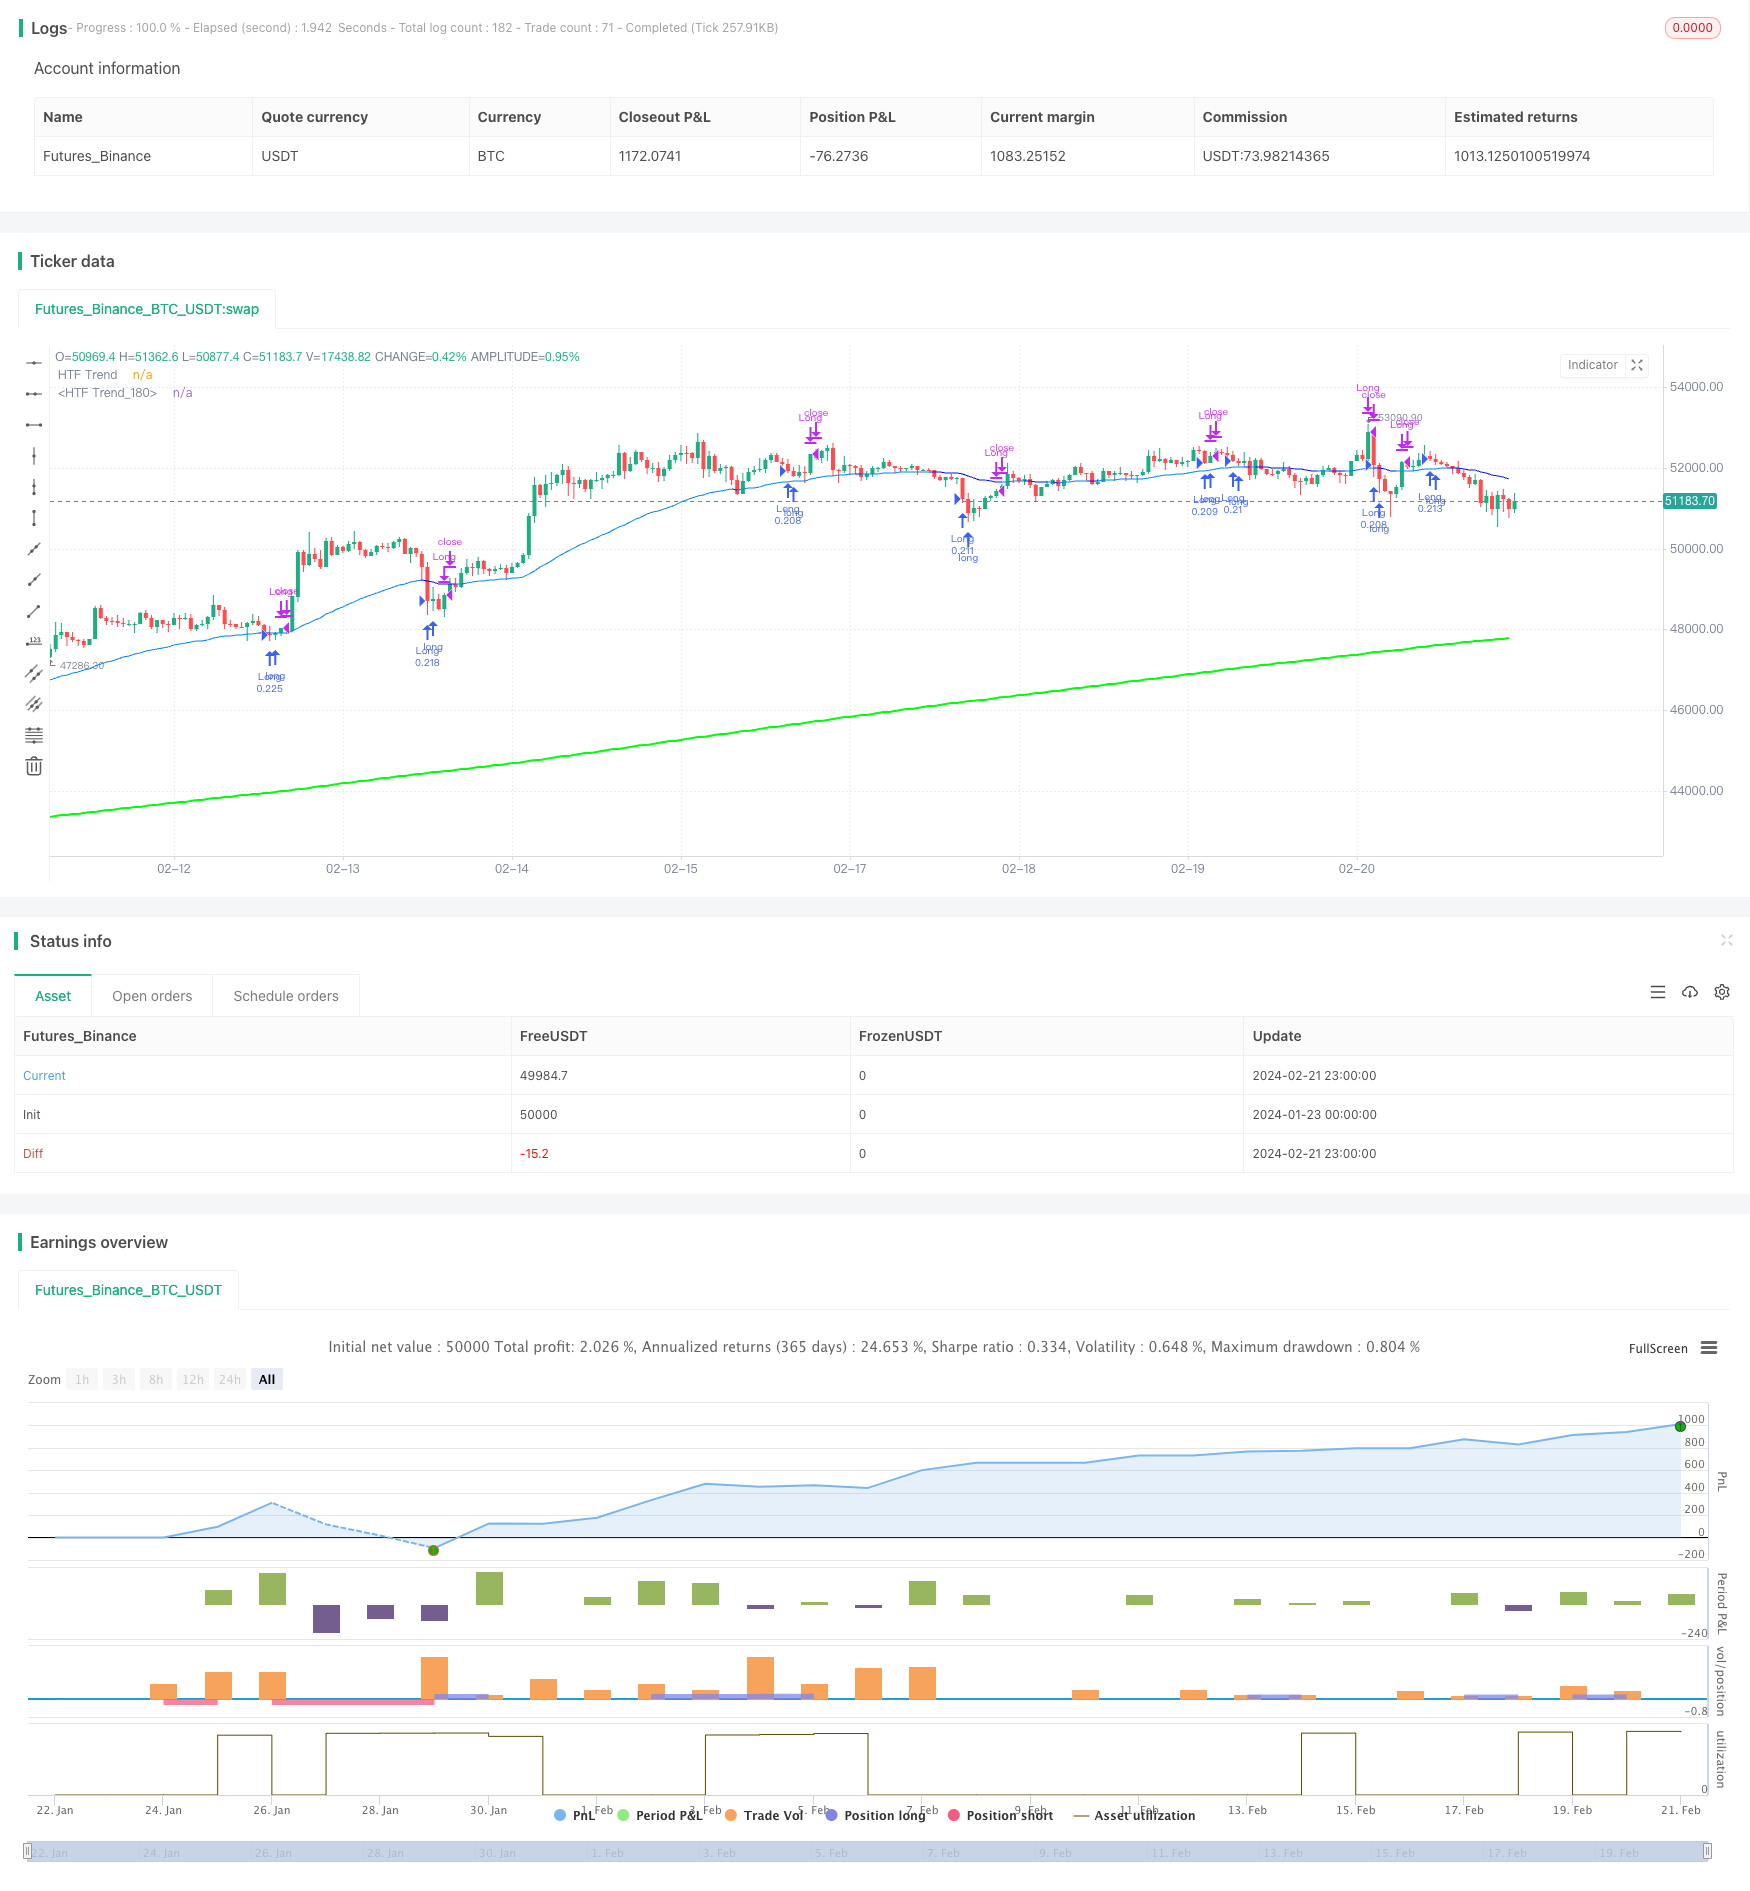
ডায়নামিক থ্রি-ওভারলাইন ট্রেন্ড ট্র্যাকিং কৌশলটি একাধিক সময়কালের গতিশীল মসৃণ চলমান গড় ব্যবহার করে বাজারের প্রবণতা সনাক্ত করতে, বিভিন্ন সময়কালের মধ্যে প্রবণতা সামঞ্জস্যপূর্ণ ফিল্টারিং করতে, যার ফলে ট্রেডিং সিগন্যালের নির্ভরযোগ্যতা বৃদ্ধি পায়।
কৌশল নীতি
এই কৌশলটি 3 টি ভিন্ন প্যারামিটার সেটের একটি গতিশীল সমতল চলমান গড় ব্যবহার করে। প্রথম চলমান গড়টি বর্তমান চক্রের দামের প্রবণতা দিকটি গণনা করে, দ্বিতীয় চলমান গড়টি উচ্চতর সময়কালের দামের প্রবণতা দিকটি গণনা করে, এবং তৃতীয় চলমান গড়টি আরও উচ্চতর সময়কালের দামের প্রবণতা দিকটি গণনা করে। প্রথম চলমান গড়টি যখন দ্বিতীয় চলমান গড়কে অতিক্রম করে তখন একটি কেনার সংকেত তৈরি করে এবং তৃতীয় চলমান গড়টিও একটি উত্থানের প্রবণতা দেখায়, ক্রয় সংকেতের নির্ভরযোগ্যতা যাচাই করে। পুরো কৌশলটি বিভিন্ন সময়কালের মধ্যে প্রবণতা অতিক্রম করে, একাধিক সময় ফ্রেমের মধ্যে প্রবণতা সামঞ্জস্যতা অর্জন করে, যার ফলে ট্রেডিং সংকেতের নির্ভরযোগ্যতা নিশ্চিত হয়।
মুভিং এভারেজ একটি গতিশীল মসৃণকরণ ফাংশন ব্যবহার করে যা স্বয়ংক্রিয়ভাবে গণনা করে এবং বিভিন্ন সময়কালের মধ্যে যথাযথ মসৃণকরণ ফ্যাক্টর প্রয়োগ করে, যার ফলে উচ্চ সময়কালের মুভিং এভারেজগুলি নিম্ন সময়কালের চার্টে একটি মসৃণ প্রবণতা লাইন প্রদর্শন করে, একটি বক্ররেখার পরিবর্তে। এই গতিশীল মসৃণকরণ কৌশলটি উচ্চ সময়কালের সময়কালে সামগ্রিক প্রবণতা দিকনির্দেশের বিচার করতে দেয় এবং একই সাথে কম সময়কালের সময় ট্রেডিং কার্যকর করতে পারে, যাতে কার্যকর প্রবণতা ট্র্যাকিং সম্ভব হয়।
কৌশলগত সুবিধা
এই কৌশলটির সবচেয়ে বড় সুবিধা হল একাধিক টাইম ফ্রেমের জন্য প্রবণতা ফিল্টারিং প্রক্রিয়া। বিভিন্ন সময়কালের দামের গড় প্রবণতা দিকের গণনা করে এবং বিভিন্ন সময়কালের মধ্যে সামঞ্জস্যের জন্য অনুরোধ করে, আপনি কার্যকরভাবে বাণিজ্য সংকেতের উপর ভিলেটিটির স্বল্পমেয়াদী মূল্যের ওঠানামাকে ফিল্টার করতে পারেন, যাতে প্রতিটি ট্রেডিং সংকেতকে বৃহত্তর প্রবণতার মধ্যে রাখা হয়, যার ফলে মুনাফার সম্ভাবনা উল্লেখযোগ্যভাবে বৃদ্ধি পায়।
আরেকটি সুবিধা হল ডায়নামিক মসৃণকরণ ফাংশনের ব্যবহার। এটি কৌশলকে উচ্চ সময়কালের সামগ্রিক প্রবণতা এবং নিম্ন সময়কালের নির্দিষ্ট ট্রেডিং পয়েন্টগুলিকে একই সাথে সনাক্ত করতে সক্ষম করে। কৌশলটি উচ্চ সময়কালের সময়কালের মধ্যে বড় প্রবণতার দিক নির্ধারণ করতে পারে এবং নিম্ন সময়কালের মধ্যে নির্দিষ্ট লেনদেন সম্পাদন করতে পারে। এই বহু সময়সীমার ফ্রেমওয়ার্কের ব্যবহার, বাজারের সুযোগগুলি ধরে রাখার পাশাপাশি লেনদেনের ঝুঁকি নিয়ন্ত্রণে সহায়তা করে।
ঝুঁকি এবং অপ্টিমাইজেশান
এই কৌশলটির প্রধান ঝুঁকি হল কম ট্রেডিং সিগন্যাল। কঠোর প্রবণতা ফিল্টারিং শর্তগুলি ব্যবসায়ের সুযোগের সংখ্যা হ্রাস করে, যা কিছু উচ্চ-ফ্রিকোয়েন্সি ব্যবসায়ের জন্য আগ্রহী বিনিয়োগকারীদের পক্ষে খুব উপযুক্ত নাও হতে পারে। ফিল্টারিং শর্তগুলির কঠোরতা হ্রাস করে আরও বেশি ব্যবসায়ের সুযোগ পাওয়া যায়।
এছাড়াও, প্যারামিটার সেটিংগুলিকে সতর্কতার সাথে পরীক্ষা করা ও অনুকূলিতকরণ করা প্রয়োজন, বিশেষত চলমান গড়ের চক্রের দৈর্ঘ্য। বিভিন্ন বাজারে সর্বোত্তম প্রভাব অর্জনের জন্য বিভিন্ন চক্রের প্যারামিটার সেট করা প্রয়োজন। সর্বোত্তম প্যারামিটার সমন্বয়টি খুঁজে বের করার জন্য ব্যাক-টেস্টিং করা যেতে পারে।
ভবিষ্যতে অপ্টিমাইজেশনের দিকনির্দেশনাগুলি আরও প্রযুক্তিগত সূচক যুক্ত করার জন্য বা মেশিন লার্নিং অ্যালগরিদমের স্বয়ংক্রিয় অপ্টিমাইজেশান প্যারামিটার যুক্ত করার জন্য বিবেচনা করা যেতে পারে। এগুলি কৌশলগত কার্যকারিতা বাড়ানোর কার্যকর উপায় হবে।
সারসংক্ষেপ
এই কৌশলটি সামগ্রিকভাবে একটি খুব ব্যবহারিক প্রবণতা ট্র্যাকিং কৌশল। মাল্টি টাইম ফ্রেম প্রবণতা ফিল্টারিং প্রক্রিয়া প্রতিটি লেনদেনের সিদ্ধান্তের জন্য ভাল বৃহত দিকনির্দেশ সমর্থন সরবরাহ করে, কার্যকরভাবে লেনদেনের ঝুঁকি হ্রাস করে। এবং গতিশীল মসৃণকরণের বৈশিষ্ট্যগুলির সংযোজনও এই মাল্টি টাইম ফ্রেম পদ্ধতিটি কার্যকরভাবে বাস্তবায়িত করতে পারে। পুরো কৌশল ফ্রেমওয়ার্কটি যুক্তিসঙ্গত, কার্যকরভাবে কাজ করে এবং শেখার এবং প্রয়োগের জন্য মূল্যবান।
/*backtest
start: 2024-01-23 00:00:00
end: 2024-02-22 00:00:00
period: 1h
basePeriod: 15m
exchanges: [{"eid":"Futures_Binance","currency":"BTC_USDT"}]
*/

// This Pine Script™ code is subject to the terms of the Mozilla Public License 2.0 at https://mozilla.org/MPL/2.0/
// © Harrocop

//@version=5
strategy(title = "Triple MA HTF strategy - Dynamic Smoothing", shorttitle = "Triple MA strategy", overlay=true,
         pyramiding=5, initial_capital = 10000,
         calc_on_order_fills=false,
         slippage = 0,
         commission_type=strategy.commission.percent, commission_value=0.05)

//////////////////////////////////////////////////////
//////////         Risk Management        ////////////
//////////////////////////////////////////////////////
RISKM = "-------------------- Risk Management  --------------------"
InitialBalance = input.float(defval = 10000, title = "Initial Balance", minval = 1, maxval = 1000000, step = 1000, tooltip = "starting capital", group = RISKM)
LeverageEquity = input.bool(defval = true, title = "qty based on equity %", tooltip = "true turns on MarginFactor based on equity, false gives fixed qty for positionsize", group = RISKM)
MarginFactor = input.float(0, minval = - 0.9, maxval = 100, step = 0.1, tooltip = "Margin Factor, meaning that 0.5 will add 50% extra capital to determine ordersize quantity, 0.0 means 100% of equity is used to decide quantity of instrument", inline = "qty", group = RISKM)
QtyNr = input.float(defval = 3.5, title = "Quantity Contracts", minval = 0, maxval = 1000000, step = 0.01,  tooltip = "Margin Factor, meaning that 0.5 will add 50% extra capital to determine ordersize quantity, 0.0 means 100% of equity is used to decide quantity of instrument", inline = "qty", group = RISKM)
EquityCurrent = InitialBalance + strategy.netprofit[1]
QtyEquity = EquityCurrent * (1 + MarginFactor) / close[1]
QtyTrade = LeverageEquity ? QtyEquity : QtyNr

/////////////////////////////////////////////////////
//////////       MA Filter Trend         ////////////
/////////////////////////////////////////////////////
TREND = "-------------------- Moving Average 1 --------------------"
Plot_MA = input.bool(true, title = "Plot MA trend?", inline = "Trend1", group = TREND)
TimeFrame_Trend = input.timeframe(title='Higher Time Frame', defval='15', inline = "Trend1", group = TREND)
length = input.int(21, title="Length MA", minval=1, tooltip = "Number of bars used to measure trend on higher timeframe chart", inline = "Trend2", group = TREND)
MA_Type  = input.string(defval="McGinley" , options=["EMA","DEMA","TEMA","SMA","WMA", "HMA", "McGinley"], title="MA type:", inline = "Trend2", group = TREND)

ma(type, src, length) =>
    float result = 0
    if type == 'TMA' // Triangular Moving Average
        result := ta.sma(ta.sma(src, math.ceil(length / 2)), math.floor(length / 2) + 1)
        result
    if type == 'LSMA' // Least Squares Moving Average
        result := ta.linreg(src, length, 0)
        result
    if type == 'SMA'  // Simple Moving Average
        result := ta.sma(src, length)
        result
    if type == 'EMA'  // Exponential Moving Average
        result := ta.ema(src, length)
        result
    if type == 'DEMA'  // Double Exponential Moving Average
        e = ta.ema(src, length)
        result := 2 * e - ta.ema(e, length)
        result
    if type == 'TEMA'  // Triple Exponentiale
        e = ta.ema(src, length)
        result := 3 * (e - ta.ema(e, length)) + ta.ema(ta.ema(e, length), length)
        result
    if type == 'WMA'  // Weighted Moving Average
        result := ta.wma(src, length)
        result
    if type == 'HMA'  // Hull Moving Average
        result := ta.wma(2 * ta.wma(src, length / 2) - ta.wma(src, length), math.round(math.sqrt(length)))
        result
    if type == 'McGinley' // McGinley Dynamic Moving Average
        mg = 0.0
        mg := na(mg[1]) ? ta.ema(src, length) : mg[1] + (src - mg[1]) / (length * math.pow(src / mg[1], 4))
        result := mg
        result
    result

// Moving Average
MAtrend = ma(MA_Type, close, length)
MA_Value_HTF = request.security(syminfo.tickerid, TimeFrame_Trend, MAtrend)

// Get minutes for current and higher timeframes
// Function to convert a timeframe string to its equivalent in minutes
timeframeToMinutes(tf) =>
    multiplier = 1
    if (str.endswith(tf, "D"))
        multiplier := 1440
    else if (str.endswith(tf, "W"))
        multiplier := 10080
    else if (str.endswith(tf, "M"))
        multiplier := 43200
    else if (str.endswith(tf, "H"))
        multiplier := int(str.tonumber(str.replace(tf, "H", "")))
    else
        multiplier := int(str.tonumber(str.replace(tf, "m", "")))
    multiplier

// Get minutes for current and higher timeframes
currentTFMinutes = timeframeToMinutes(timeframe.period)
higherTFMinutes = timeframeToMinutes(TimeFrame_Trend)

// Calculate the smoothing factor
dynamicSmoothing = math.round(higherTFMinutes / currentTFMinutes)
MA_Value_Smooth = ta.sma(MA_Value_HTF, dynamicSmoothing)

// Trend HTF
UP = MA_Value_Smooth > MA_Value_Smooth[1] // Use "UP" Function to use as filter in combination with other indicators
DOWN = MA_Value_Smooth < MA_Value_Smooth[1] // Use "Down" Function to use as filter in combination with other indicators

/////////////////////////////////////////////////////
//////////       Second MA Filter Trend   ///////////
/////////////////////////////////////////////////////
TREND2 = "-------------------- Moving Average 2 --------------------"
Plot_MA2 = input.bool(true, title = "Plot Second MA trend?", inline = "Trend3", group = TREND2)
TimeFrame_Trend2 = input.timeframe(title='HTF', defval='60', inline = "Trend3", group = TREND2)
length2 = input.int(21, title="Length Second MA", minval=1, tooltip = "Number of bars used to measure trend on higher timeframe chart", inline = "Trend4", group = TREND2)
MA_Type2  = input.string(defval="McGinley" , options=["EMA","DEMA","TEMA","SMA","WMA", "HMA", "McGinley"], title="MA type:", inline = "Trend4", group = TREND2)

// Second Moving Average
MAtrend2 = ma(MA_Type2, close, length2)
MA_Value_HTF2 = request.security(syminfo.tickerid, TimeFrame_Trend2, MAtrend2)

// Get minutes for current and higher timeframes
higherTFMinutes2 = timeframeToMinutes(TimeFrame_Trend2)

// Calculate the smoothing factor for the second moving average
dynamicSmoothing2 = math.round(higherTFMinutes2 / currentTFMinutes)
MA_Value_Smooth2 = ta.sma(MA_Value_HTF2, dynamicSmoothing2)

// Trend HTF for the second moving average
UP2 = MA_Value_Smooth2 > MA_Value_Smooth2[1]
DOWN2 = MA_Value_Smooth2 < MA_Value_Smooth2[1]

/////////////////////////////////////////////////////
//////////       Third MA Filter Trend    ///////////
/////////////////////////////////////////////////////
TREND3 = "-------------------- Moving Average 3 --------------------"
Plot_MA3 = input.bool(true, title = "Plot third MA trend?", inline = "Trend5", group = TREND3)
TimeFrame_Trend3 = input.timeframe(title='HTF', defval='240', inline = "Trend5", group = TREND3)
length3 = input.int(50, title="Length third MA", minval=1, tooltip = "Number of bars used to measure trend on higher timeframe chart", inline = "Trend6", group = TREND3)
MA_Type3  = input.string(defval="McGinley" , options=["EMA","DEMA","TEMA","SMA","WMA", "HMA", "McGinley"], title="MA type:", inline = "Trend6", group = TREND3)

// Second Moving Average
MAtrend3 = ma(MA_Type3, close, length3)
MA_Value_HTF3 = request.security(syminfo.tickerid, TimeFrame_Trend3, MAtrend3)

// Get minutes for current and higher timeframes
higherTFMinutes3 = timeframeToMinutes(TimeFrame_Trend3)

// Calculate the smoothing factor for the second moving average
dynamicSmoothing3 = math.round(higherTFMinutes3 / currentTFMinutes)
MA_Value_Smooth3 = ta.sma(MA_Value_HTF3, dynamicSmoothing3)

// Trend HTF for the second moving average
UP3 = MA_Value_Smooth3 > MA_Value_Smooth3[1]
DOWN3 = MA_Value_Smooth3 < MA_Value_Smooth3[1]

/////////////////////////////////////////////////////
//////////         Entry Settings        ////////////
/////////////////////////////////////////////////////
BuySignal = ta.crossover(MA_Value_HTF, MA_Value_HTF2) and UP3 == true
SellSignal = ta.crossunder(MA_Value_HTF, MA_Value_HTF2) and DOWN3 == true
ExitBuy = ta.crossunder(MA_Value_HTF, MA_Value_HTF2)
ExitSell = ta.crossover(MA_Value_HTF, MA_Value_HTF2)

/////////////////////////////////////////////////
///////////       Strategy       ////////////////
///////////      Entry & Exit    ////////////////
///////////         logic        ////////////////
/////////////////////////////////////////////////
// Long
if BuySignal
    strategy.entry("Long", strategy.long, qty = QtyTrade)

if (strategy.position_size > 0 and ExitBuy == true)
    strategy.close(id = "Long", comment = "Close Long")

// Short
if SellSignal
    strategy.entry("Short", strategy.short, qty = QtyTrade)

if (strategy.position_size < 0 and ExitSell == true)
    strategy.close(id = "Short", comment = "Close Short")

/////////////////////////////////////////////////////
//////////         Visuals Chart         ////////////
/////////////////////////////////////////////////////
// Plot Moving Average HTF
p1 = plot(Plot_MA ? MA_Value_Smooth : na, "HTF Trend", color = UP ? color.rgb(238, 255, 0) : color.rgb(175, 173, 38), linewidth = 1, style = plot.style_line)
p2 = plot(Plot_MA2 ? MA_Value_Smooth2 : na, "HTF Trend", color = UP2 ? color.rgb(0, 132, 255) : color.rgb(0, 17, 255), linewidth = 1, style = plot.style_line)
plot(Plot_MA3 ? MA_Value_Smooth3 : na, "HTF Trend", color = UP3 ? color.rgb(0, 255, 8) : color.rgb(255, 0, 0), linewidth = 2, style = plot.style_line)
fill(p1, p2, color = color.rgb(255, 208, 0, 90), title="Fill")