ঐতিহাসিক প্রবণতা mutagenesis কৌশল
ওভারভিউ
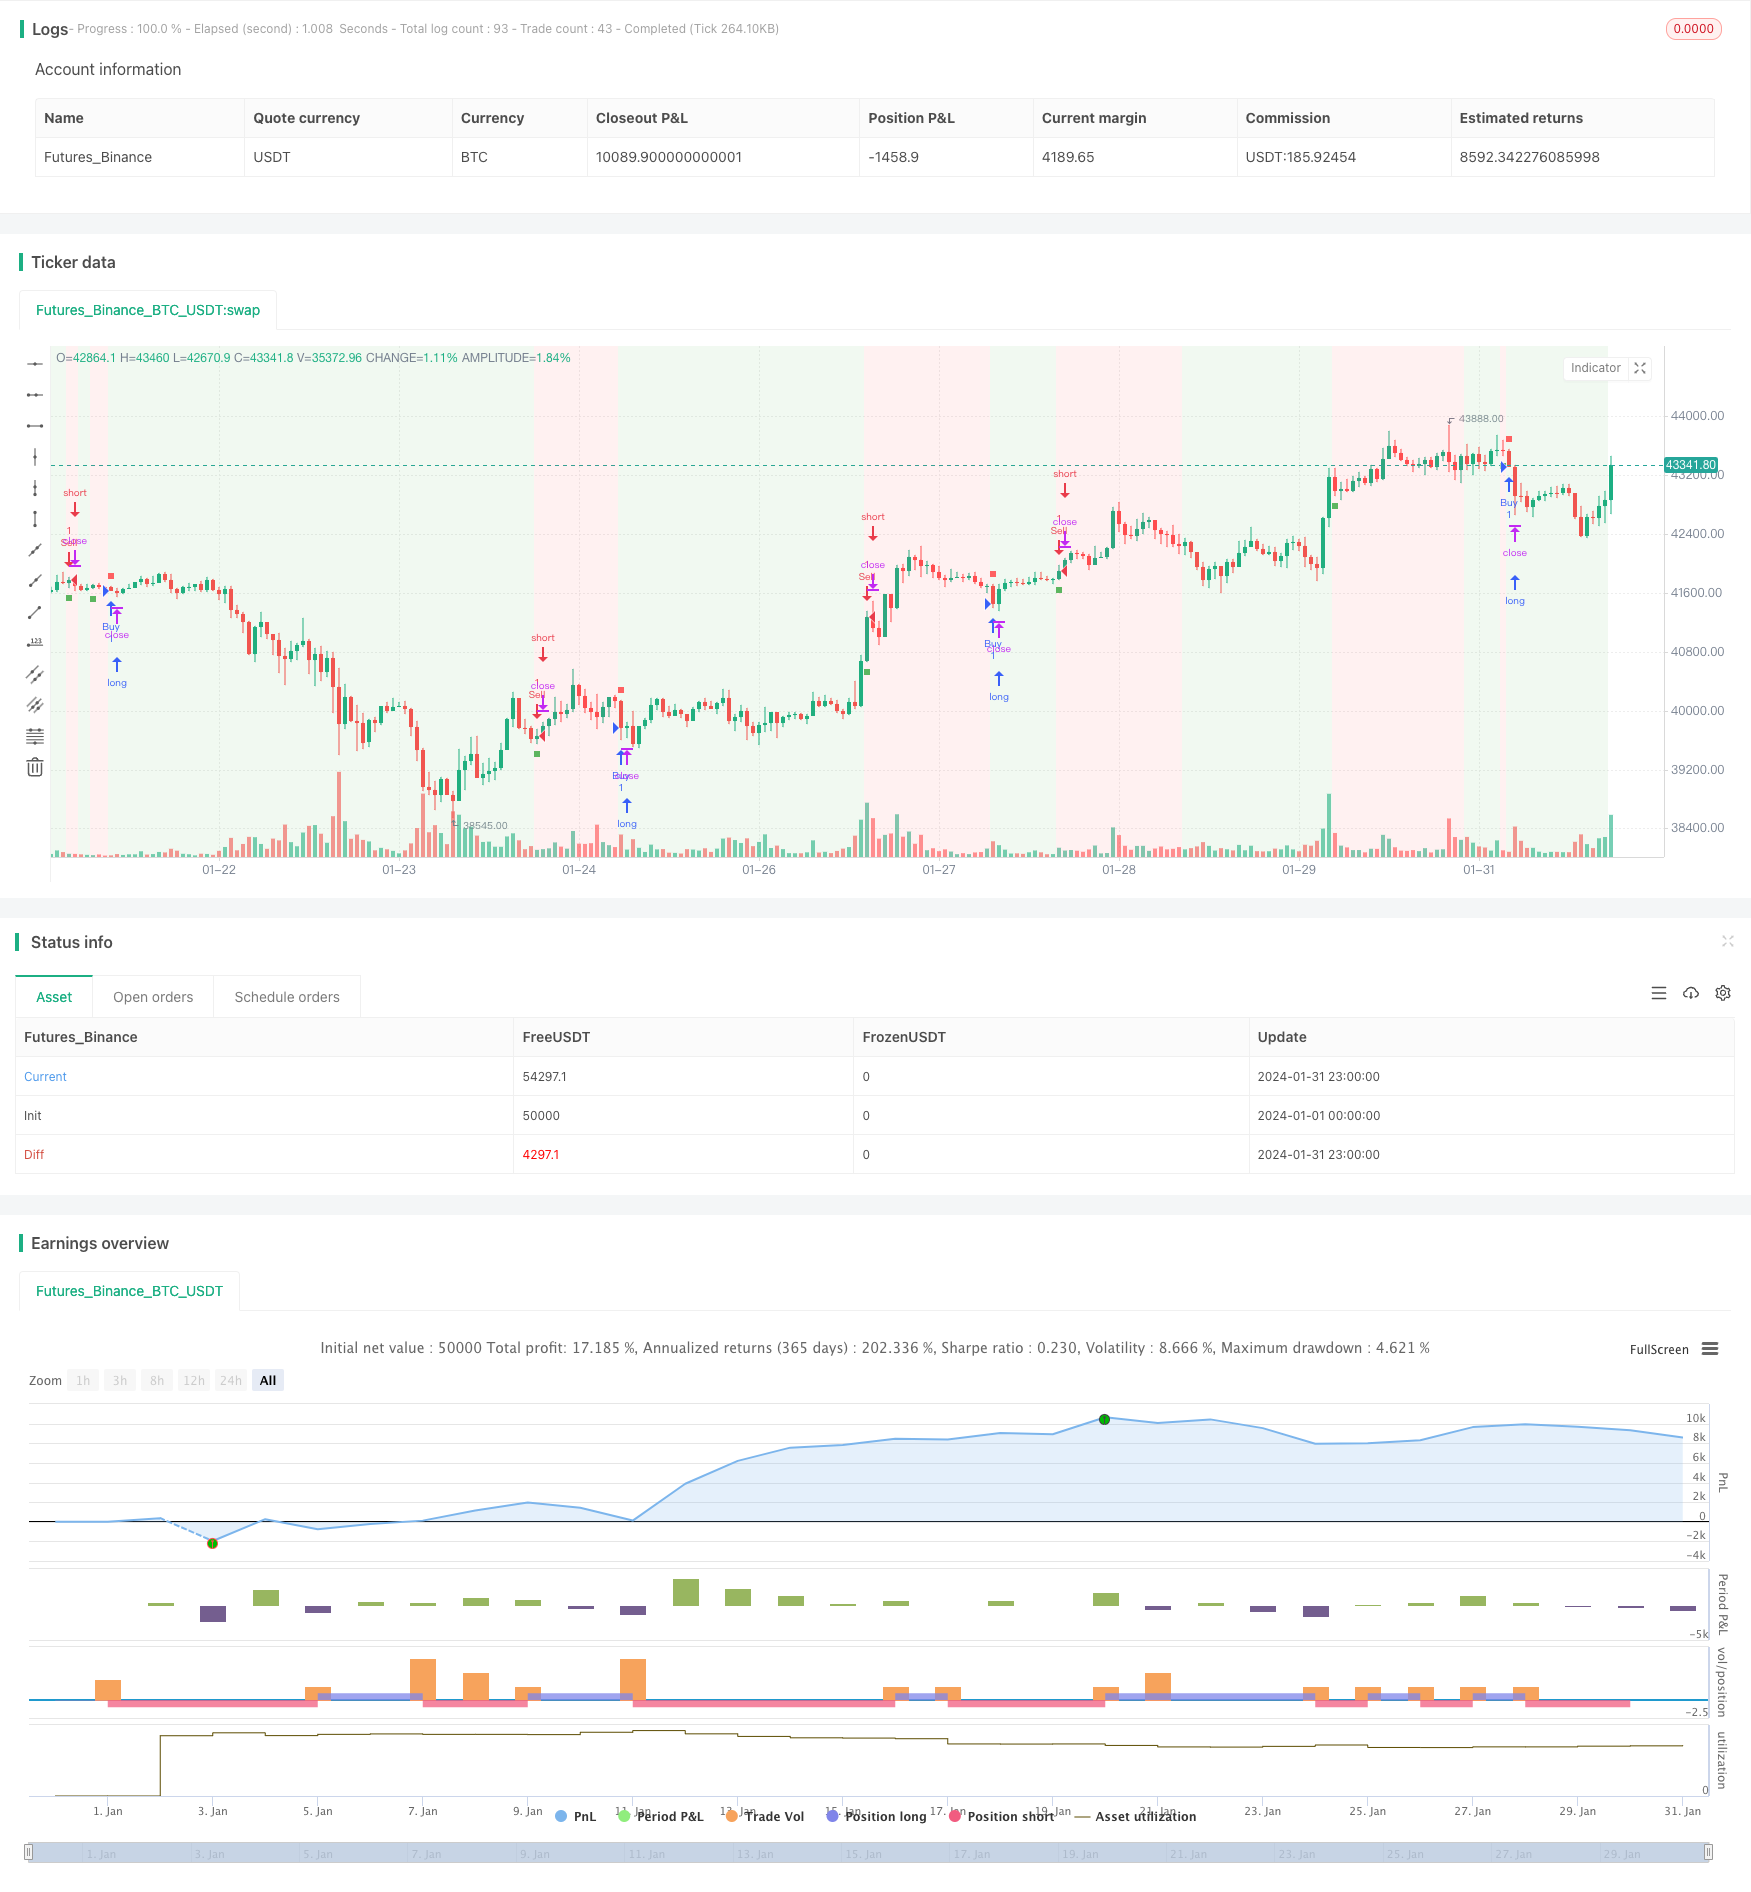
ঐতিহাসিক প্রবণতা প্রলোভন কৌশলটি বাজার প্রবণতা বিপরীত পয়েন্ট সনাক্ত করার জন্য ঘূর্ণন সূচক ব্যবহার করে এবং সূচকীয় চলমান গড়ের সাথে মিলিত হয়ে ট্রেডিং সিগন্যাল তৈরি করে, যার লক্ষ্য অনুকূল প্রবণতা ধরা। এই কৌশলটি চতুরভাবে ঘূর্ণন সূচক এবং চলমান গড়ের ব্যবহারের সুবিধাগুলিকে একত্রিত করে, যা কার্যকরভাবে বাজার প্রবণতা নির্ধারণ করে এবং ট্রেডিং নির্দেশনা সরবরাহ করে।
মূল ব্যাখ্যা
প্রবাহের পরিমাপ- দামের ইতিবাচক ও নেতিবাচক গতিবিধি বিশ্লেষণ করে প্রবণতার দিকনির্দেশ এবং শক্তি নির্ধারণ করুন। প্রধান প্যারামিটারগুলির মধ্যে রয়েছে চক্রের দৈর্ঘ্য, গুণক এবং হ্রাস।
সূচকীয় চলমান গড়- সমাপ্তি মূল্যের উপর সূচক মসৃণকরণ, আরো প্রবাহিত প্রবণতা বিচার প্রদান। চলন্ত গড়ের দীর্ঘতর সময়কাল, প্রবণতা বিচার আরো স্থিতিশীল।
এই কৌশলটি বাজারটির মূল প্রবণতার দিকনির্দেশের জন্য ঘূর্ণমান সূচক ব্যবহার করে। যখন সূচক লাইনটি থ্রেশহোল্ড অতিক্রম করে তখন একটি লেনদেনের সংকেত উত্পন্ন করে। মুভিং গড়ের সাথে মিলিতভাবে ফিল্টার করা, ভুল সংকেত এড়ানো। বিশেষত, যখন ঘূর্ণমান সূচক লাইনটি অতিক্রম করে এবং দামটি চলমান গড়ের চেয়ে বেশি থাকে তখন একটি কেনার সংকেত উত্পন্ন হয়। যখন ঘূর্ণমান সূচক নীচে ঘূর্ণমান লাইনটি অতিক্রম করে এবং দামটি চলমান গড়ের চেয়ে কম থাকে তখন বিক্রয় সংকেত উত্পন্ন হয়।
সামর্থ্য বিশ্লেষণ
- সম্ভাব্য প্রবণতা পাল্টানোর সুযোগগুলিকে সময়মতো ধরার জন্য প্রবাহের সূচকগুলির বিপরীতমুখী সনাক্তকরণের ক্ষমতা ব্যবহার করুন
- চলমান গড়ের সাথে সংকেত ফিল্টার করুন যাতে অস্থিরতার সময় ভুল ট্রেডিং এড়ানো যায়
- প্যারামিটার অপ্টিমাইজেশান, কৌশল সংবেদনশীলতা সমন্বয়, বিভিন্ন বাজার পরিবেশের জন্য উপযুক্ত
- স্বজ্ঞাত ইন্টারফেস এবং পরিষ্কার ট্রেডিং সিগন্যাল, রিয়েল-ডিস্ক অপারেশন সহজতর
ঝুঁকি বিশ্লেষণ
- অপ্রত্যাশিত ঘটনার জন্য সতর্কতা অবলম্বন করুন
- ভূমিকম্পের সময় ভুল সংকেত বেশি হতে পারে
- ভুল প্যারামিটার সেট করাও অত্যধিক র্যাডিক্যাল বা রক্ষণশীল হতে পারে
- একক ক্ষতি নিয়ন্ত্রণের জন্য উপযুক্ত স্টপ লস প্রয়োজন
ঝুঁকির জন্য, অতিরিক্ত ফিল্টার যুক্ত করে, একাধিক সূচক বিচার, প্যারামিটার সেটিং অনুকূলিতকরণ এবং উপযুক্ত স্টপ লস সেট করে প্রতিক্রিয়া জানানো যেতে পারে।
অপ্টিমাইজেশান দিক
- বিভিন্ন ধরণের মুভিং এভারেজ পরীক্ষা করে দেখুন কোনটা সবচেয়ে ভালো হবে
- সর্বোত্তম রিটার্নের জন্য ক্যালকুলেটর এবং চলমান গড়ের প্যারামিটারগুলি সামঞ্জস্য করুন
- একাধিক সময়কালের মধ্যে কৌশল স্থিতিশীলতা পরীক্ষা
- ব্রিন ব্যান্ডের মতো সূচক ফিল্টার সংকেত যোগ করুন
- নির্দিষ্ট জাতের জন্য প্যারামিটারগুলিকে সংজ্ঞায়িত করা
সারসংক্ষেপ
ঐতিহাসিক প্রবণতা প্রলোভন কৌশল সামগ্রিকভাবে বেশ স্থিতিশীল, সম্ভাব্য প্রবণতা বিপরীত ধরার সময় একটি নির্দিষ্ট ফিল্টারিং ক্ষমতা রয়েছে। প্যারামিটার অপ্টিমাইজেশন এবং ঝুঁকি ব্যবস্থাপনার সহায়তায় এই কৌশলটি আরও ভাল রিটার্নের হার অর্জন করতে পারে। এটি পরামর্শ দেওয়া হয় যে ব্যবসায়ীরা বাস্তব পোস্টে সম্পূর্ণরূপে যাচাই করে এবং এই কৌশলটির ভিত্তিতে উদ্ভাবনী সম্প্রসারণের চেষ্টা করতে পারে।
/*backtest
start: 2024-01-01 00:00:00
end: 2024-01-31 23:59:59
period: 1h
basePeriod: 15m
exchanges: [{"eid":"Futures_Binance","currency":"BTC_USDT"}]
*/

// This work is licensed under a Attribution-NonCommercial-ShareAlike 4.0 International (CC BY-NC-SA 4.0) https://creativecommons.org/licenses/by-nc-sa/4.0/
// © AstroHub

//@version=5
strategy("Vortex Strategy [AstroHub]", shorttitle="VS [AstroHub]", overlay=true)

// Vortex Indicator Settings
length = input(14, title="Length", group ="AstroHub Vortex Strategy", tooltip="Number of bars used in the Vortex Indicator calculation. Higher values may result in smoother but slower responses to price changes.")
mult = input(1.0, title="Multiplier", group ="AstroHub Vortex Strategy", tooltip="Multiplier for the Vortex Indicator calculation. Adjust to fine-tune the sensitivity of the indicator to price movements.")
threshold = input(0.5, title="Threshold",group ="AstroHub Vortex Strategy",  tooltip="Threshold level for determining the trend. Higher values increase the likelihood of a trend change being identified.")
emaLength = input(20, title="EMA Length", group ="AstroHub Vortex Strategy", tooltip="Length of the Exponential Moving Average (EMA) used in the strategy. A longer EMA may provide a smoother trend indication.")

// Calculate Vortex Indicator components
a = math.abs(close - close[1])
b = close - ta.sma(close, length)
shl = ta.ema(b, length)
svl = ta.ema(a, length)

// Determine trend direction
upTrend = shl > svl
downTrend = shl < svl

// Define Buy and Sell signals
buySignal = ta.crossover(shl, svl) and close > ta.ema(close, emaLength) and (upTrend != upTrend[1])
sellSignal = ta.crossunder(shl, svl) and close < ta.ema(close, emaLength) and (downTrend != downTrend[1])

// Execute strategy based on signals
strategy.entry("Sell", strategy.short, when=buySignal)
strategy.entry("Buy", strategy.long, when=sellSignal)

// Background color based on the trend
bgcolor(downTrend ? color.new(color.green, 90) : upTrend ? color.new(color.red, 90) : na)

// Plot Buy and Sell signals with different shapes and colors
buySignal1 = ta.crossover(shl, svl) and close > ta.ema(close, emaLength)
sellSignal1 = ta.crossunder(shl, svl) and close < ta.ema(close, emaLength)

plotshape(buySignal1, style=shape.square, color=color.new(color.green, 10), size=size.tiny, location=location.belowbar, title="Buy Signal")
plotshape(sellSignal1, style=shape.square, color=color.new(color.red, 10), size=size.tiny, location=location.abovebar, title="Sell Signal")
plotshape(buySignal1, style=shape.square, color=color.new(color.green, 90), size=size.small, location=location.belowbar, title="Buy Signal")
plotshape(sellSignal1, style=shape.square, color=color.new(color.red, 90), size=size.small, location=location.abovebar, title="Sell Signal")