
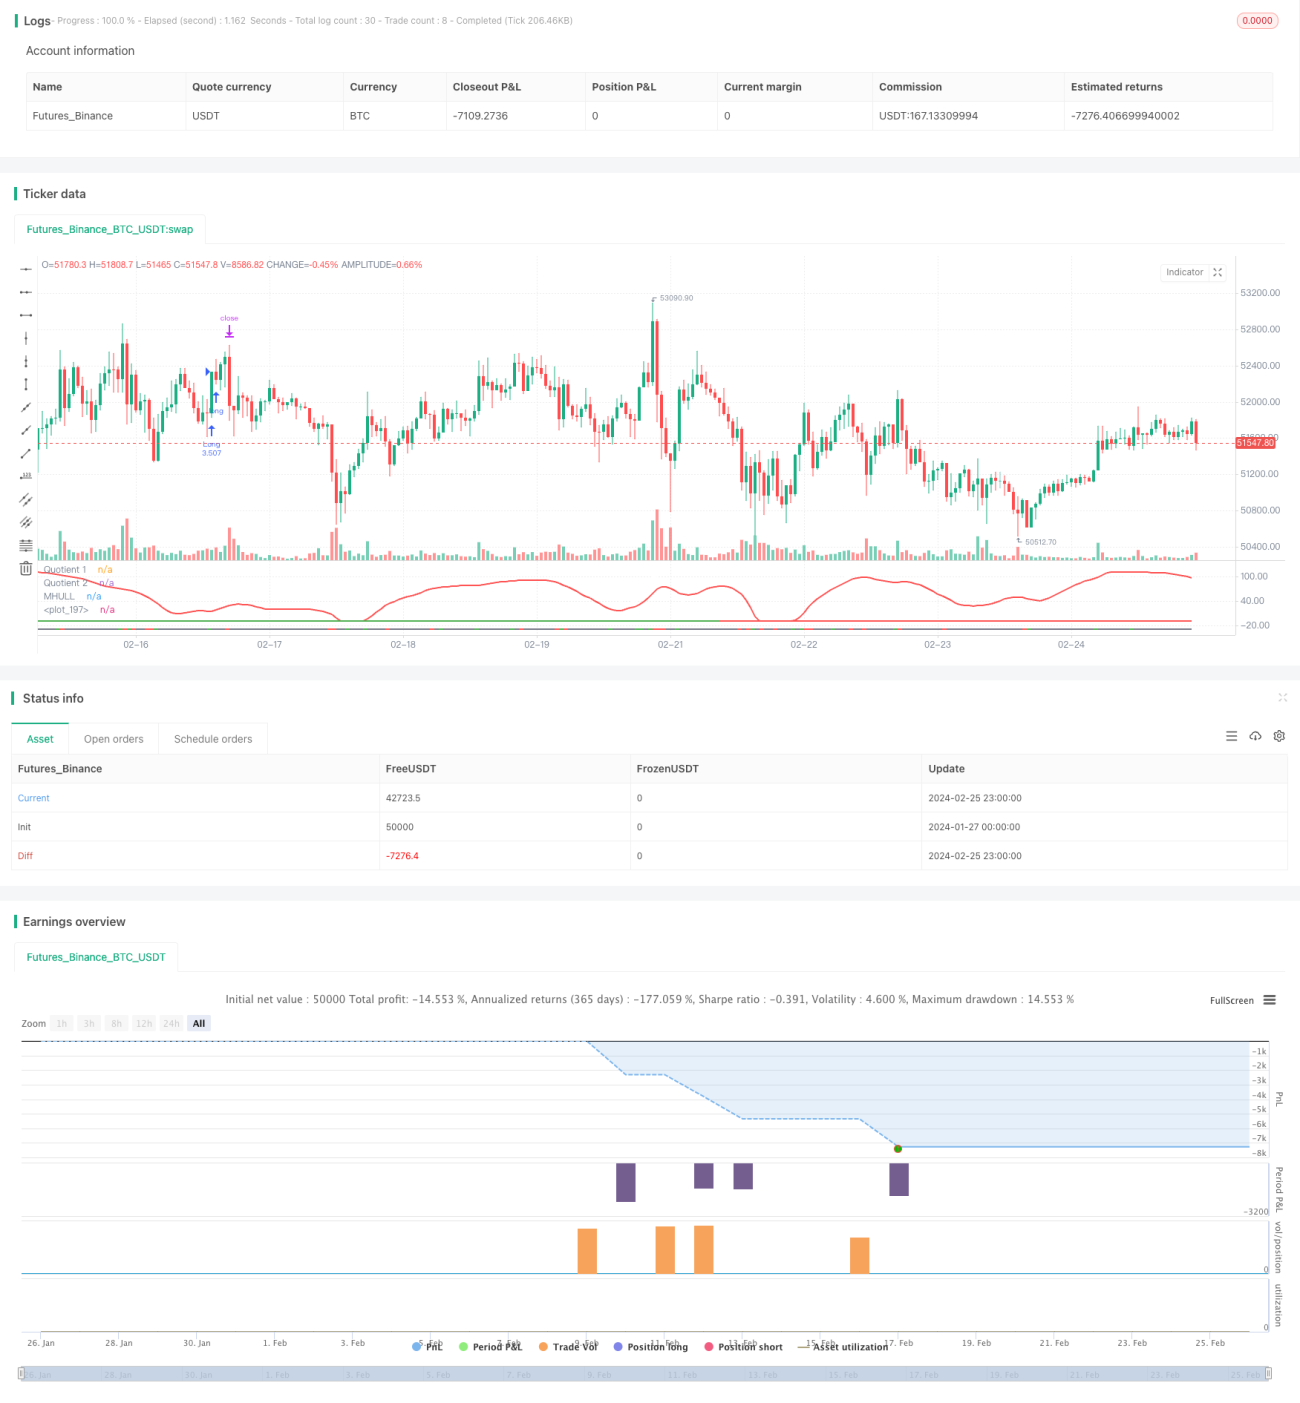
এই কৌশলটি একটি প্রবণতা-অনুসরণ এবং একাধিক সময় ফ্রেমওয়ার্কের মধ্যে ব্যবসায়ের ব্রেক-আপের একটি পরিমাণগত কৌশল বাস্তবায়নের জন্য তিনটি সূচক, বুম হান্টার (Boom Hunter), হুল স্যুট (Hull Suite) এবং অস্থিরতা দোলক (Volatility Oscillator) এর সমন্বয় করে। এই কৌশলটি বিটকয়েনের মতো উচ্চ অস্থিরতা এবং আকস্মিক মূল্যের পরিস্থিতিতে ডিজিটাল সম্পদের জন্য প্রযোজ্য।
এই কৌশলটির মূল যুক্তি নিম্নলিখিত তিনটি সূচকের উপর ভিত্তি করেঃ
বুম হান্টার: একটি ওসিলারেটর যা সূচক সংকোচনের প্রযুক্তি ব্যবহার করে ক্রয় এবং বিক্রয় সংকেত নির্ধারণ করে।
হুল স্যুট: একটি সমতল চলমান গড়রেখার সূচক, যা মধ্যম এবং উপরের এবং নীচের রেলের সম্পর্কের মাধ্যমে প্রবণতার দিক নির্ধারণ করে।
ভোলটাইলিটি ওসিলেটর: একটি পরিমাপযোগ্য মূল্য ওঠানামা তথ্যের দোলনকারী সূচক।
এই কৌশলটির প্রবেশের যৌক্তিকতা হ’ল, যখন রেশমি হান্টারের দুটি কোটিয়েন্ট সূচক উপরে বা নীচে ক্রস হয়, তখন দামটি হেরের মধ্যম ট্র্যাকটি ভেঙে দেয় এবং উপরের ট্র্যাক বা নীচের ট্র্যাকের সাথে বিপরীত হয়, meanwhile ওভারবড ওভারসোল অঞ্চলে ওভারবড সূচকটি রয়েছে। এটি কিছু মিথ্যা ব্রেকিং সংকেতগুলি ফিল্টার করতে পারে এবং প্রবেশের নির্ভুলতা বাড়িয়ে তুলতে পারে।
স্টপ লস নির্ধারণ করা হয় একটি নির্দিষ্ট সময়ের মধ্যে নিম্নতম উপত্যকা বা সর্বোচ্চ শিখর খুঁজে বের করে (ডিফল্ট 20 কে লাইন) এবং মুনাফা অর্জিত হয় স্টপ লস শতাংশ দ্বারা কনফিগারেশন স্টপ অনুপাত (ডিফল্ট 3 গুণ) । পজিশনের অবস্থানটি অ্যাকাউন্টের মোট সম্পদের শতাংশ (ডিফল্ট 3%) এবং নির্দিষ্ট মানের স্টপ লস বেধের উপর ভিত্তি করে গণনা করা হয়।
সমাধানঃ
এই কৌশলটি নিম্নলিখিত দিকগুলি থেকে উন্নত করা যেতে পারেঃ
প্যারামিটার অপ্টিমাইজেশান: চক্রের দৈর্ঘ্য, কম্প্রেশন ফ্যাক্টর ইত্যাদির মতো সূচক প্যারামিটার পরিবর্তন করে সর্বোত্তম প্যারামিটার সমন্বয় অর্জন করুন
সময়সীমা অপ্টিমাইজেশান: বিভিন্ন সময়কাল পরীক্ষা করুন (১ মিনিট, ৫ মিনিট, ৩০ মিনিট ইত্যাদি) এবং সবচেয়ে উপযুক্ত ট্রেডিং সময়কাল খুঁজুন
অবস্থান অপ্টিমাইজেশান: প্রতিটি লেনদেনের জন্য পজিশনের আকার এবং অনুপাত পরিবর্তন করুন, অর্থের সর্বোত্তম ব্যবহার খুঁজে বের করুন
স্টপ লস অপ্টিমাইজেশান: বিভিন্ন লেনদেনের উপর ভিত্তি করে স্টপ লস পজিশনের সমন্বয়, সর্বোত্তম রিস্ক-রিটার্ন অনুপাত অর্জনের জন্য
শর্ত অপ্টিমাইজেশান: সূচক ফিল্টারিং শর্ত বাড়ানো বা হ্রাস করা, আরও সঠিক প্রবেশের সময়
এই কৌশলটি প্যাটার্ন হান্টার, হের স্যুট এবং অস্থিরতা ওসিলার তিনটি সূচকের সমন্বয় ব্যবহার করে, একাধিক সময় ফ্রেমের মধ্যে ট্রেন্ড ট্র্যাকিং ট্রেডিং সক্ষম করে, দামের অপ্রত্যাশিত আচরণকে কার্যকরভাবে সনাক্ত করতে সক্ষম হয়, উচ্চ অস্থিরতার সাথে ডিজিটাল সম্পদের জন্য প্রযোজ্য। এই কৌশলটি ঝুঁকি নিয়ন্ত্রণযোগ্য, প্যারামিটার, ঘূর্ণিঝড়ের পরিস্থিতি এবং ক্ষতি বন্ধের মতো বিভিন্ন দিক থেকে অপ্টিমাইজ করা যায়, শক্তিশালী বাস্তবতা এবং স্কেলযোগ্যতা রয়েছে।
/*backtest
start: 2024-01-27 00:00:00
end: 2024-02-26 00:00:00
period: 1h
basePeriod: 15m
exchanges: [{"eid":"Futures_Binance","currency":"BTC_USDT"}]
*/
// Strategy based on the 3 indicators:
// - Boom Hunter Pro
// - Hull Suite
// - Volatility Oscillator
//
// Strategy was designed for the purpose of back testing.
// See strategy documentation for info on trade entry logic.
//
// Credits:
// - Boom Hunter Pro: veryfid (https://www.tradingview.com/u/veryfid/)
// - Hull Suite: InSilico (https://www.tradingview.com/u/InSilico/)
// - Volatility Oscillator: veryfid (https://www.tradingview.com/u/veryfid/)
//@version=5
strategy("Boom Hunter + Hull Suite + Volatility Oscillator Strategy", overlay=false, initial_capital=1000, currency=currency.NONE, max_labels_count=500, default_qty_type=strategy.cash, commission_type=strategy.commission.percent, commission_value=0.01)
// =============================================================================
// STRATEGY INPUT SETTINGS
// =============================================================================
// ---------------
// Risk Management
// ---------------
swingLength = input.int(20, "Swing High/Low Lookback Length", group='Strategy: Risk Management', tooltip='Stop Loss is calculated by the swing high or low over the previous X candles')
accountRiskPercent = input.float(3, "Account percent loss per trade", step=0.1, group='Strategy: Risk Management', tooltip='Each trade will risk X% of the account balance')
profitFactor = input.float(3, "Profit Factor (R:R Ratio)", step = 0.1, group='Strategy: Risk Management')
// ----------
// Date Range
// ----------
start_year = input.int(title='Start Date', defval=2022, minval=2010, maxval=3000, group='Strategy: Date Range', inline='1')
start_month = input.int(title='', defval=1, group='Strategy: Date Range', inline='1', options = [1, 2, 3, 4, 5, 6, 7, 8, 9, 10, 11, 12])
start_date = input.int(title='', defval=1, group='Strategy: Date Range', inline='1', options = [1, 2, 3, 4, 5, 6, 7, 8, 9, 10, 11, 12, 13, 14, 15, 16, 17, 18, 19, 20, 21, 22, 23, 24, 25, 26, 27, 28, 29, 30, 31])
end_year = input.int(title='End Date', defval=2023, minval=1800, maxval=3000, group='Strategy: Date Range', inline='2')
end_month = input.int(title='', defval=1, group='Strategy: Date Range', inline='2', options = [1, 2, 3, 4, 5, 6, 7, 8, 9, 10, 11, 12])
end_date = input.int(title='', defval=1, group='Strategy: Date Range', inline='2', options = [1, 2, 3, 4, 5, 6, 7, 8, 9, 10, 11, 12, 13, 14, 15, 16, 17, 18, 19, 20, 21, 22, 23, 24, 25, 26, 27, 28, 29, 30, 31])
in_date_range = true
// =============================================================================
// INDICATORS
// =============================================================================
// ---------------
// Boom Hunter Pro
// ---------------
square = input.bool(true, title='Square Line?', group='Main Settings')
//Quotient
LPPeriod = input.int(6, title='Quotient | LPPeriod', inline='quotient', group='EOT 1 (Main Oscillator)')
K1 = input.int(0, title='K1', inline='quotient', group='EOT 1 (Main Oscillator)')
esize = 60 //, title = "Size", inline = "quotient2", group = "EOT 1 (Main Oscillator)")
ey = 50 //, title = "Y axis", inline = "quotient2", group = "EOT 1 (Main Oscillator)")
trigno = input.int(1, 'Trigger Length', group='EOT 1 (Main Oscillator)', inline='quotient2')
trigcol = input.color(color.white, title='Trigger Color:', group='EOT 1 (Main Oscillator)', inline='q2')
// EOT 2
//Inputs
LPPeriod2 = input.int(28, title='LPPeriod2', group='EOT 2 (Red Wave)', inline='q2')
K22 = input.float(0.3, title='K2', group='EOT 2 (Red Wave)', inline='q2')
//EOT 1
//Vars
alpha1 = 0.00
HP = 0.00
a1 = 0.00
b1 = 0.00
c1 = 0.00
c2 = 0.00
c3 = 0.00
Filt = 0.00
Peak = 0.00
X = 0.00
Quotient1 = 0.00
pi = 2 * math.asin(1)
//Highpass filter cyclic components
//whose periods are shorter than 100 bars
alpha1 := (math.cos(.707 * 2 * pi / 100) + math.sin(.707 * 2 * pi / 100) - 1) / math.cos(.707 * 2 * pi / 100)
HP := (1 - alpha1 / 2) * (1 - alpha1 / 2) * (close - 2 * nz(close[1]) + nz(close[2])) + 2 * (1 - alpha1) * nz(HP[1]) - (1 - alpha1) * (1 - alpha1) * nz(HP[2])
//SuperSmoother Filter
a1 := math.exp(-1.414 * pi / LPPeriod)
b1 := 2 * a1 * math.cos(1.414 * pi / LPPeriod)
c2 := b1
c3 := -a1 * a1
c1 := 1 - c2 - c3
Filt := c1 * (HP + nz(HP[1])) / 2 + c2 * nz(Filt[1]) + c3 * nz(Filt[2])
//Fast Attack - Slow Decay Algorithm
Peak := .991 * nz(Peak[1])
if math.abs(Filt) > Peak
Peak := math.abs(Filt)
Peak
//Normalized Roofing Filter
if Peak != 0
X := Filt / Peak
X
Quotient1 := (X + K1) / (K1 * X + 1)
// EOT 2
//Vars
alpha1222 = 0.00
HP2 = 0.00
a12 = 0.00
b12 = 0.00
c12 = 0.00
c22 = 0.00
c32 = 0.00
Filt2 = 0.00
Peak2 = 0.00
X2 = 0.00
Quotient4 = 0.00
alpha1222 := (math.cos(.707 * 2 * pi / 100) + math.sin(.707 * 2 * pi / 100) - 1) / math.cos(.707 * 2 * pi / 100)
HP2 := (1 - alpha1222 / 2) * (1 - alpha1222 / 2) * (close - 2 * nz(close[1]) + nz(close[2])) + 2 * (1 - alpha1222) * nz(HP2[1]) - (1 - alpha1222) * (1 - alpha1222) * nz(HP2[2])
//SuperSmoother Filter
a12 := math.exp(-1.414 * pi / LPPeriod2)
b12 := 2 * a12 * math.cos(1.414 * pi / LPPeriod2)
c22 := b12
c32 := -a12 * a12
c12 := 1 - c22 - c32
Filt2 := c12 * (HP2 + nz(HP2[1])) / 2 + c22 * nz(Filt2[1]) + c32 * nz(Filt2[2])
//Fast Attack - Slow Decay Algorithm
Peak2 := .991 * nz(Peak2[1])
if math.abs(Filt2) > Peak2
Peak2 := math.abs(Filt2)
Peak2
//Normalized Roofing Filter
if Peak2 != 0
X2 := Filt2 / Peak2
X2
Quotient4 := (X2 + K22) / (K22 * X2 + 1)
q4 = Quotient4 * esize + ey
//Plot EOT
q1 = Quotient1 * esize + ey
trigger = ta.sma(q1, trigno)
Plot3 = plot(trigger, color=trigcol, linewidth=2, title='Quotient 1')
Plot44 = plot(q4, color=color.new(color.red, 0), linewidth=2, title='Quotient 2')
// ----------
// HULL SUITE
// ----------
//INPUT
src = input(close, title='Source')
modeSwitch = input.string('Hma', title='Hull Variation', options=['Hma', 'Thma', 'Ehma'])
length = input(200, title='Length(180-200 for floating S/R , 55 for swing entry)')
lengthMult = input(2.4, title='Length multiplier (Used to view higher timeframes with straight band)')
useHtf = input(false, title='Show Hull MA from X timeframe? (good for scalping)')
htf = input.timeframe('240', title='Higher timeframe')
//FUNCTIONS
//HMA
HMA(_src, _length) =>
ta.wma(2 * ta.wma(_src, _length / 2) - ta.wma(_src, _length), math.round(math.sqrt(_length)))
//EHMA
EHMA(_src, _length) =>
ta.ema(2 * ta.ema(_src, _length / 2) - ta.ema(_src, _length), math.round(math.sqrt(_length)))
//THMA
THMA(_src, _length) =>
ta.wma(ta.wma(_src, _length / 3) * 3 - ta.wma(_src, _length / 2) - ta.wma(_src, _length), _length)
//SWITCH
Mode(modeSwitch, src, len) =>
modeSwitch == 'Hma' ? HMA(src, len) : modeSwitch == 'Ehma' ? EHMA(src, len) : modeSwitch == 'Thma' ? THMA(src, len / 2) : na
//OUT
_hull = Mode(modeSwitch, src, int(length * lengthMult))
HULL = useHtf ? request.security(syminfo.ticker, htf, _hull) : _hull
MHULL = HULL[0]
SHULL = HULL[2]
//COLOR
hullColor = MHULL > SHULL ? color.green : color.red
//PLOT
///< Frame
Fi1 = plot(-10, title='MHULL', color=hullColor, linewidth=2)
// -----------------
// VOLUME OSCILLATOR
// -----------------
volLength = input(80)
spike = close - open
x = ta.stdev(spike, volLength)
y = ta.stdev(spike, volLength) * -1
volOscCol = spike > x ? color.green : spike < y ? color.red : color.gray
plot(-30, color=color.new(volOscCol, transp=0), linewidth=2)
// =============================================================================
// STRATEGY LOGIC
// =============================================================================
// Boom Hunter Pro entry conditions
boomLong = ta.crossover(trigger, q4)
boomShort = ta.crossunder(trigger, q4)
// Hull Suite entry conditions
hullLong = MHULL > SHULL and close > MHULL
hullShort = MHULL < SHULL and close < SHULL
// Volatility Oscillator entry conditions
volLong = spike > x
volShort = spike < y
inLong = strategy.position_size > 0
inShort = strategy.position_size < 0
longCondition = boomLong and hullLong and volLong and in_date_range
shortCondition = boomShort and hullShort and volShort and in_date_range
swingLow = ta.lowest(source=low, length=swingLength)
swingHigh = ta.highest(source=high, length=swingLength)
atr = ta.atr(14)
longSl = math.min(close - atr, swingLow)
shortSl = math.max(close + atr, swingHigh)
longStopPercent = math.abs((1 - (longSl / close)) * 100)
shortStopPercent = math.abs((1 - (shortSl / close)) * 100)
longTpPercent = longStopPercent * profitFactor
shortTpPercent = shortStopPercent * profitFactor
longTp = close + (close * (longTpPercent / 100))
shortTp = close - (close * (shortTpPercent / 100))
// Position sizing (default risk 3% per trade)
riskAmt = strategy.equity * accountRiskPercent / 100
longQty = math.abs(riskAmt / longStopPercent * 100) / close
shortQty = math.abs(riskAmt / shortStopPercent * 100) / close
if (longCondition and not inLong)
strategy.entry("Long", strategy.long, qty=longQty)
strategy.exit("Long SL/TP", from_entry="Long", stop=longSl, limit=longTp, alert_message='Long SL Hit')
buyLabel = label.new(x=bar_index, y=high[1], color=color.green, style=label.style_label_up)
label.set_y(id=buyLabel, y=-40)
label.set_tooltip(id=buyLabel, tooltip="Risk Amt: " + str.tostring(riskAmt) + " Qty: " + str.tostring(longQty) + " Swing low: " + str.tostring(swingLow) + " Stop Percent: " + str.tostring(longStopPercent) + " TP Percent: " + str.tostring(longTpPercent))
if (shortCondition and not inShort)
strategy.entry("Short", strategy.short, qty=shortQty)
strategy.exit("Short SL/TP", from_entry="Short", stop=shortSl, limit=shortTp, alert_message='Short SL Hit')
sellLabel = label.new(x=bar_index, y=high[1], color=color.red, style=label.style_label_up)
label.set_y(id=sellLabel, y=-40)
label.set_tooltip(id=sellLabel, tooltip="Risk Amt: " + str.tostring(riskAmt) + " Qty: " + str.tostring(shortQty) + " Swing high: " + str.tostring(swingHigh) + " Stop Percent: " + str.tostring(shortStopPercent) + " TP Percent: " + str.tostring(shortTpPercent))