বছরে সামঞ্জস্যের উপর ভিত্তি করে RSI শক ট্রেডিং কৌশল

1
Follow
1782
Followers
ওভারভিউ
এই কৌশলটি একটি বছরের ভিত্তিতে সংশোধিত আরএসআই কম্পন ট্রেডিং কৌশল যা আরএসআই সূচকটি সেট আপ এবং ডাউন ট্রেলের মধ্যে কম্পন বৈশিষ্ট্যগুলি অনুসরণ করে এবং যখন আরএসআই সূচকটি নীচের ট্রেলের সাথে যোগাযোগ করে তখন একটি ট্রেডিং সংকেত দেয়।
কৌশল নীতি
- এমএ গড় লাইন দৈর্ঘ্য, আরএসআই প্যারামিটার, উত্থান-পতন, স্টপ-অফ-লস প্যারামিটার এবং ট্রেডিং চক্রের পরিসর সেট করুন
- আরএসআই সূচকের মান গণনা করুন, আরএসআই = (উত্থানের গড়) / (উত্থানের গড় + পতনের গড়)*100
- আরএসআই সূচক এবং ট্র্যাকিং
- আরএসআই সূচকটি পল্টি সিগন্যাল হিসাবে ট্র্যাকডওভার এবং ফাঁকা সিগন্যাল হিসাবে ট্র্যাকডওভার
- ওসিও তালিকা তৈরির জন্য পজিশন খোলা
- স্টপ লস এবং স্টপ লস সেটআপ লজিক অনুসারে
কৌশলগত শক্তি বিশ্লেষণ
- কিছু অপ্রয়োজনীয় বাহ্যিক পরিবেশ এড়ানো যায় বার্ষিক লেনদেনের সময়কাল নির্ধারণ করে।
- আরএসআই সূচকগুলি ওভার-বিক্রয় ও ওভার-বিক্রয়কে কার্যকরভাবে প্রতিফলিত করতে পারে এবং যুক্তিসঙ্গত ব্যাপ্তি সেট করে অস্থির ট্রেডিংয়ের মাধ্যমে কিছু শব্দ ফিল্টার করতে পারে।
- ওসিও প্যাকেজিং ও স্টপ-অফ-লস সেটিং-এর সাথে যুক্ত, যা কার্যকরভাবে ঝুঁকি নিয়ন্ত্রণ করতে পারে।
কৌশলগত ঝুঁকি বিশ্লেষণ
- RSI সমালোচনামূলক বিচারের সঠিকতা নিশ্চিত করা যায় না, এবং কিছু ভুল বিচারের ঝুঁকি থাকতে পারে।
- বছরের মধ্যে ট্রেডিং চক্রের ভুল সেটআপের ফলে ভাল ট্রেডিং সুযোগ বা অনুপযুক্ত ট্রেডিং পরিবেশে প্রবেশ করা যেতে পারে।
- স্টপ লস পয়েন্ট খুব বড় হলে ক্ষতির সম্ভাবনা বেশি থাকে এবং স্টপ লস পয়েন্ট খুব ছোট হলে লাভের সম্ভাবনা কম থাকে।
RSI প্যারামিটার, ট্রেডিং চক্রের সময়সীমা, স্টপ-অফ-লস অনুপাত ইত্যাদির মাধ্যমে অপ্টিমাইজ করা যায়।
কৌশল অপ্টিমাইজেশনের দিকনির্দেশনা
- বিভিন্ন বাজারে বিভিন্ন পিরিয়ডে RSI প্যারামিটারের সর্বোত্তম মান পরীক্ষা করা
- সামগ্রিক বাজারের চক্রবিধি বিশ্লেষণ করুন এবং বছরের সেরা সময়টি নির্ধারণ করুন
- একটি যুক্তিসঙ্গত স্টপ লস অনুপাত নির্ধারণ করুন
- ট্রেডিং বৈচিত্র্য অপ্টিমাইজ এবং হোল্ডিং স্কেল বৃদ্ধি
- অন্যান্য উন্নত ট্রেডিং কৌশল বা সূচকগুলির সাথে সংযুক্ত করে অপ্টিমাইজ করুন
সারসংক্ষেপ
এই কৌশলটি ট্রেডিংয়ের ঝুঁকিকে কার্যকরভাবে নিয়ন্ত্রণ করে, বছরের মধ্যে নির্দিষ্ট সময়ের মধ্যে RSI সূচকের ঝড়ের বৈশিষ্ট্য দ্বারা ট্রেডিংয়ের প্রবণতা অনুসরণ করে। প্যারামিটার অপ্টিমাইজেশন এবং নিয়ম অপ্টিমাইজেশনের মাধ্যমে উচ্চতর কৌশলগত কার্যকারিতা অর্জন করা যেতে পারে।
Source
Pine
/*backtest
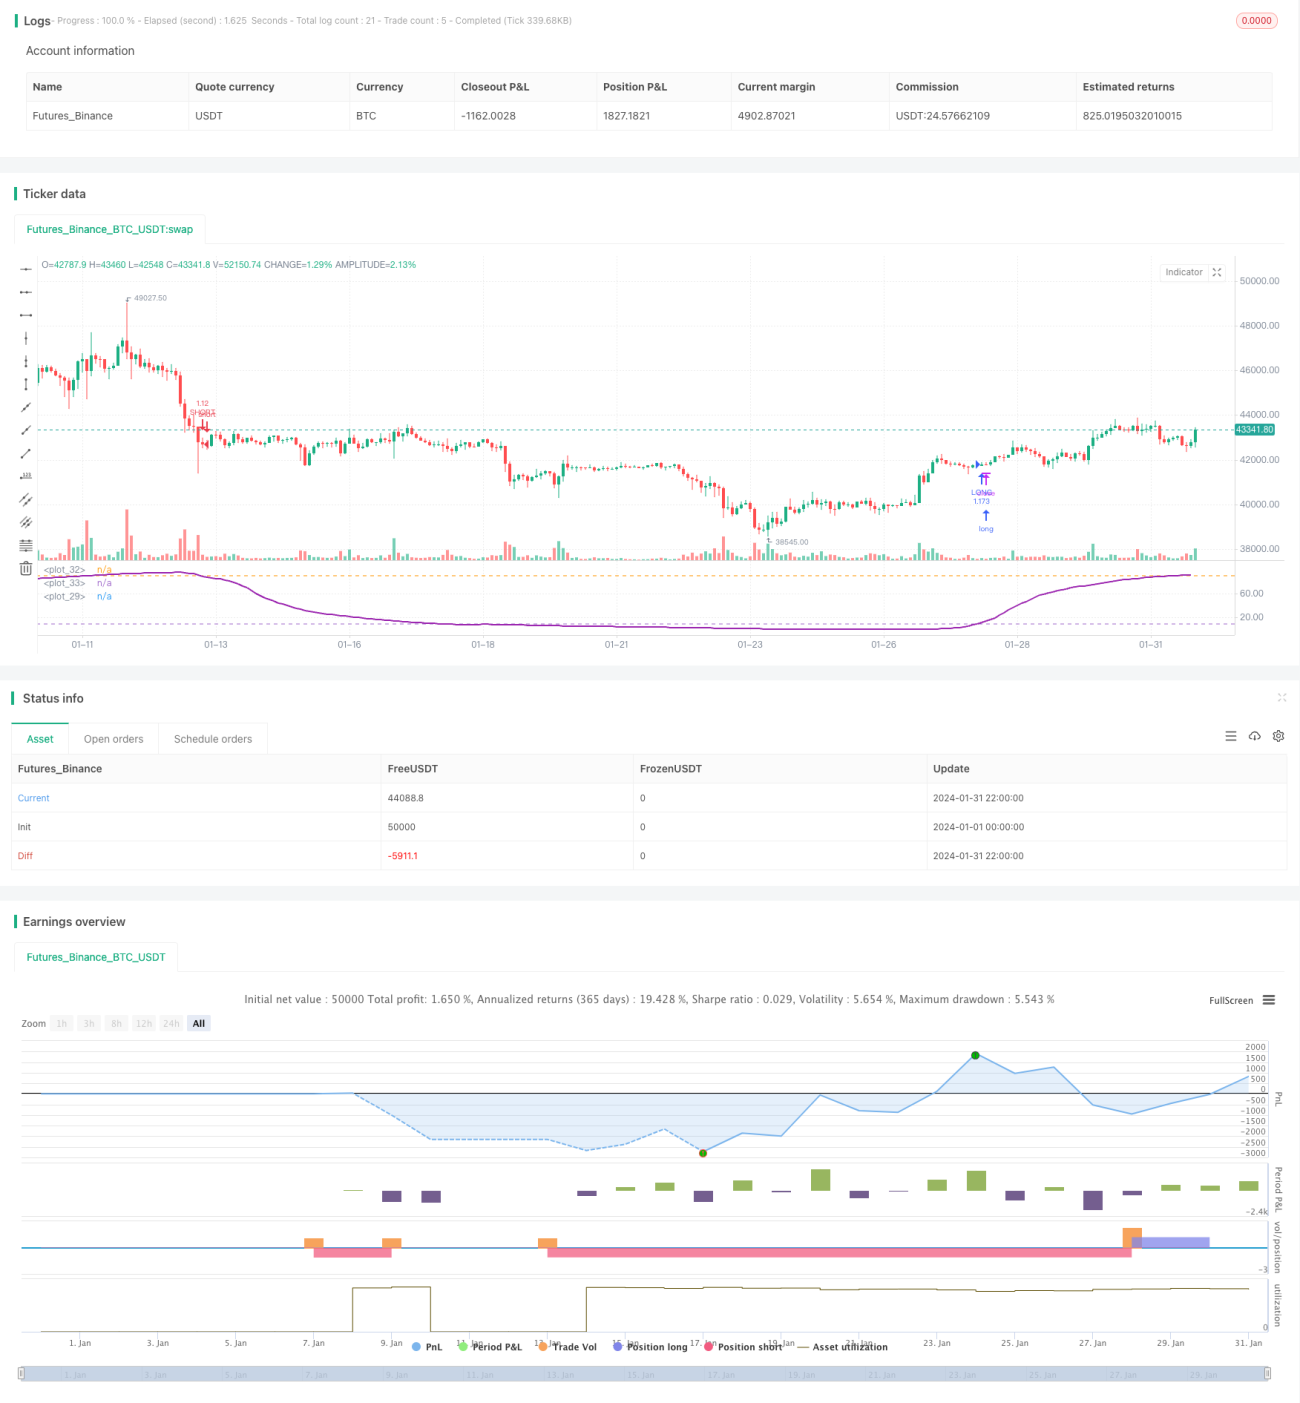
start: 2024-01-01 00:00:00
end: 2024-01-31 23:59:59
period: 2h
basePeriod: 15m
exchanges: [{"eid":"Futures_Binance","currency":"BTC_USDT"}]
*/
//@version=3
strategy(title = "Bitlinc MARSI Study AST",shorttitle="Bitlinc MARSI Study AST",default_qty_type = strategy.percent_of_equity, default_qty_value = 100,commission_type=strategy.commission.percent,commission_value=0.1,initial_capital=1000,currency="USD",pyramiding=0, calc_on_order_fills=false)
// === General Inputs ===Strategy parameters
Related strategies
Comment
All comments (0)
No data
- 1