গতিশীল engulfing প্রবণতা কৌশল উপর ভিত্তি করে
ওভারভিউ
ডায়নামিক গ্রাস ট্রেডিং কৌশল হল এমন একটি কৌশল যা ট্রেডিংয়ের দিকের দিকে ট্রেডিংয়ের উপর ভিত্তি করে ট্রেডিংয়ের উপর ভিত্তি করে ট্রেডিং করে। এই কৌশলটি বাজারের অস্থিরতা সনাক্ত করার জন্য গড় বাস্তব ওঠানামার পরিসীমা (এটিআর) ব্যবহার করে, সুপার ট্রেন্ডিং সূচকটি বাজারের প্রবণতা দিক নির্ধারণ করে, যখন এটি গ্রাসের সাথে সামঞ্জস্যপূর্ণ এবং প্রবণতার সাথে সামঞ্জস্যপূর্ণ হয় তখন একাধিক শূন্য অপারেশন করা হয়। স্টপ লস এবং স্টপ লসও গ্রাসের গতিশীলতার ভিত্তিতে গণনা করা হয়।
কৌশল নীতি
- এটির ব্যবহার মার্কেটের অস্থিরতা পরিমাপ করার জন্য করা হয়।
- সুপার ট্রেন্ডিং সূচকগুলি গণনা করে বাজারের প্রধান প্রবণতা নির্দেশ করে।
- মাল্টি হেড বাজার এবং খালি হেড বাজার শর্তাদি সংজ্ঞায়িত করুন
- ট্রেন্ডের দিকনির্দেশের সাথে মিলিত মাল্টি-হেড গ্রাস (উচ্চমুখী) এবং ফাঁকা-হেড গ্রাস (নিম্নমুখী) রূপগুলি চিহ্নিত করুন।
- স্টপ লস এবং স্টপ স্টপ হিসাব করা হয়।
- ট্রেন্ডের দিকনির্দেশের সাথে সামঞ্জস্যপূর্ণ এবং গ্রাসকারী রূপগুলি সনাক্ত করার সময়, অতিরিক্ত বা খালি অপারেশন করুন।
- যখন দাম স্টপ লস বা স্টপ পজিশন স্পর্শ করে, তখন পজিশন বন্ধ করা হয়।
- চার্টটিতে ইঙ্গিত করা হয়েছে যে, এটি গ্রাস করা হয়েছে।
কৌশলগত শক্তি বিশ্লেষণ
এই কৌশলটির সুবিধাগুলো হলঃ
- ট্রেডিং সিগন্যালের গুণগত মান উন্নত করতে ট্রেডিং সিগন্যালকে ট্রেডিং প্যাটার্ন এবং ট্রেন্ড সনাক্তকরণের সাথে একত্রিত করুন।
- ট্রেন্ডের বিপর্যয় চিহ্নিত করতে সক্ষম হওয়া, লক্ষ্যবস্তু অপারেশন।
- এই পদ্ধতির সাহায্যে, আপনি একটি নির্দিষ্ট সময়সীমার জন্য একটি নির্দিষ্ট সময়সীমার জন্য একটি নির্দিষ্ট সময়সীমা নির্ধারণ করতে পারেন।
- এই কৌশলটি প্রবণতা অনুসরণ করে এবং ঝুঁকি নিয়ন্ত্রণ করে।
- কোড ফ্রেমওয়ার্কটি পরিষ্কার এবং অপ্টিমাইজ করা এবং উন্নত করা সহজ।
কৌশলগত ঝুঁকি বিশ্লেষণ
এই কৌশলটির কিছু ঝুঁকিও রয়েছেঃ
- ভরাট মোডটি একটি ভুয়া ব্রেকথ্রু হতে পারে এবং ভুল সনাক্তকরণ ক্ষতির কারণ হতে পারে।
- এটা কঠিন গলিত ফর্ম্যাট প্যারামিটার, যেমন ভলিউম আকার, সময়কাল, ইত্যাদি বুঝতে।
- প্রবণতা নির্ধারণের প্রক্রিয়াটি অসম্পূর্ণ, যা প্রবণতার সাথে সামঞ্জস্যহীন অপারেশন হতে পারে।
- স্টপ লস এবং স্টপ স্টপ সেটআপ অভিজ্ঞতা নির্ভর এবং খুব বিষয়গত হতে পারে।
- ফলাফলের উপর নির্ভর করে প্যারামিটার অপ্টিমাইজেশান, যার জন্য প্রচুর ঐতিহাসিক তথ্য যাচাইয়ের প্রয়োজন।
উপরোক্ত ঝুঁকির জন্য, নিম্নলিখিত উপায়ে নিয়ন্ত্রণ ও উন্নতি করা যেতে পারেঃ
- অন্যান্য প্রযুক্তিগত সূচকগুলির সাথে মিলিতভাবে, ভুয়া ব্রেকিং সিগন্যালগুলি ফিল্টার করা হয়েছে।
- এটিআর-এর মতো আরও শক্তিশালী প্যারামিটার গণনা পদ্ধতি ব্যবহার করে।
- মেশিন লার্নিং মডেলের মাধ্যমে প্রবণতা নির্ধারণের পদ্ধতির নির্ভরযোগ্যতা বৃদ্ধি করা।
- জিনগত অ্যালগরিদম ইত্যাদির মাধ্যমে সর্বোত্তম প্যারামিটার সমন্বয় খুঁজে বের করা।
- একটি দীর্ঘ সময় উইন্ডোতে পুনরাবৃত্তি করুন, যাতে প্যারামিটারটি স্থিতিশীল থাকে।
কৌশল অপ্টিমাইজেশনের দিকনির্দেশনা
এই কৌশলটি আরও উন্নত করার সুযোগ রয়েছেঃ
- মেশিন লার্নিং মডেলগুলি প্রবণতা নির্ধারণের জন্য সঠিকতা বাড়াতে পারে।
- নতুন আকৃতি সনাক্তকরণ পদ্ধতির সাথে একত্রিত হয়ে, এটি গ্রাসকারী আকৃতির সনাক্তকরণের উন্নতি করে।
- সর্বশেষ স্টপ-স্টপ-লস কৌশল ব্যবহার করে স্টপ-স্টপ-লস পয়েন্টটি গতিশীলভাবে অপ্টিমাইজ করুন।
- উচ্চ-ফ্রিকোয়েন্সি ডেটার উপর ভিত্তি করে, সংক্ষিপ্ত লাইন অপারেশনের জন্য আরও উপযুক্ত গ্রাসকারী কৌশলগুলি বিকাশ করা যেতে পারে।
- প্যারামিটার সমন্বয় এবং অপ্টিমাইজেশনের জন্য বিভিন্ন জাতের জন্য প্রয়োগ করা যেতে পারে।
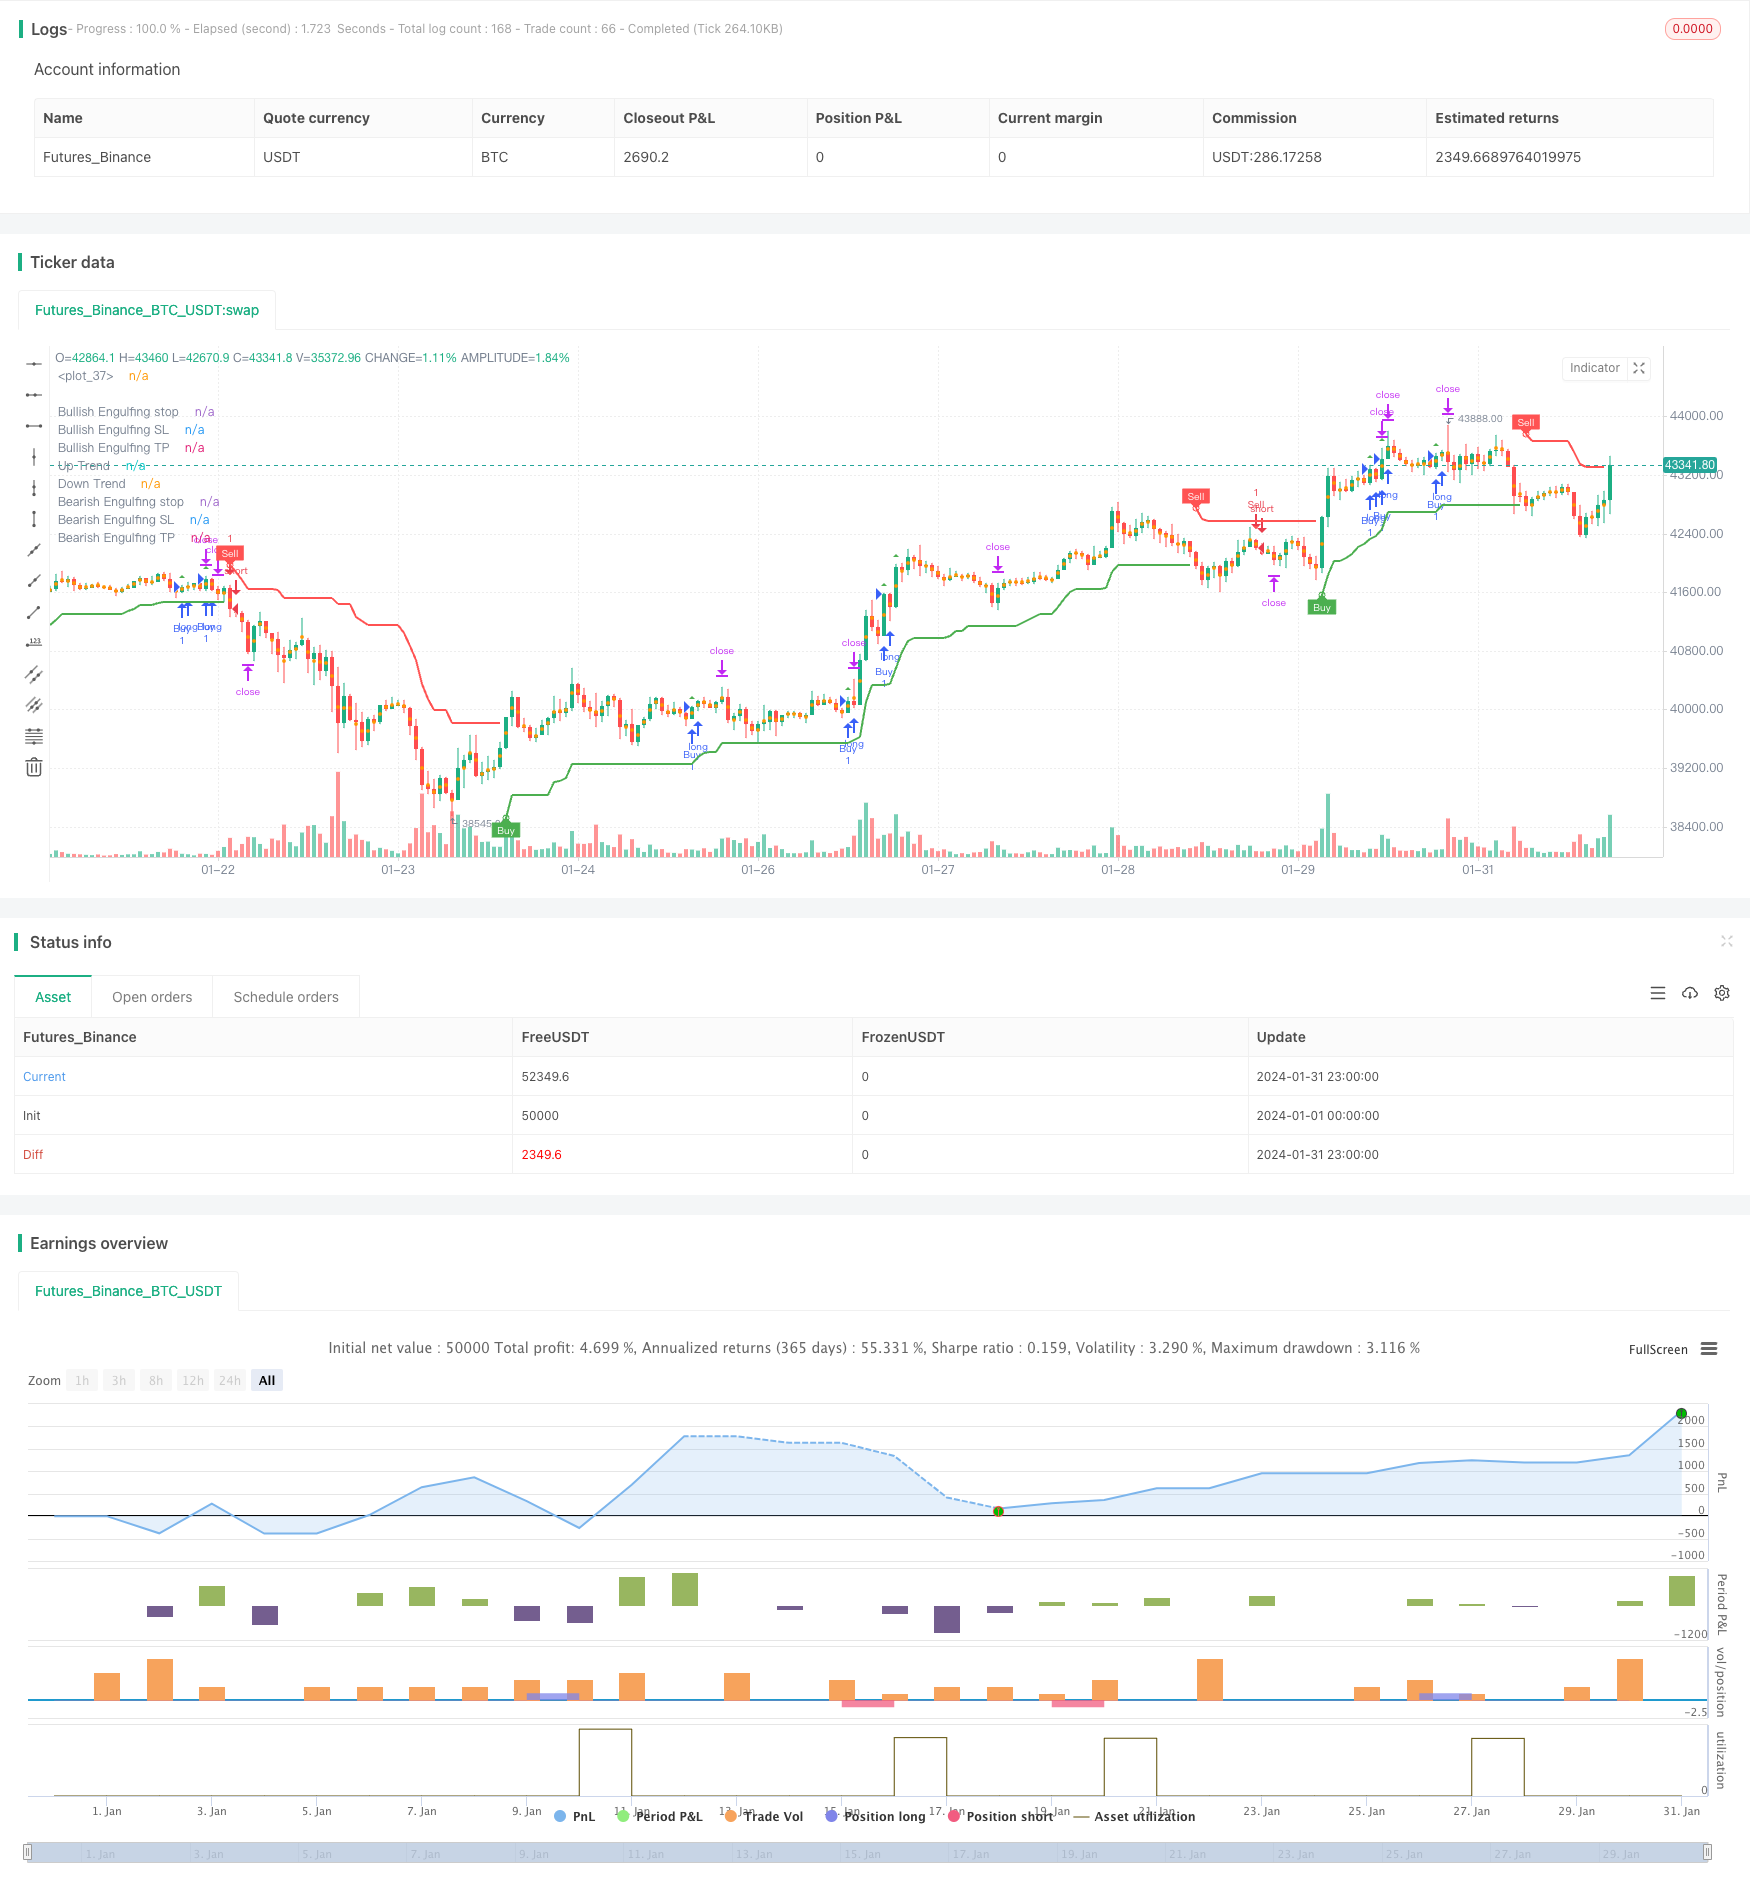
সারসংক্ষেপ
সামগ্রিকভাবে, ডায়নামিক গ্রাস প্রবণতা কৌশলটি প্রবণতা বিচারের সাথে মিলিত হয়, যার ফলে প্রবেশের সংকেত নির্ভুলতা এবং স্টপ লস যুক্তিসঙ্গত ট্রেডিং কৌশল তৈরি হয়। প্রয়োগের প্রক্রিয়াতে, প্যারামিটার অপ্টিমাইজেশন, ঝুঁকি নিয়ন্ত্রণ এবং নতুন প্রযুক্তি প্রবর্তনের মাধ্যমে কৌশলটির স্থায়িত্ব এবং লাভজনকতা আরও বাড়ানো যেতে পারে। কৌশলটির কাঠামোটি পরিষ্কার, খুব শক্তিশালী, গভীর গবেষণা এবং প্রয়োগের জন্য মূল্যবান।
/*backtest
start: 2024-01-01 00:00:00
end: 2024-01-31 23:59:59
period: 1h
basePeriod: 15m
exchanges: [{"eid":"Futures_Binance","currency":"BTC_USDT"}]
*/

// This source code is subject to the terms of the Mozilla Public License 2.0 at https://mozilla.org/MPL/2.0/
// © Malikdrajat


//@version=4
strategy("Engulfing with Trend", overlay=true)

Periods = input(title="ATR Period", type=input.integer, defval=10)
src = input(hl2, title="Source")
Multiplier = input(title="ATR Multiplier", type=input.float, step=0.1, defval=3.0)
changeATR= input(title="Change ATR Calculation Method ?", type=input.bool, defval=true)
showsignals = input(title="Show Buy/Sell Signals ?", type=input.bool, defval=true)
highlighting = input(title="Highlighter On/Off ?", type=input.bool, defval=true)

atr2 = sma(tr, Periods)
atr= changeATR ? atr(Periods) : atr2

up=src-(Multiplier*atr)
up1 = nz(up[1],up)
up := close[1] > up1 ? max(up,up1) : up
dn=src+(Multiplier*atr)
dn1 = nz(dn[1], dn)
dn := close[1] < dn1 ? min(dn, dn1) : dn

trend = 1
trend := nz(trend[1], trend)
trend := trend == -1 and close > dn1 ? 1 : trend == 1 and close < up1 ? -1 : trend

upPlot = plot(trend == 1 ? up : na, title="Up Trend", style=plot.style_linebr, linewidth=2, color=color.green)
buySignal = trend == 1 and trend[1] == -1
plotshape(buySignal ? up : na, title="UpTrend Begins", location=location.absolute, style=shape.circle, size=size.tiny, color=color.green, transp=0)
plotshape(buySignal and showsignals ? up : na, title="Buy", text="Buy", location=location.absolute, style=shape.labelup, size=size.tiny, color=color.green, textcolor=color.white, transp=0)
dnPlot = plot(trend == 1 ? na : dn, title="Down Trend", style=plot.style_linebr, linewidth=2, color=color.red)
sellSignal = trend == -1 and trend[1] == 1
plotshape(sellSignal ? dn : na, title="DownTrend Begins", location=location.absolute, style=shape.circle, size=size.tiny, color=color.red, transp=0)
plotshape(sellSignal and showsignals ? dn : na, title="Sell", text="Sell", location=location.absolute, style=shape.labeldown, size=size.tiny, color=color.red, textcolor=color.white, transp=0)
mPlot = plot(ohlc4, title="", style=plot.style_circles, linewidth=0)
longFillColor = highlighting ? (trend == 1 ? color.green : color.white) : color.white
shortFillColor = highlighting ? (trend == -1 ? color.red : color.white) : color.white
fill(mPlot, upPlot, title="UpTrend Highligter", color=longFillColor)
fill(mPlot, dnPlot, title="DownTrend Highligter", color=shortFillColor)
alertcondition(buySignal, title="SuperTrend Buy", message="SuperTrend Buy!")
alertcondition(sellSignal, title="SuperTrend Sell", message="SuperTrend Sell!")
changeCond = trend != trend[1]
alertcondition(changeCond, title="SuperTrend Direction Change", message="SuperTrend has changed direction!")

// Define Downtrend and Uptrend conditions
downtrend = trend == -1
uptrend = trend == 1


// Engulfing
boringThreshold = input(25, title="Boring Candle Threshold (%)", minval=1, maxval=100, step=1)
engulfingThreshold = input(50, title="Engulfing Candle Threshold (%)", minval=1, maxval=100, step=1)
stopLevel = input(200, title="Stop Level (Pips)", minval=1)


// Boring Candle (Inside Bar) and Engulfing Candlestick Conditions
isBoringCandle = abs(open[1] - close[1]) * 100 / abs(high[1] - low[1]) <= boringThreshold
isEngulfingCandle = abs(open - close) * 100 / abs(high - low) <= engulfingThreshold

// Bullish and Bearish Engulfing Conditions
bullEngulfing = uptrend and close[1] < open[1] and close > open[1] and not isBoringCandle and not isEngulfingCandle
bearEngulfing = downtrend and close[1] > open[1] and close < open[1] and not isBoringCandle and not isEngulfingCandle

// Stop Loss, Take Profit, and Entry Price Calculation
bullStop = close + (stopLevel * syminfo.mintick)
bearStop = close - (stopLevel * syminfo.mintick)
bullSL = low
bearSL = high
bullTP = bullStop + (bullStop - low)
bearTP = bearStop - (high - bearStop)

// Entry Conditions
enterLong = bullEngulfing and uptrend
enterShort = bearEngulfing and downtrend

// Exit Conditions
exitLong = crossover(close, bullTP) or crossover(close, bullSL)
exitShort = crossover(close, bearTP) or crossover(close, bearSL)

// Check if exit conditions are met by the next candle
exitLongNextCandle = exitLong and (crossover(close[1], bullTP[1]) or crossover(close[1], bullSL[1]))
exitShortNextCandle = exitShort and (crossover(close[1], bearTP[1]) or crossover(close[1], bearSL[1]))

// Strategy Execution
strategy.entry("Buy", strategy.long, when=enterLong )
strategy.entry("Sell", strategy.short, when=enterShort )

// Exit Conditions for Long (Buy) Positions
if (bullEngulfing and not na(bullTP) and not na(bullSL))
    strategy.exit("Exit Long", from_entry="Buy", stop=bullSL, limit=bullTP)

// Exit Conditions for Short (Sell) Positions
if (bearEngulfing and not na(bearTP) and not na(bearSL))
    strategy.exit("Exit Short", from_entry="Sell", stop=bearSL, limit=bearTP)

// Plot Shapes and Labels
plotshape(bullEngulfing, style=shape.triangleup, location=location.abovebar, color=color.green)
plotshape(bearEngulfing, style=shape.triangledown, location=location.abovebar, color=color.red)

// Determine OP, SL, and TP
plot(bullEngulfing ? bullStop : na, title="Bullish Engulfing stop", color=color.red, linewidth=3, style=plot.style_linebr)
plot(bearEngulfing ? bearStop : na, title="Bearish Engulfing stop", color=color.red, linewidth=3, style=plot.style_linebr)
plot(bullEngulfing ? bullSL : na, title="Bullish Engulfing SL", color=color.red, linewidth=3, style=plot.style_linebr)
plot(bearEngulfing ? bearSL : na, title="Bearish Engulfing SL", color=color.red, linewidth=3, style=plot.style_linebr)
plot(bullEngulfing ? bullTP : na, title="Bullish Engulfing TP", color=color.green, linewidth=3, style=plot.style_linebr)
plot(bearEngulfing ? bearTP : na, title="Bearish Engulfing TP", color=color.green, linewidth=3, style=plot.style_linebr)