বেবিশার্ক ট্রেডিং কৌশল VWAP এবং OBV RSI সূচকের উপর ভিত্তি করে
কৌশল ওভারভিউ
BabyShark VWAP ট্রেডিং কৌশল হল একটি পরিমাণগত ট্রেডিং কৌশল যা VWAP এবং OBV RSI এর তুলনামূলক দুর্বলতার উপর ভিত্তি করে তৈরি করা হয়। এই কৌশলটি সম্ভাব্য ক্রয় এবং বিক্রয় সংকেতগুলিকে VWAP থেকে দামের বিচ্যুতি এবং OBV RSI এর নির্দিষ্ট থ্রেশহোল্ডটি অতিক্রম করার উপর ভিত্তি করে চিহ্নিত করার জন্য তৈরি করা হয়েছে।
কৌশল নীতি
এই কৌশলটির মূল নীতিটি হল বাজারের প্রবণতা এবং গতিশীল পরিবর্তনগুলি ক্যাপচার করার জন্য ভিডাব্লুএপি এবং ওবিভি আরএসআই দুটি সূচক ব্যবহার করা। ভিডাব্লুএপি হ’ল একটি গতিশীল গড়, দাম এবং লেনদেনের পরিমাণের উপর ভিত্তি করে, যা বাজারের মূল লেনদেনের অঞ্চলগুলিকে প্রতিফলিত করতে পারে। যখন দামগুলি ভিডাব্লুএপি থেকে উল্লেখযোগ্যভাবে বিচ্যুত হয়, তখন সাধারণত বাজারটি ওভারবয় বা ওভারসোলের ঘটনা ঘটে। ওবিভি আরএসআই, traditionalতিহ্যবাহী আরএসআই সূচকের ভিত্তিতে লেনদেনের উপাদানটি প্রবর্তন করে, লেনদেনের পরিবর্তনের শক্তি পরিমাপ করে বাজারের প্রবণতার স্থায়িত্বের বিচার করে।
বিশেষ করে, এই কৌশলটি 60 কে লাইনকে VWAP গণনা চক্র হিসাবে ব্যবহার করে এবং ক্লোজিং মূল্যকে ইনপুট হিসাবে ব্যবহার করে। তারপরে ওভারব্লু এবং ওভারসোল্ড অঞ্চলগুলি তৈরি করা হয় যা মূল্যের VWAP থেকে 3 টি মানদণ্ডের বিপরীতে থাকে। OBV RSI এর জন্য, 5 কে লাইনকে গণনা চক্র হিসাবে ব্যবহার করা হয় এবং 70 এবং 30 এর দুটি প্রান্তিক মানকে ওভারব্লু এবং ওভারসোল্ডের বিচারক হিসাবে সেট করা হয়।
ট্রেডিং লজিকের দিক থেকে, যখন দাম ভিডাব্লুএপি ট্র্যাকের নীচে ওভারসোল অঞ্চলে থাকে এবং ওবিভি আরএসআই 30 এর চেয়ে কম হয়, তখন কৌশলটি একটি প্লাস সিগন্যাল দেয়; এবং যখন দাম ভিডাব্লুএপি ট্র্যাকের ওভারসোল অঞ্চলে থাকে এবং ওবিভি আরএসআই 70 এর চেয়ে বেশি হয়, তখন এটি একটি শূন্য সিগন্যাল দেয়। একই সাথে, কৌশলটি 0.6% স্টপ-অফ-লস অনুপাত সেট করে এবং ক্রমাগত ক্ষতির পরে 10 কে লাইন শীতল সময়কাল প্রবর্তন করে।
কৌশলগত সুবিধা
- মার্কেটের প্রবণতা এবং গতিবিধিকে পুরোপুরি ক্যাপচার করার জন্য মূল্য এবং লেনদেনের পরিমাণের মতো একাধিক বাজার উপাদানকে একত্রিত করুন।
- ডায়নামিক ভিডাব্লুএপি এবং ওবিভি আরএসআই সূচক ব্যবহার করে, যা বিভিন্ন বাজার চক্রের পরিবর্তনের সাথে খাপ খাইয়ে নিতে পারে।
- যুক্তিসঙ্গত স্টপ-অফ-লস অনুপাত এবং শীতল সময় নির্ধারণ করুন যাতে সুযোগগুলি কাজে লাগানোর সাথে সাথে ঝুঁকিগুলি কার্যকরভাবে নিয়ন্ত্রণ করা যায়।
- যুক্তি সুস্পষ্ট, সহজে বোঝা যায় এবং বাস্তবায়িত হয়, এবং কিছু ব্যাখ্যাযোগ্যতা থাকে।
- প্যারামিটারগুলি বিভিন্ন স্টাইলের ব্যবসায়ীদের জন্য অনুকূলিতকরণ এবং উন্নতি করার জন্য সামঞ্জস্যপূর্ণ।
কৌশলগত ঝুঁকি
- বাজারের ধাক্কা বা পুনরাবৃত্তির ক্ষেত্রে, ঘন ঘন ট্রেডিং সিগন্যালগুলি অত্যধিক লেনদেন এবং স্লাইড পয়েন্টের ব্যয় বৃদ্ধি করতে পারে।
- প্রবণতার ক্ষেত্রে, কেবলমাত্র VWAP-এর উপর নির্ভর করে স্টপ করা একটি কৌশলকে তাড়াতাড়ি ছাড়িয়ে যেতে পারে এবং পরবর্তী প্রবণতার মুনাফা হারাতে পারে।
- নির্দিষ্ট প্যারামিটার সেটিংগুলি বাজারের পরিবর্তিত পরিবেশের সাথে খাপ খাইয়ে নিতে পারে না এবং বিভিন্ন জাত এবং সময়কালের জন্য অপ্টিমাইজ করা প্রয়োজন।
- OBV সূচকটি লেনদেনের পরিমাণের উপর নির্ভরশীল, লেনদেনের পরিমাণের তথ্যটি সত্য নয় বা ম্যানিপুলেট করা হলে সূচকের ভুল বিচার হতে পারে।
- এই কৌশলগুলোতে ম্যাক্রো-অর্থনীতি, সংবাদ এবং অন্যান্য বাহ্যিক বিষয়গুলোকে বিবেচনা করা হয় না, যা চরম পরিস্থিতিতে কার্যকর হতে পারে না।
অপ্টিমাইজেশান দিক
- প্রবণতা নিশ্চিতকরণ সূচক, অস্থিরতা সূচক ইত্যাদির মতো আরো ফিল্টারিং শর্ত প্রবর্তন করা।
- আউটফিল্ডের অবস্থার অনুকূলিতকরণ, যেমন মোবাইল স্টপ বা অন্যান্য প্রবণতা ট্র্যাকিং সূচকগুলির সাথে মিলিত হয়ে প্রবণতার পরিস্থিতি আরও ভালভাবে বুঝতে পারে।
- VWAP এবং OBV RSI এর প্যারামিটারগুলির জন্য স্ব-অনুকূলিতকরণ অপ্টিমাইজেশন, গণনা চক্র এবং থ্রেশহোল্ড সেটিংয়ের গতিশীল সমন্বয়।
- ওবিভি আরএসআই সূচকের নির্ভরযোগ্যতা বাড়ানোর জন্য ট্রানজিট ভলিউম সত্যতা যাচাইকরণ ব্যবস্থা চালু করা হয়েছে।
- ম্যাক্রো-অর্থনৈতিক তথ্য বিশ্লেষণ, আবেগ সূচক ইত্যাদি অন্তর্ভুক্ত করার কথা বিবেচনা করুন, যা কৌশলগুলির অভিযোজনযোগ্যতা এবং স্থিতিশীলতা বাড়িয়ে তুলবে।
সারসংক্ষেপ
BabyShark VWAP ট্রেডিং কৌশল হল একটি পরিমাণগত ট্রেডিং কৌশল যা ওভারওয়েটেড গড় মূল্য এবং শক্তি প্রবাহের সূচকগুলির তুলনামূলকভাবে দুর্বল সূচককে সংযুক্ত করে, বাজারের ওভারসেলের অবস্থা এবং প্রবণতা গতিশীলতার পরিবর্তনগুলি ক্যাপচার করে ট্রেডিং সংকেত তৈরি করে। এই কৌশলটির যুক্তি স্পষ্ট, দাম এবং ওভারওয়েট ইত্যাদির মতো একাধিক বাজার উপাদানগুলির সাথে মিলিত, যা বাজারের পুরো স্পন্দনটি ধরে রাখতে পারে। একই সাথে, যুক্তিসঙ্গত স্টপ লস সেটআপ এবং ঝুঁকি নিয়ন্ত্রণ ব্যবস্থা, কৌশলটি লাভের চেষ্টা করার সময় ঝুঁকি ব্যবস্থাপনাকে বিবেচনা করে। অবশ্যই, কৌশলটি বাজারের ঝড় এবং প্রবণতা পরিস্থিতির সাথে অপর্যাপ্তভাবে অভিযোজিত এবং প্যারামিটার স্থিরতার মতো সম্ভাব্য সমস্যা রয়েছে। ভবিষ্যতে এটি আরও উন্নত এবং উন্নত করা যেতে পারে।
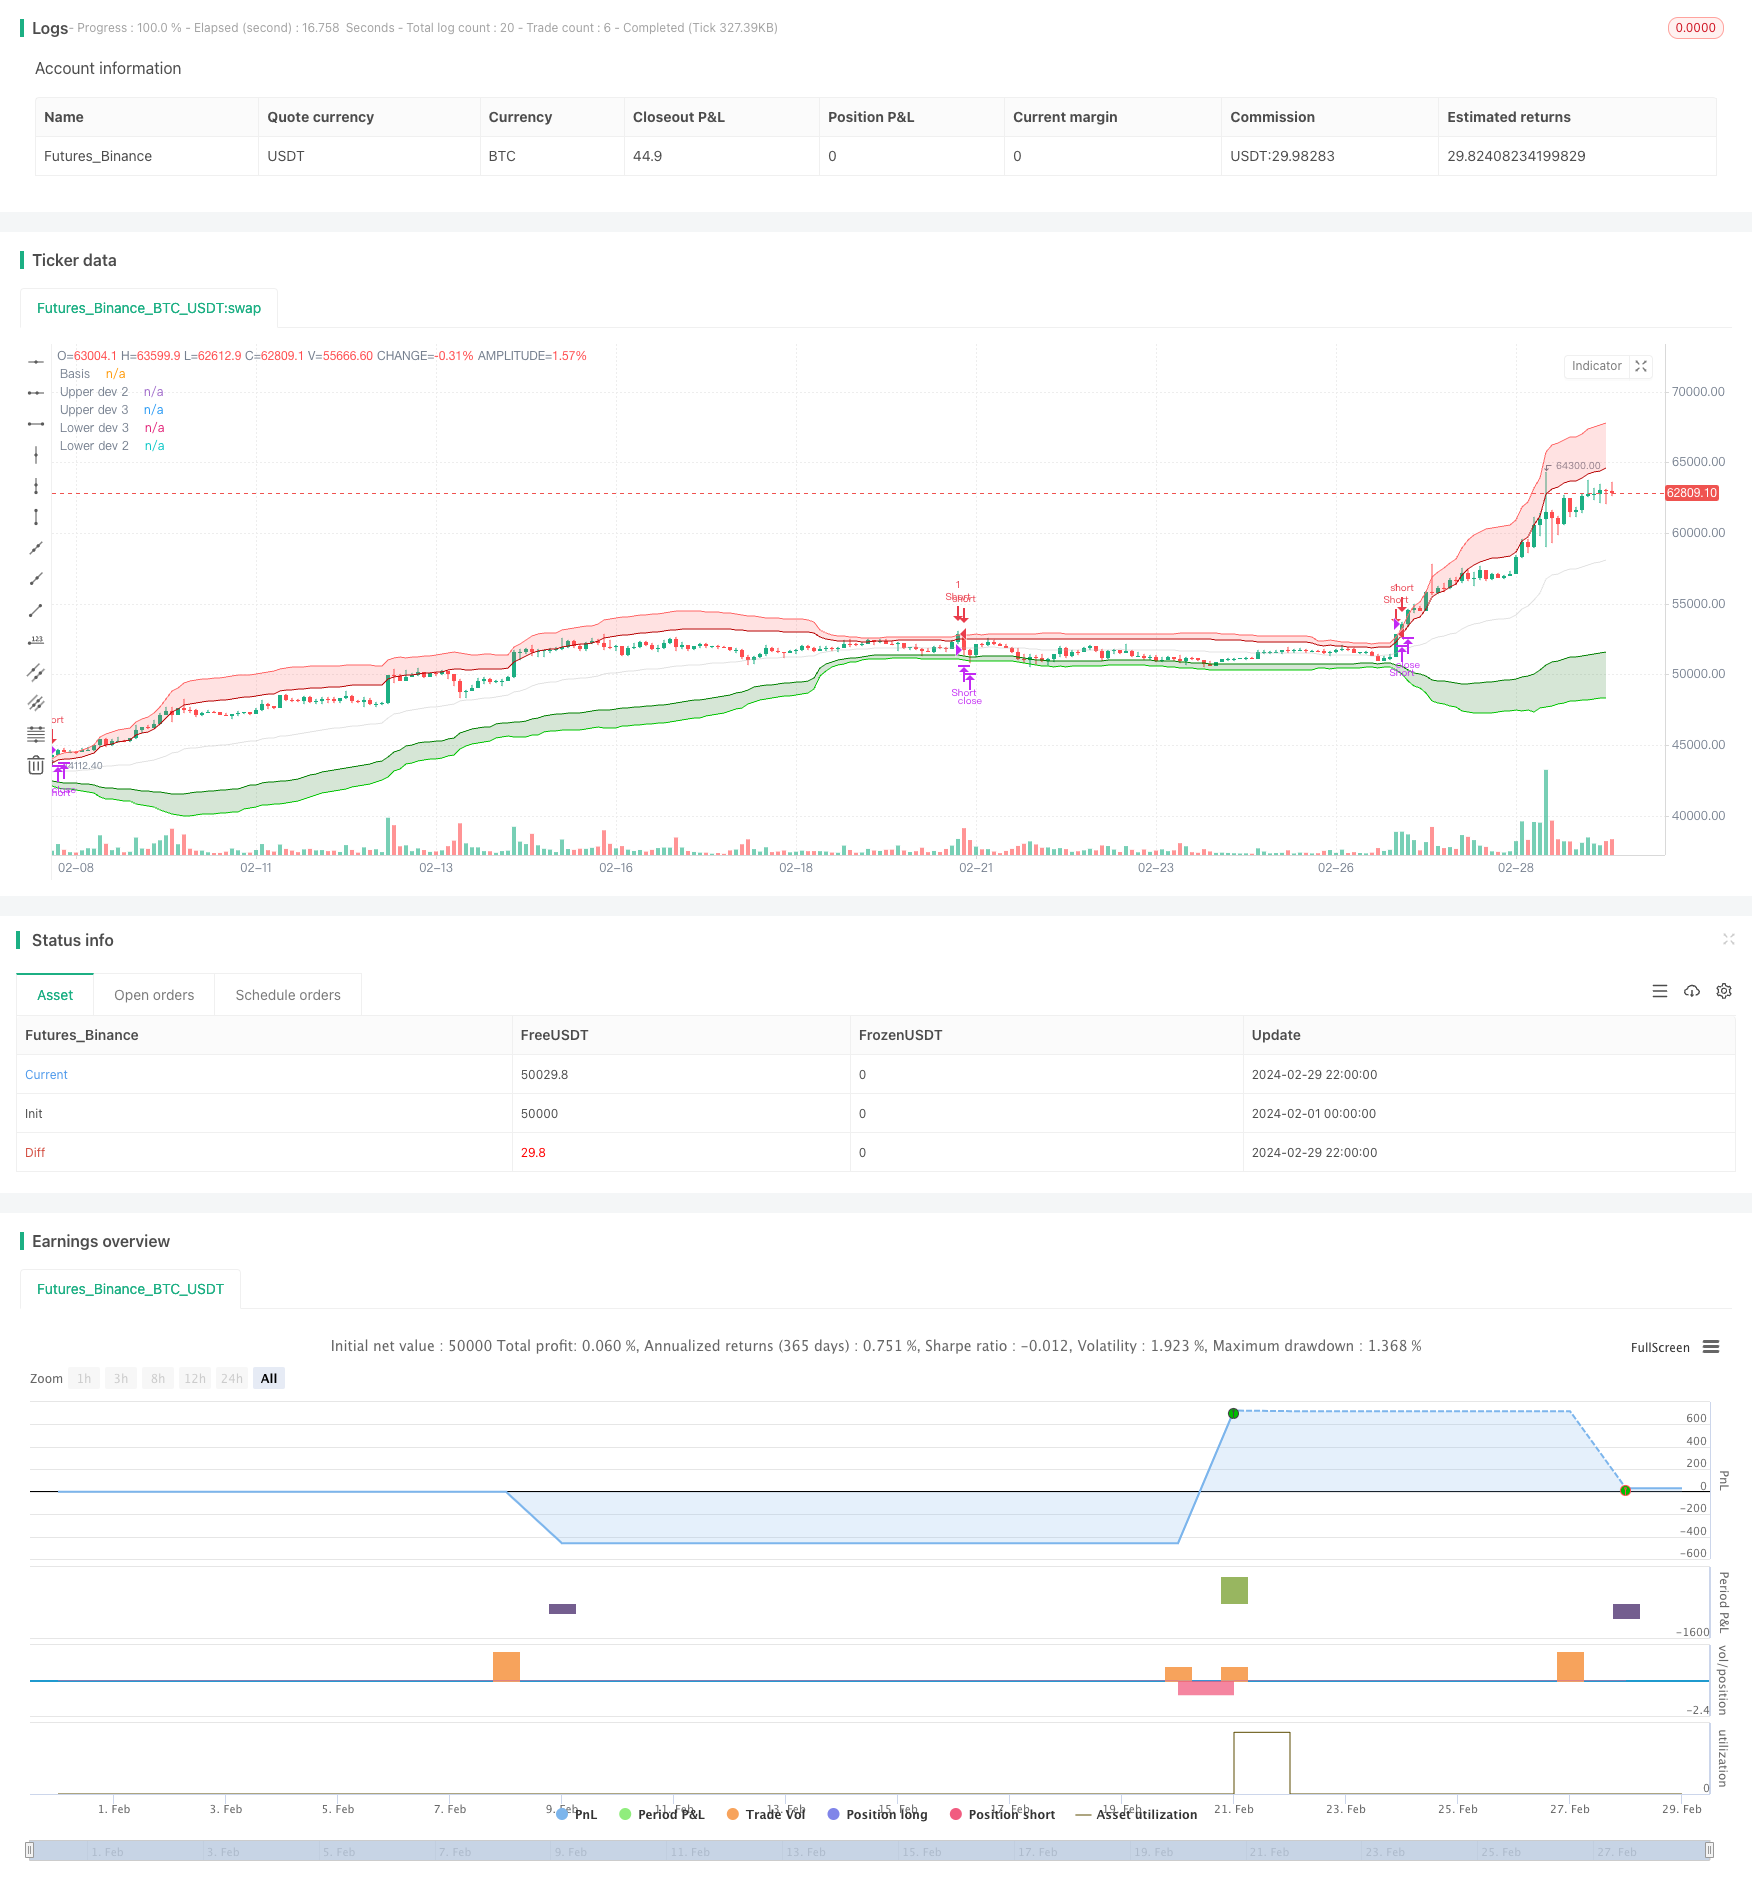
/*backtest
start: 2024-02-01 00:00:00
end: 2024-02-29 23:59:59
period: 2h
basePeriod: 15m
exchanges: [{"eid":"Futures_Binance","currency":"BTC_USDT"}]
*/

// This Pine Script™ code is subject to the terms of the Mozilla Public License 2.0 at https://mozilla.org/MPL/2.0/
// © GreatestUsername

//@version=5
strategy("BabyShark VWAP Strategy", overlay=true, margin_long=100, margin_short=100, calc_on_every_tick = true)


// VWAP
ls = input(false, title='Log-space', group = "Optional")
type = 'Average Deviation'
length = input(60, group="Strategy Modification")
source = input(close, group="Strategy Modification")
_low = ls == true ? math.log(low) : low
_high = ls == true ? math.log(high) : high
src = ls == true ? math.log(source) : source

//weighted mean
pine_vwmean(x, y) =>
    cw = 0.0
    cd = 0.0
    w_sum = 0.0
    d_sum = 0.0
    for i = 0 to y - 1 by 1
        cd := x[i]
        cw := volume[i]
        d_sum += cw * cd
        w_sum += cw
        w_sum
    d_sum / w_sum

//weighted standard deviation
pine_vwstdev(x, y, b) =>
    d_sum = 0.0
    w_sum = 0.0
    cd = 0.0
    for i = 0 to y - 1 by 1
        cd := x[i]
        cw = volume[i]
        d_sum += cw * math.pow(cd - b, 2)
        w_sum += cw
        w_sum
    math.sqrt(d_sum / w_sum)

//weighted average deviation
pine_vwavdev(x, y, b) =>
    d_sum = 0.0
    w_sum = 0.0
    cd = 0.0
    for i = 0 to y - 1 by 1
        cd := x[i]
        cw = volume[i]
        d_sum += cw * math.abs(cd - b)
        w_sum += cw
        w_sum
    d_sum / w_sum

vwmean = pine_vwmean(src, length)

//consider using Average Deviation instead of Standard Deviatio if there are values outside of 3rd upper & lower bands within a rolling window
dev = if type == 'Standard Deviation'
    dev = pine_vwstdev(src, length, vwmean)
    dev
else if type == 'Average Deviation'
    dev = pine_vwavdev(src, length, vwmean)
    dev

basis = ls == true ? math.exp(vwmean) : vwmean
plot(basis, color=color.new(#b7b7b7, 60), title='Basis')

upper_dev_2 = vwmean + dev * 2
upper_dev_3 = vwmean + dev * 3

lower_dev_2 = vwmean - dev * 2
lower_dev_3 = vwmean - dev * 3

fill(
     plot1=plot(ls == true ? math.exp(upper_dev_2) : upper_dev_2, color=color.new(#B20000, 0), title='Upper dev 2'),
     plot2=plot(ls == true ? math.exp(upper_dev_3) : upper_dev_3, color=color.new(#FF6666, 0), title='Upper dev 3', display=display.none),
     color=color.new(#FF4D4D, 80), title='Upper band'
     )
fill(
     plot1=plot(ls == true ? math.exp(lower_dev_3) : lower_dev_3, color=color.new(#00CC00, 0), title='Lower dev 3', display=display.none),
     plot2=plot(ls == true ? math.exp(lower_dev_2) : lower_dev_2, color=color.new(#008000, 0), title='Lower dev 2'),
     color=color.new(#006600, 80), title='Lower band'
     )


// Input to enable or disable the table visibility
table_visible = input(false, title="Show Table", group="Deviation Cross Monitor")
// Input for the number of candles to look back
table_length = input(300, title="Table Lookback Length", group="Deviation Cross Monitor")

// Custom count function
count_occurrences(cond, length) =>
    count = 0
    for i = 0 to length - 1
        if cond[i]
            count := count + 1
    count

// Count occurrences of prices above Upper dev 2 and below Lower dev 2

above_upper_dev_2 = count_occurrences(close > upper_dev_2, table_length)
below_lower_dev_2 = count_occurrences(close < lower_dev_2, table_length)

// Create table in the bottom right corner
var table tbl = table.new(position=position.bottom_right, rows=2, columns=2)

if table_visible
    if barstate.islast
        // Update the table headers
        table.cell(tbl, 0, 0, "Above Upper Dev 2", bgcolor=color.gray, text_color=color.white)
        table.cell(tbl, 0, 1, "Below Lower Dev 2", bgcolor=color.gray, text_color=color.white)

        // Update the table values
        table.cell(tbl, 1, 0, str.tostring(above_upper_dev_2), bgcolor=color.new(color.green, 90), text_color=color.green)
        table.cell(tbl, 1, 1, str.tostring(below_lower_dev_2), bgcolor=color.new(color.red, 90), text_color=color.red)
else
    table.delete(tbl)

// RSI
obvsrc = close
change_1 = ta.change(obvsrc)
obv = ta.cum(ta.change(obvsrc) > 0 ? volume : change_1 < 0 ? -volume : 0 * volume)

src2 = obv
len = input.int(5, minval=1, title="RSI Length", group="Strategy Modification")
up = ta.rma(math.max(ta.change(src2), 0), len)
down = ta.rma(-math.min(ta.change(src2), 0), len)
rsi = down == 0 ? 100 : up == 0 ? 0 : 100 - 100 / (1 + up / down)
higherlvl = input(70, title="Higher Level", group="Strategy Modification")
lowerlvl = input(30, title="Lower Level", group="Strategy Modification")


plot_color = rsi >= higherlvl ? color.red : rsi <= lowerlvl ? color.green : color.new(#b7b7b7, 60)
// plot(rsi, color=plot_color)

//plot(rsi, color=color.white)


// Count occurrences of RSI crossing higher level and lower level
cross_above_higher = ta.crossover(rsi, higherlvl)
cross_below_lower = ta.crossunder(rsi, lowerlvl)
above_higher_count = count_occurrences(cross_above_higher, table_length)
below_lower_count = count_occurrences(cross_below_lower, table_length)

// Create table in the bottom right corner
if (table_visible)
    var table tbl2 = table.new(position=position.bottom_right, rows=2, columns=2)
    if (barstate.islast)
        // Update the table headers
        table.cell(tbl2, 0, 0, "Higher Level Cross", bgcolor=color.gray, text_color=color.white)
        table.cell(tbl2, 0, 1, "Lower Level Cross", bgcolor=color.gray, text_color=color.white)

        // Update the table values
        table.cell(tbl2, 1, 0, str.tostring(above_higher_count), bgcolor=color.new(color.red, 90), text_color=color.red)
        table.cell(tbl2, 1, 1, str.tostring(below_lower_count), bgcolor=color.new(color.green, 90), text_color=color.green)


// Entries

// Long Entry:
// Price is in the shaded GREEN area of [Hoss] VWAP Deviation
// and the [Hoss] OBV RSI is GREEN.
longCondition1 = close <= lower_dev_3
longConditions = plot_color == color.green and longCondition1 and strategy.position_size == 0

// Short Entry:
// Price is in the shaded RED area of [Hoss] VWAP Deviation
// and the [Hoss] OBV RSI is RED.
shortCondition1 = close >= upper_dev_3
shortConditions = plot_color == color.red and shortCondition1 and strategy.position_size == 0

var int lastEntryBar = 0


shortEMA = ta.ema(close, 12)
longEMA = ta.ema(close, 21)
uptrend = shortEMA > longEMA

if longConditions and lastEntryBar < bar_index - 10 //and uptrend
    strategy.entry("Long", strategy.long, stop=close * 0.994)
    lastEntryBar := bar_index

if shortConditions and lastEntryBar < bar_index - 10 //and not uptrend
    strategy.entry("Short", strategy.short, stop=close * 1.006)
    lastEntryBar := bar_index


if strategy.position_size > 0 and (ta.crossover(close, basis) or strategy.opentrades.entry_price(strategy.opentrades - 1) * 0.994 > close)
    strategy.close("Long", immediately = true)
if strategy.position_size < 0 and (ta.crossunder(close, basis) or strategy.opentrades.entry_price(strategy.opentrades - 1) * 1.006 < close)
    strategy.close("Short", immediately = true)

// Stop Loss:
// 0.6%
// After 1 Loss => NO more Trades for 10 Candles (10 minutes) (usually a breakout will happen, and it takes average 10min till it ranges again. So basically wait for range to form again)

// Take Profit:
// Grey line on [Hoss] VWAP Deviation or 0.6%