দাম ওঠানামার পরিসরের উপর ভিত্তি করে সিগন্যাল ফিল্টারিং কৌশল কিনুন এবং বিক্রি করুন
ওভারভিউ
Range Filter Buy Sell Signals Strategy (রেঞ্জ ফিল্টার বাই সেল সিগন্যাল ফিল্টারিং কৌশল) একটি অত্যন্ত কার্যকরী পরিমাণগত ট্রেডিং কৌশল। এটি দামের অস্থিরতার পরিধি ব্যবহার করে ক্রয় এবং বিক্রয় সংকেতগুলি ফিল্টার করে, কম অস্থিরতার বাজারে মিথ্যা সংকেত হ্রাস করে এবং উচ্চ অস্থিরতার বাজারে সংকেত মান উন্নত করে। কৌশলটির নামটি কৌশলটির মূল কার্যকারিতাটি সঠিকভাবে সংক্ষিপ্ত করে।
কৌশল নীতি
এই কৌশলটি প্রথমে একটি নির্দিষ্ট সময়ের মধ্যে সম্পদের দামের অস্থিরতার পরিধি গণনা করে। বিশেষত, এটি নির্দিষ্ট সময়ের মধ্যে সর্বোচ্চ এবং সর্বনিম্ন দামের মধ্যে পার্থক্য গণনা করে, দামের অস্থিরতার মাত্রা নির্ধারণ করে।
এর পরে, এটি ক্রয় এবং বিক্রয় সংকেত উত্পন্ন করে। তবে সমস্ত সংকেতই প্রবেশের সূত্রপাত করে না, তবে দামের ওঠানামা পরিসীমা ফিল্টারিংয়ের শর্ত পূরণ করা প্রয়োজন। উদাহরণস্বরূপ, দামটি যখন ওঠানামা পরিসীমা অতিক্রম করে তখনই কেনার সংকেত দেওয়া হয়।
এইভাবে, এই কৌশলটি কম অস্থিরতার বাজারের পরিবেশে বেশিরভাগ মিথ্যা সংকেতগুলিকে ফিল্টার করতে পারে এবং অপ্রয়োজনীয় প্রবেশকে এড়াতে পারে। উচ্চ অস্থিরতার সময়, এটি বৃহত্তর দিকনির্দেশমূলক চলাচলকে ধরতে এবং এর থেকে লাভ করতে পারে।
কৌশলগত সুবিধা
এই কৌশলটির সবচেয়ে বড় সুবিধা হল যে এটি গতিশীলভাবে সংকেতের পরিস্রাবণ শক্তিকে সামঞ্জস্য করতে পারে। কম ওঠানামা হলে, এটি শুধুমাত্র উচ্চ মানের সংকেত নির্বাচন করে; এবং উচ্চ ওঠানামা হলে, এটি বাজারে দেওয়া আরও সুযোগগুলি দখল করতে পারে।
স্থির প্যারামিটারযুক্ত ফিল্টারগুলির তুলনায় এই কৌশলটি আরও স্মার্ট এবং অভিযোজিত। বাজারটি যে অবস্থায়ই থাকুক না কেন, এটি উচ্চতর ঝুঁকি-ফেরতের প্রস্তাব দেয়।
এছাড়াও, এই কৌশলটি ট্রেডিংয়ের দিকনির্দেশনাকে একত্রিত করে, যা একক অপারেশন শর্তের তুলনায় আরও নির্ভরযোগ্য ট্রেডিং সংকেত সরবরাহ করে। একই সাথে, এটির একটি ক্ষতি-প্রতিরোধক ফাংশন রয়েছে, যা কার্যকরভাবে পৃথক ব্যবসায়ের ঝুঁকি নিয়ন্ত্রণ করে।
কৌশলগত ঝুঁকি
এই কৌশলটির প্রধান ঝুঁকি হল ওভারলে প্যারামিটার সেট করা। যদি সেট করা প্যারামিটারটি খুব বড় বা খুব ছোট হয় তবে এটি সংকেতের গুণমান এবং লাভের সুযোগকে প্রভাবিত করে।
উপরন্তু, স্বল্পমেয়াদে দামের প্রবণতা বেশি হলে, এই কৌশলটির লাভের সম্ভাবনা তুলনামূলকভাবে কম। বিভিন্ন পিরিয়ড সিস্টেমের সমন্বয় এই সমস্যাটি প্রশমিত করতে সহায়তা করতে পারে।
কৌশল অপ্টিমাইজেশনের দিকনির্দেশনা
এই কৌশলটি নিম্নলিখিত উপায়ে উন্নত করা যেতে পারেঃ
স্বনির্ধারিত প্যারামিটার অ্যালগরিদম ব্যবহার করে স্বয়ংক্রিয়ভাবে পরিসীমা প্যারামিটারগুলিকে অপ্টিমাইজ করুন, এটিকে আরও স্মার্ট এবং গতিশীল করুন।
বড় আকারের চক্রের উপর ভিত্তি করে ফিল্টার করার নিয়ম যুক্ত করুন, যাতে বাজারের অস্থিরতার মধ্যে আটকে না পড়ে।
বিভিন্ন চক্রের এই কৌশলকে একত্রিত করে একটি সিস্টেম তৈরি করা হয়েছে, যা সামগ্রিকভাবে স্থিতিশীলতা বৃদ্ধি করেছে।
মেশিন লার্নিং অ্যালগরিদম যুক্ত করা হয়েছে, যা পরামিতি সেটিং এবং ফিল্টারিং নিয়মের কার্যকারিতা উন্নত করে।
সারসংক্ষেপ
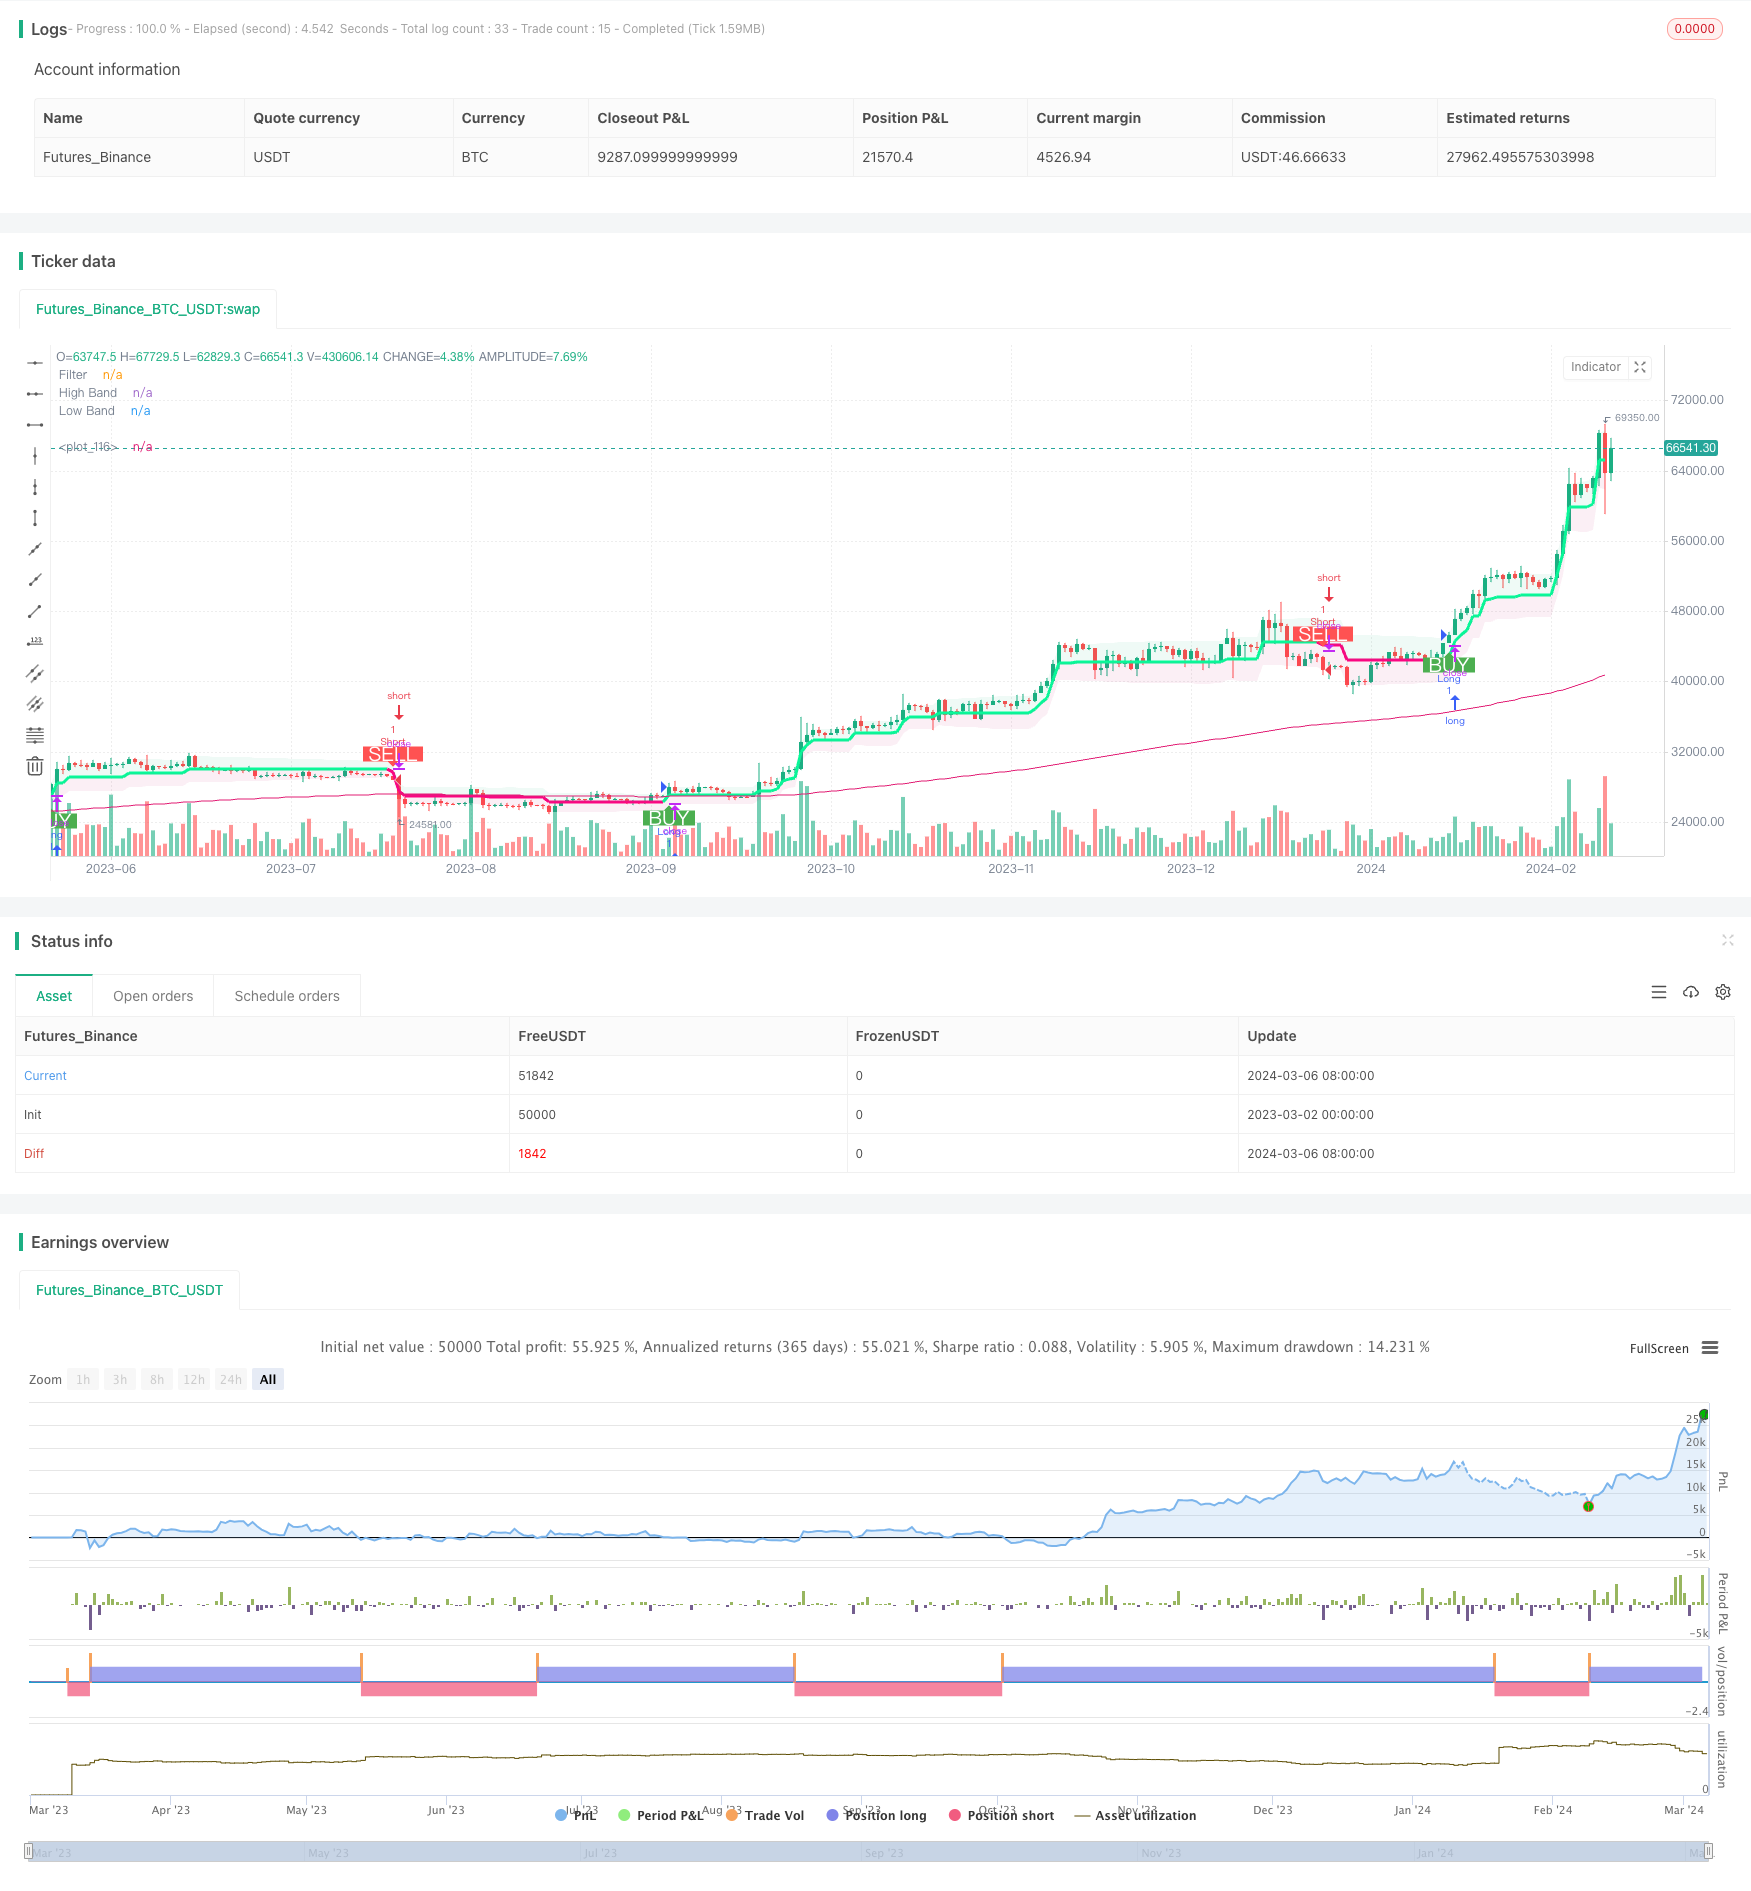
দামের অস্থিরতার উপর ভিত্তি করে ক্রয়-বিক্রয় সংকেত ফিল্টারিং কৌশলটি একটি খুব ব্যবহারিক এবং কার্যকর পরিমাণগত ট্রেডিং কৌশল। এটি ফিল্টারিংয়ের তীব্রতাকে গতিশীলভাবে সামঞ্জস্য করতে পারে এবং বিভিন্ন বাজারের পরিস্থিতিতে দুর্দান্ত ঝুঁকির রিটার্ন সরবরাহ করতে পারে। একই সাথে, এই কৌশলটিতে অপ্টিমাইজেশনের জন্য প্রচুর জায়গা রয়েছে, বিশেষত প্যারামিটার অপ্টিমাইজেশন এবং নিয়ম অপ্টিমাইজেশনের দিক থেকে। সামগ্রিকভাবে, এই কৌশলটি স্থিতিশীল অতিরিক্ত লাভের সন্ধানে পরিমাণযুক্ত ব্যবসায়ীদের জন্য একটি দুর্দান্ত বেসিক সমাধান সরবরাহ করে।
/*backtest
start: 2023-03-02 00:00:00
end: 2024-03-07 00:00:00
period: 1d
basePeriod: 1h
exchanges: [{"eid":"Futures_Binance","currency":"BTC_USDT"}]
*/

// This source code is subject to the terms of the Mozilla Public License 2.0 at https://mozilla.org/MPL/2.0/

// Credits to the original Script - Range Filter DonovanWall https://www.tradingview.com/script/lut7sBgG-Range-Filter-DW/
// This version is the old version of the Range Filter with less settings to tinker with

//@version=5
strategy(title='Range Filter - B&S Signals', shorttitle='[Doan]_RF-B&S Signals', overlay=true)

//-----------------------------------------------------------------------------------------------------------------------------------------------------------------
//Functions
//-----------------------------------------------------------------------------------------------------------------------------------------------------------------
longLossPerc = input.float(title='Long Stop Loss (%)', minval=0.0, step=0.1, defval=1) * 0.01
shortLossPerc = input.float(title='Short Stop Loss (%)', minval=0.0, step=0.1, defval=1) * 0.01

longTakePerc = input.float(title='Long Take(%)', minval=0.0, step=0.1, defval=1) * 0.01
shortTakePerc = input.float(title='Short Take (%)', minval=0.0, step=0.1, defval=1) * 0.01

emaLength = input.int(200, title="EMA Length")

// Determine stop loss price

//Range Size Function
rng_size(x, qty, n) =>
    wper = n * 2 - 1
    avrng = ta.ema(math.abs(x - x[1]), n)
    AC = ta.ema(avrng, wper) * qty
    rng_size = AC

//Range Filter Function
rng_filt(x, rng_, n) =>
    r = rng_
    var rfilt = array.new_float(2, x)
    array.set(rfilt, 1, array.get(rfilt, 0))
    if x - r > array.get(rfilt, 1)
        array.set(rfilt, 0, x - r)
    if x + r < array.get(rfilt, 1)
        array.set(rfilt, 0, x + r)
    rng_filt1 = array.get(rfilt, 0)

    hi_band = rng_filt1 + r
    lo_band = rng_filt1 - r
    rng_filt = rng_filt1
    [hi_band, lo_band, rng_filt]

//-----------------------------------------------------------------------------------------------------------------------------------------------------------------
//Inputs
//-----------------------------------------------------------------------------------------------------------------------------------------------------------------

//Range Source
rng_src = input(defval=close, title='Swing Source')

//Range Period
rng_per = input.int(defval=20, minval=1, title='Swing Period')

//Range Size Inputs
rng_qty = input.float(defval=3.5, minval=0.0000001, title='Swing Multiplier')

//Bar Colors
use_barcolor = input(defval=false, title='Bar Colors On/Off')

//-----------------------------------------------------------------------------------------------------------------------------------------------------------------
//Definitions
//-----------------------------------------------------------------------------------------------------------------------------------------------------------------

//Range Filter Values
[h_band, l_band, filt] = rng_filt(rng_src, rng_size(rng_src, rng_qty, rng_per), rng_per)

//Direction Conditions
var fdir = 0.0
fdir := filt > filt[1] ? 1 : filt < filt[1] ? -1 : fdir
upward = fdir == 1 ? 1 : 0
downward = fdir == -1 ? 1 : 0

//Trading Condition
longCond = rng_src > filt and rng_src > rng_src[1] and upward > 0 or rng_src > filt and rng_src < rng_src[1] and upward > 0
shortCond = rng_src < filt and rng_src < rng_src[1] and downward > 0 or rng_src < filt and rng_src > rng_src[1] and downward > 0

CondIni = 0
CondIni := longCond ? 1 : shortCond ? -1 : CondIni[1]
longCondition = longCond and CondIni[1] == -1
shortCondition = shortCond and CondIni[1] == 1

//Colors
filt_color = upward ? #05ff9b : downward ? #ff0583 : #cccccc
bar_color = upward and rng_src > filt ? rng_src > rng_src[1] ? #05ff9b : #00b36b : downward and rng_src < filt ? rng_src < rng_src[1] ? #ff0583 : #b8005d : #cccccc


ema = ta.ema(close, emaLength)

//-----------------------------------------------------------------------------------------------------------------------------------------------------------------
//Outputs
//-----------------------------------------------------------------------------------------------------------------------------------------------------------------
longStopPrice = strategy.position_avg_price * (1 - longLossPerc)
shortStopPrice = strategy.position_avg_price * (1 + shortLossPerc)

longTakePrice = strategy.position_avg_price * (1 + longTakePerc)
shortTakePrice = strategy.position_avg_price * (1 - shortTakePerc)

//Filter Plot
filt_plot = plot(filt, color=filt_color, linewidth=3, title='Filter', transp=67)

//Band Plots
h_band_plot = plot(h_band, color=color.new(#05ff9b, 100), title='High Band')
l_band_plot = plot(l_band, color=color.new(#ff0583, 100), title='Low Band')

//Band Fills
fill(h_band_plot, filt_plot, color=color.new(#00b36b, 92), title='High Band Fill')
fill(l_band_plot, filt_plot, color=color.new(#b8005d, 92), title='Low Band Fill')

//Bar Color
barcolor(use_barcolor ? bar_color : na)
// Entry
strategy.entry("Long", strategy.long, when=longCondition)
strategy.entry("Short", strategy.short, when=shortCondition)

plot(ema)

//Plot Buy and Sell Labels
plotshape(longCondition, title='Buy Signal', text='BUY', textcolor=color.white, style=shape.labelup, size=size.normal, location=location.belowbar, color=color.new(color.green, 0))
plotshape(shortCondition, title='Sell Signal', text='SELL', textcolor=color.white, style=shape.labeldown, size=size.normal, location=location.abovebar, color=color.new(color.red, 0))

//Alerts
alertcondition(longCondition, title='Buy Alert', message='BUY')
alertcondition(shortCondition, title='Sell Alert', message='SELL')