সমর্থন, প্রতিরোধ এবং ভরবেগ সূচকের উপর ভিত্তি করে কৌশল অনুসরণ করে মাল্টি-টাইম ফ্রেম প্রবণতা
কৌশল ওভারভিউ
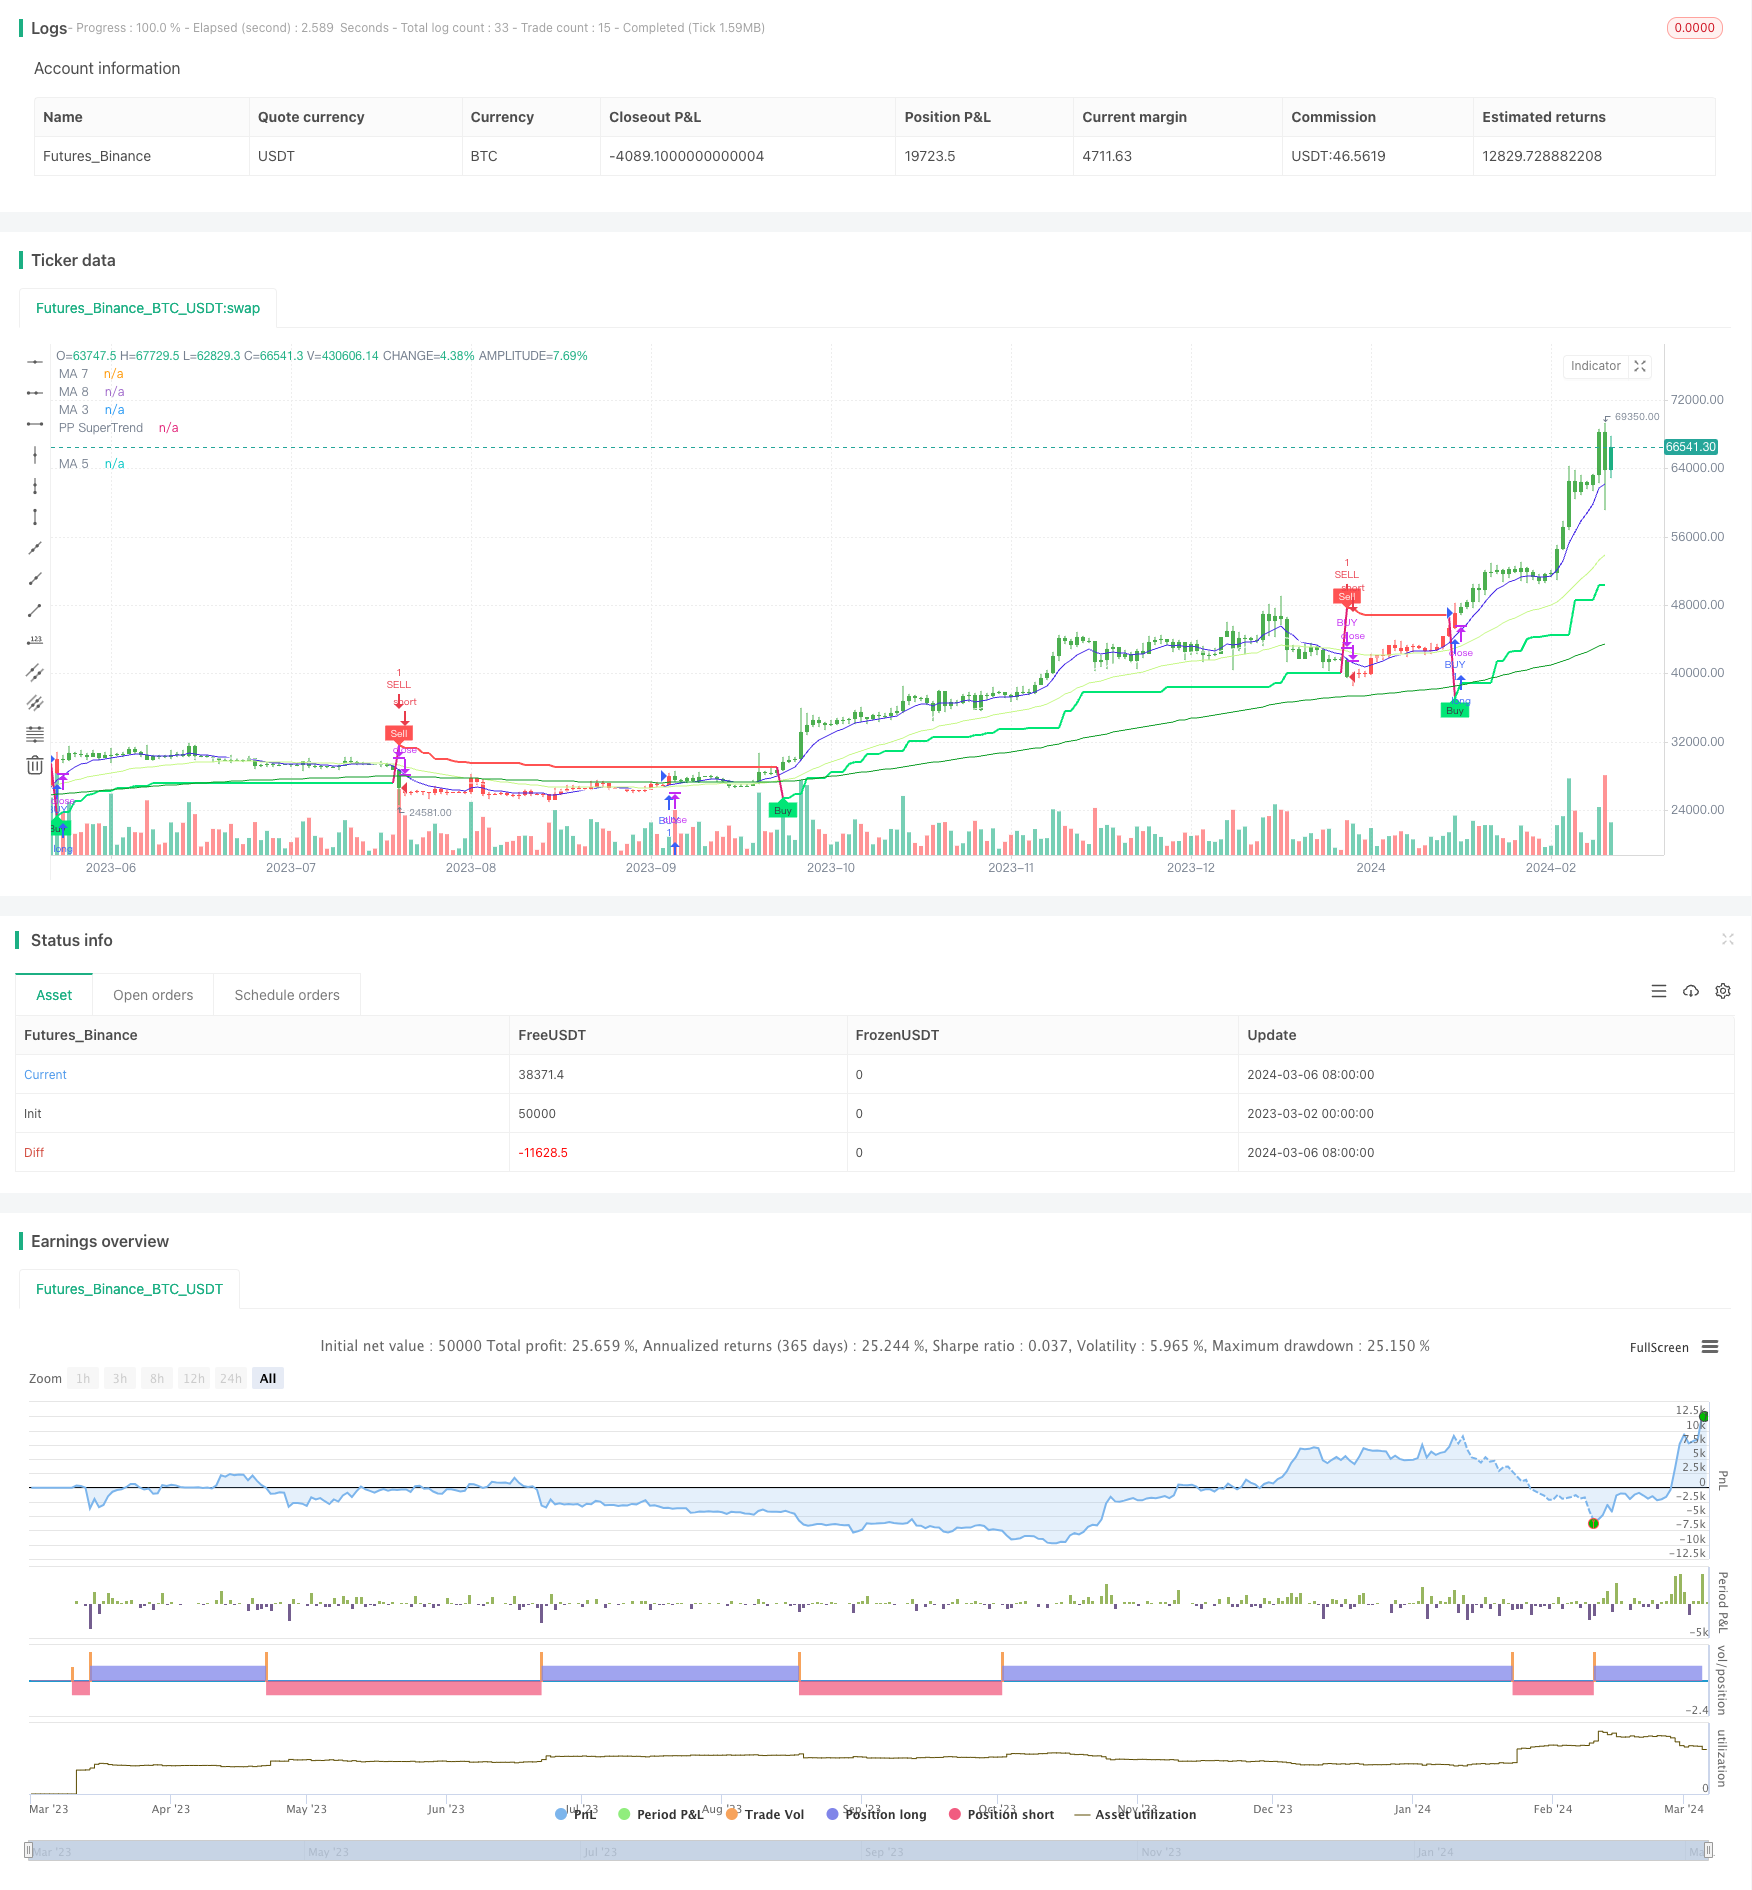
এই কৌশলটি সমর্থনকারী প্রতিরোধের স্তর, সুপার ট্রেন্ড সূচক এবং চলমান গড়ের মতো একাধিক প্রযুক্তিগত সূচক ব্যবহার করে, একাধিক সময় ফ্রেমের উপর প্রবণতা দিকের সমন্বিত বিচার করে, একটি প্রবণতা ট্র্যাকিং সিস্টেম বাস্তবায়ন করে। এই কৌশলটির মূল ধারণাটি হ’লঃ প্রথমে মূল পয়েন্টগুলি ব্যবহার করে বর্তমান দামের সমর্থনকারী প্রতিরোধের অবস্থান নির্ধারণ করুন, তারপরে সুপার ট্রেন্ড সূচকটি বর্তমান প্রবণতা দিকটি নির্ধারণ করুন, এবং শেষ পর্যন্ত চলমান গড়ের ফিল্টারটি চলমান পরিস্থিতি থেকে দূরে থাকুন। একই সাথে, কৌশলটি ঝুঁকি নিয়ন্ত্রণের পক্ষেও কাজ করে, যেমন ট্রেডিং টাইম উইন্ডো সেট করা, সর্বাধিক পজিশন সীমাবদ্ধ করা ইত্যাদি।
কৌশল নীতি
- প্রথমত, বর্তমান মূল্যের প্রতিরোধের স্তরটি পেতে পূর্ববর্তী নির্দিষ্ট সময়ের সর্বোচ্চ এবং সর্বনিম্ন মূল্যের উপর ভিত্তি করে মূল পয়েন্টটি গণনা করুন।
- সুপারট্রেন্ড একটি প্রবণতা ট্র্যাকিং সূচক যা গতিশীল সমর্থন প্রতিরোধের দ্বারা গণনা করা হয়।
- এটিআর স্টপ ব্যবহার করে। এই কৌশলটি মূল সুপারট্রেন্ডের উপর ভিত্তি করে এটিআরকে স্টপ হিসাবে যুক্ত করেছে।
- প্রবণতা ফিল্টার হিসাবে একটি চলমান গড় ব্যবহার করুন। কেবলমাত্র যখন প্রবণতা উচ্চতর হয় এবং দাম গড়ের উপরে থাকে তখনই বেশি করা হয়, এবং যখন প্রবণতা নিম্নমুখী হয় এবং দাম গড়ের নীচে থাকে তখনই খালি করা হয়।
- ট্রেডিং সময় উইন্ডো সেট করুন। শুধুমাত্র নির্দিষ্ট সময়ের মধ্যে পজিশন খুলুন, গুরুত্বপূর্ণ সময়ে ট্রেডিং এড়াতে।
- একাধিক খালি পজিশন আলাদাভাবে পরিচালনা করা হয়। একাধিক এবং খালি পজিশন সিগন্যালগুলি পৃথকভাবে খালি পজিশন লজিককে ট্রিগার করে।
সব মিলিয়ে বলা যায় যে, এই কৌশলটি মূল অক্ষের প্রতিরোধ, সুপার ট্রেন্ডের দিক এবং সমান্তরাল দিকের তিনটি শর্তের সাথে অনুরণিত হয় যখন পজিশন খোলা হয়, যে কোনও শর্তের ব্যর্থতা সমান্তরাল হয়। এটি কার্যকরভাবে প্রবণতাটি ধরে রাখে এবং ঝুঁকি নিয়ন্ত্রণ করে।
সামর্থ্য বিশ্লেষণ
- প্রতিরোধের স্তরের উপর ভিত্তি করে লেনদেনের সুবিধা হ’ল বাজারের সরবরাহ এবং চাহিদা আইন অনুসারে, কেন্দ্রীয় পয়েন্টটি বাজারের ভারসাম্যকে গতিশীলভাবে প্রতিক্রিয়া জানায়।
- সুপারট্রেন্ড কার্যকরভাবে ট্রেন্ডকে ক্যাপচার করে এবং সময়মতো স্টপডজ করে। এটিআর স্টপডজ আরও ঝুঁকি নিয়ন্ত্রণ করে।
- সমান্তরাল ফিল্টার বিপরীতমুখী ট্রেডিং এড়াতে সাহায্য করে। ট্রেন্ডিং এবং সমান্তরাল রেজোনেশনে প্রবেশ করলে, জয়ের সম্ভাবনা বেশি থাকে।
- কাস্টম ট্রেডিং টাইম উইন্ডোগুলি গুরুত্বপূর্ণ সময়গুলিতে ট্রেডিং এড়াতে সহায়তা করে, যেমন খোলার এবং বন্ধ হওয়ার আগে।
- মাল্টি হেড এবং খালি হেড সিগন্যালগুলি স্বতন্ত্রভাবে কাজ করে, একই সাথে একাধিক খালি অবস্থান ধারণ করে, বাজার সুযোগের আরও সম্পূর্ণ ব্যবহার করা যায়।
ঝুঁকি বিশ্লেষণ
- ট্রেডিংয়ের ঝুঁকিঃ এই কৌশলটি বাজারের ঘন ঘন পজিশনিং করতে পারে, যার ফলে ট্রেডিংয়ের খরচ বেশি হয়।
- বিপরীতমুখী ট্রেডিং এখনও সম্ভব। যদিও এই কৌশলটি মিডলাইন ফিল্টারিং ব্যবহার করে, তবে যদি মিডলাইন নিজেই বড় প্রবণতার বিপরীতে থাকে তবে বিপরীতমুখী ট্রেডিং এখনও সম্ভব।
- প্যারামিটার অপ্টিমাইজেশনের সমস্যা। কৌশলটিতে অনেকগুলি প্যারামিটার রয়েছে, যেমন সুপারট্রেন্ডের সময়কাল এবং গুণক, গড়ের সময়কাল ইত্যাদি। বিভিন্ন প্যারামিটারগুলি বিভিন্ন ফলাফল দেবে, কীভাবে সর্বোত্তম প্যারামিটার সমন্বয় চয়ন করা যায় তা চ্যালেঞ্জ।
- চরম পরিস্থিতিতে এই কৌশলটি কার্যকর নাও হতে পারে। যেমন, ধস, তরলতা সংকট ইত্যাদির মতো চরম পরিস্থিতিতে এই কৌশলটি সময়মতো বন্ধ হতে পারে না।
অপ্টিমাইজেশান দিক
- ট্রেডিংয়ের ক্ষেত্রে, ট্রেডিংয়ের সময়সীমা বাড়ানোর জন্য, মধ্যম ও দীর্ঘমেয়াদী গড় লাইন প্রবর্তন করা হয়েছে।
- উর্ধ্বমুখী বাজারগুলিতে কম লেনদেনের জন্য ব্রিনব্যান্ডের মতো অস্থিরতার সূচকগুলি প্রবর্তন করা বিবেচনা করা যেতে পারে।
- প্যারামিটারগুলিকে অপ্টিমাইজ করা, প্যারামিটারগুলির সর্বোত্তম সমন্বয় খুঁজে বের করা এবং কৌশল স্থিতিশীলতা বৃদ্ধি করা।
- চরম পরিস্থিতিতে হার্ড স্টপ সেট করুন, ঝুঁকি নিয়ন্ত্রণ করুন। এছাড়াও, বাজারের অস্বাভাবিক ওঠানামা যেমন মূল্যের উড়ন্ত, লেনদেনের পরিমাণ বৃদ্ধি ইত্যাদির বিচার অন্তর্ভুক্ত করার বিষয়টি বিবেচনা করা যেতে পারে, অস্বাভাবিক সময়ে ট্রেডিং হ্রাস বা বন্ধ করা যেতে পারে।
সারসংক্ষেপ
এই কৌশলটি সমর্থনকারী প্রতিরোধ, প্রবণতা ট্র্যাকিং, গতিশীল ফিল্টারিং এবং অন্যান্য বিভিন্ন প্রযুক্তিগত বিশ্লেষণের পদ্ধতিগুলিকে সংহত করে, যা প্রবণতা চলাকালীন কার্যকরভাবে লাভ অর্জন করতে পারে এবং প্রত্যাহারের ঝুঁকি নিয়ন্ত্রণ করতে পারে। এর সুবিধা হ’ল সংকেতগুলি স্পষ্ট, সংক্ষিপ্ত এবং যুক্তিসঙ্গতভাবে সুস্পষ্ট, যা মাঝারি-দীর্ঘ সময়কালের জন্য উপযুক্ত। তবে, এই কৌশলটিতে ঘন ঘন লেনদেন, প্যারামিটার অপ্টিমাইজেশনের অসুবিধা এবং চরম পরিস্থিতিতে ঝুঁকি নিয়ন্ত্রণের অভাব রয়েছে। ভবিষ্যতে আরও প্রযুক্তিগত সূচক প্রবর্তন, প্যারামিটার অপ্টিমাইজেশন, হার্ড স্টপ লস সেট, অস্বাভাবিক আচরণের বিচার ইত্যাদির মাধ্যমে আরও উন্নতি করা যেতে পারে। সামগ্রিকভাবে, এই কৌশলটি একটি পরিপক্ক প্রবণতি ট্র্যাকিং কৌশল, যা যথাযথ অপ্টিমাইজেশন এবং উন্নতির পরে একটি সুস্থ ট্রেডিং সিস্টেম হতে পারে। কৌশলটি ধারনা করা যেতে পারে, তবে প্রকৃত লেনদেন এবং বাজারের বৈশিষ্ট্যগুলি পরীক্ষা করা
/*backtest
start: 2023-03-02 00:00:00
end: 2024-03-07 00:00:00
period: 1d
basePeriod: 1h
exchanges: [{"eid":"Futures_Binance","currency":"BTC_USDT"}]
*/

//@rpcoelho
// Based on © Julien_Eche "Pivot Point Supertrend" with optional EMAs ploted
//@version=4

strategy("PPS w/ EMAs", overlay=true)

prd = input(defval = 1, title="Pivot Point Period", minval = 1, maxval = 50)
Factor=input(defval = 4, title = "ATR Factor", minval = 1, step = 0.1)
Pd=input(defval = 72, title = "ATR Period", minval=1)
showpivot = input(defval = false, title="Show Pivot Points")
showlabel = input(defval = true, title="Show Buy/Sell Labels")
showcl = input(defval = false, title="Show PP Center Line")
showsr = input(defval = false, title="Show Support/Resistance")

/////////////////////////////////////////////////////////////////////////
// Switch Board
////////////////////////////////////////////////////////////////////////
// Define the switch board title as a label (since grouping is not available)
//switchboard_group = "████ Switch Board (Turn On/Off Overlay Indicators) ████"
//label.new(bar_index, high, switchboard_group, color=color.red)
// Create input controls for EMA and VWAP switches
switch_ema = input(true, title="EMA")

/////////////////////////////////////////////////////////////////////////
// EMA Selection
////////////////////////////////////////////////////////////////////////

ma_function(source, length, type) =>
    float ma = na
    if type == 'RMA'
        ma := rma(source, length)
    else if type == 'SMA'
        ma := sma(source, length)
    else if type == 'EMA'
        ma := ema(source, length)
    else if type == 'WMA'
        ma := wma(source, length)
    else if type == 'HMA'
        ma := length < 2 ? hma(source, 2) : hma(source, length)
    else
        ma := vwma(source, length)
    ma

// Moving Averages Line Title
//ma_group = "██████████ MAs Line ██████████"

// Inputs for MA 1
len1bool = input(false, title="Show MA 1")
len1 = input(13, title="Length MA 1")
ma_1_type = input("EMA", title="Type MA 1", options=["RMA", "SMA", "EMA", "WMA", "HMA", "VWMA"])
src_ma1 = input(title="MA1 Source", type=input.source, defval=close)
ma_1_colour = input(color.rgb(235, 159, 238), title="Color MA 1")

// Inputs for MA 2
len2bool = input(false, title="Show MA 2")
len2 = input(17, title="Length MA 2")
ma_2_type = input("EMA", title="Type MA 2", options=["RMA", "SMA", "EMA", "WMA", "HMA", "VWMA"])
src_ma2 = input(title="MA2 Source", type=input.source, defval=close)
ma_2_colour = input(color.rgb(230, 241, 65), title="Color MA 2")

// Inputs for MA 3
len3bool = input(true, title="Show MA 3")
len3 = input(34, title="Length MA 3")
ma_3_type = input("EMA", title="Type MA 3", options=["RMA", "SMA", "EMA", "WMA", "HMA", "VWMA"])
src_ma3 = input(title="MA3 Source", type=input.source, defval=close)
ma_3_colour = input(#c7f887, title="Color MA 3")

// Inputs for MA 4
len4bool = input(false, title="Show MA 4")
len4 = input(72, title="Length MA 4")
ma_4_type = input("EMA", title="Type MA 4", options=["RMA", "SMA", "EMA", "WMA", "HMA", "VWMA"])
src_ma4 = input(title="MA4 Source", type=input.source, defval=close)
ma_4_colour = input(#2f6999, title="Color MA 4")

// Inputs for MA 5
len5bool = input(true, title="Show MA 5")
len5 = input(144, title="Length MA 5")
ma_5_type = input("EMA", title="Type MA 5", options=["RMA", "SMA", "EMA", "WMA", "HMA", "VWMA"])
src_ma5 = input(title="MA5 Source", type=input.source, defval=close)
ma_5_colour = input(color.rgb(13, 156, 37), title="Color MA 5")

// Inputs for MA 6
len6bool = input(true, title="Show MA 6")
len6 = input(610, title="Length MA 6")
ma_6_type = input("EMA", title="Type MA 6", options=["RMA", "SMA", "EMA", "WMA", "HMA", "VWMA"])
src_ma6 = input(title="MA6 Source", type=input.source, defval=close)
ma_6_colour = input(color.rgb(173, 161, 152), title="Color MA 6")

// Inputs for MA 7
len7bool = input(true, title="Show MA 7")
len7 = input(8, title="Length MA 7")
ma_7_type = input("EMA", title="Type MA 7", options=["RMA", "SMA", "EMA", "WMA", "HMA", "VWMA"])
src_ma7 = input(title="MA7 Source", type=input.source, defval=close)
ma_7_colour = input(color.rgb(68, 39, 231), title="Color MA 7")

// Inputs for MA 8
len8bool = input(true, title="Show MA 8")
len8 = input(21, title="Length MA 8")
ma_8_type = input("EMA", title="Type MA 8", options=["RMA", "SMA", "EMA", "WMA", "HMA", "VWMA"])
src_ma8 = input(title="MA8 Source", type=input.source, defval=close)
ma_8_colour = input(color.white, title="Color MA 8")

ema1 = security(syminfo.tickerid, timeframe.period, ma_function(src_ma1, len1, ma_1_type))
ema2 = security(syminfo.tickerid, timeframe.period, ma_function(src_ma2, len2, ma_2_type))
ema3 = security(syminfo.tickerid, timeframe.period, ma_function(src_ma3, len3, ma_3_type))
ema4 = security(syminfo.tickerid, timeframe.period, ma_function(src_ma4, len4, ma_4_type))
ema5 = security(syminfo.tickerid, timeframe.period, ma_function(src_ma5, len5, ma_5_type))
ema6 = security(syminfo.tickerid, timeframe.period, ma_function(src_ma6, len6, ma_6_type))
ema7 = security(syminfo.tickerid, timeframe.period, ma_function(src_ma7, len7, ma_7_type))
ema8 = security(syminfo.tickerid, timeframe.period, ma_function(src_ma8, len8, ma_8_type))

plot(len1bool and switch_ema ? ema1:na, color=ma_1_colour, linewidth=1, title='MA 1')
plot(len2bool and switch_ema? ema2:na, color=ma_2_colour, linewidth=1, title='MA 2')
plot(len3bool and switch_ema? ema3:na, color=ma_3_colour, linewidth=1, title='MA 3')
plot(len4bool and switch_ema? ema4:na, color=ma_4_colour, linewidth=1, title='MA 4')
plot(len5bool and switch_ema? ema5:na, color=ma_5_colour, linewidth=1, title='MA 5')
plot(len6bool and switch_ema? ema6:na, color=ma_6_colour, linewidth=2, title='MA 6')
plot(len7bool and switch_ema? ema7:na, color=ma_7_colour, linewidth=1, title='MA 7')
plot(len8bool and switch_ema? ema8:na, color=ma_8_colour, linewidth=1, title='MA 8')


// get Pivot High/Low
float ph = pivothigh(prd, prd)
float pl = pivotlow(prd, prd)

// drawl Pivot Points if "showpivot" is enabled
plotshape(ph and showpivot, text="H",  style=shape.labeldown, color=na, textcolor=color.red, location=location.abovebar, transp=0, offset = -prd)
plotshape(pl and showpivot, text="L",  style=shape.labeldown, color=na, textcolor=color.lime, location=location.belowbar, transp=0, offset = -prd)

// calculate the Center line using pivot points
var float center = na
float lastpp = ph ? ph : pl ? pl : na
if lastpp
    if na(center)
        center := lastpp
    else
        //weighted calculation
        center := (center * 2 + lastpp) / 3

// upper/lower bands calculation
Up = center - (Factor * atr(Pd))
Dn = center + (Factor * atr(Pd))

// get the trend
float TUp = na
float TDown = na
Trend = 0
TUp := close[1] > TUp[1] ? max(Up, TUp[1]) : Up
TDown := close[1] < TDown[1] ? min(Dn, TDown[1]) : Dn
Trend := close > TDown[1] ? 1: close < TUp[1]? -1: nz(Trend[1], 1)
Trailingsl = Trend == 1 ? TUp : TDown

// plot the trend
linecolor = Trend == 1 and nz(Trend[1]) == 1 ? color.lime : Trend == -1 and nz(Trend[1]) == -1 ? color.red : na
plot(Trailingsl, color = linecolor ,  linewidth = 2, title = "PP SuperTrend")

plot(showcl ? center : na, color = showcl ? center < hl2 ? color.blue : color.red : na)

// check and plot the signals
bsignal = Trend == 1 and Trend[1] == -1
ssignal = Trend == -1 and Trend[1] == 1
plotshape(bsignal and showlabel ? Trailingsl : na, title="Buy", text="Buy", location = location.absolute, style = shape.labelup, size = size.tiny, color = color.lime, textcolor = color.black, transp = 0)
plotshape(ssignal and showlabel ? Trailingsl : na, title="Sell", text="Sell", location = location.absolute, style = shape.labeldown, size = size.tiny, color = color.red, textcolor = color.white, transp = 0)

//get S/R levels using Pivot Points
float resistance = na
float support = na
support := pl ? pl : support[1]
resistance := ph ? ph : resistance[1]

// if enabled then show S/R levels
plot(showsr and support ? support : na, color = showsr and support ? color.lime : na, style = plot.style_circles, offset = -prd)
plot(showsr and resistance ? resistance : na, color = showsr and resistance ? color.red : na, style = plot.style_circles, offset = -prd)

// Trend Filter from SuperTrend Long Strategy
Periods = input(title="ATR Period", type=input.integer, defval=3)
src = input(hlc3, title="Source")
Multiplier = input(title="ATR Multiplier", type=input.float, step=0.1, defval=4.0)
changeATR = input(title="Change ATR Calculation Method ?", type=input.bool, defval=true)

// Combine the SuperTrend calculations
atr2 = sma(tr, Periods)
atr = changeATR ? atr(Periods) : atr2

up = src - (Multiplier * atr)
up1 = nz(up[1], up)
up := close[1] > up1 ? max(up, up1) : up

dn = src + (Multiplier * atr)
dn1 = nz(dn[1], dn)
dn := close[1] < dn1 ? min(dn, dn1) : dn

trend = 1
trend := nz(trend[1], trend)
trend := trend == -1 and close > dn1 ? 1 : trend == 1 and close < up1 ? -1 : trend

// Moving Average as Trend Filter
periodes_ma = input(title="Moving Average Period", type=input.integer, defval=20)
src_ma = input(title="Moving Average Source", type=input.source, defval=close)
ma = sma(src_ma, periodes_ma)

// Strategy Entry Conditions
FromMonth = input(defval = 1, title = "From Month", minval = 1, maxval = 12)
FromDay   = input(defval = 1, title = "From Day", minval = 1, maxval = 31)
FromYear  = input(defval = 2017, title = "From Year", minval = 999)
ToMonth   = input(defval = 1, title = "To Month", minval = 1, maxval = 12)
ToDay     = input(defval = 1, title = "To Day", minval = 1, maxval = 31)
ToYear    = input(defval = 9999, title = "To Year", minval = 999)

start     = timestamp(FromYear, FromMonth, FromDay, 00, 00)
finish    = timestamp(ToYear, ToMonth, ToDay, 23, 59)

window()  => true

// Combined entry conditions
longCondition = (trend == 1 and trend[1] == -1 and close > ma) or (bsignal and window())
shortCondition = (trend == -1 and trend[1] == 1 and close < ma) or (ssignal and window())

if (longCondition)
    strategy.entry("BUY", strategy.long)

if (shortCondition)
    strategy.close("BUY")
    strategy.entry("SELL", strategy.short)

buy1 = barssince((trend == 1 and trend[1] == -1 and close > ma) or (bsignal and window()))
sell1 = barssince((trend == -1 and trend[1] == 1 and close < ma) or (ssignal and window()))
color1 = buy1[1] < sell1[1] ? color.green : buy1[1] > sell1[1] ? color.red : na
barcolor(color1)