TrendHunter w/MF বহু সময়ফ্রেম ট্রেন্ড কৌশল

সংক্ষিপ্ত বিবরণ
TrendHunter w/MF মাল্টি-টাইমফ্রেম ট্রেন্ড স্ট্র্যাটেজি হল একটি ট্রেন্ড-ট্র্যাকিং কৌশল যা একাধিক প্রযুক্তিগত সূচক এবং মাল্টি-টাইমফ্রেম বিশ্লেষণের উপর ভিত্তি করে তৈরি। এই কৌশলটি বাজারের ক্লাউড চার্ট, মুভিং এভারেজ, সুপার ট্রেন্ড, ওয়েভ ট্রেন্ড এবং মানি ফ্লোর মতো বিষয়গুলিকে সমন্বিত করে, কঠোর শর্তের মাধ্যমে এন্ট্রি পয়েন্ট নির্ধারণ করে বাজারের প্রধান ট্রেন্ডকে ধরা।
কৌশলের নীতি
এই কৌশলের মূল নীতি হলো একাধিক টাইমফ্রেমে একাধিক প্রযুক্তিগত সূচকের সমন্বিত বিশ্লেষণ। নির্দিষ্টভাবে:
-
ইচিমোকু ক্লাউড (Ichimoku): দাম এবং ক্লাউডের আপেক্ষিক অবস্থান, সেইসাথে মুভিং এভারেজ এবং ক্লাউডের আপেক্ষিক অবস্থান বিশ্লেষণ করে বর্তমান বাজারের ট্রেন্ড নির্ধারণ করা হয়। যখন দাম ক্লাউডের উপরে থাকে এবং মুভিং এভারেজও ক্লাউডের উপরে থাকে, তখন সেটি ঊর্ধ্বমুখী ট্রেন্ড হিসেবে বিবেচিত হয়; বিপরীত অবস্থায় সেটি নিম্নমুখী ট্রেন্ড হিসেবে বিবেচিত হয়।
-
সুপার ট্রেন্ড (SuperTrend): দাম এবং সুপার ট্রেন্ডের আপেক্ষিক অবস্থান বিশ্লেষণ করে বর্তমান বাজারের ট্রেন্ড নিশ্চিত করা হয়। যখন দাম সুপার ট্রেন্ডের উপরে থাকে, তখন সেটি ঊর্ধ্বমুখী ট্রেন্ড হিসেবে বিবেচিত হয়; বিপরীত অবস্থায় সেটি নিম্নমুখী ট্রেন্ড হিসেবে বিবেচিত হয়।
-
ওয়েভ ট্রেন্ড (WaveTrend): ওয়েভ ট্রেন্ড সূচকের দিক এবং অবস্থান বিশ্লেষণ করে বর্তমান বাজারের ট্রেন্ড নির্ধারণ করা হয়। যখন ওয়েভ ট্রেন্ড ঊর্ধ্বমুখী হয় এবং ওভারবট জোনে না পৌঁছায়, তখন সেটি ঊর্ধ্বমুখী ট্রেন্ড হিসেবে বিবেচিত হয়; যখন ওয়েভ ট্রেন্ড নিম্নমুখী হয় এবং ওভারসোল্ড জোনে না পৌঁছায়, তখন সেটি নিম্নমুখী ট্রেন্ড হিসেবে বিবেচিত হয়।
-
মানি ফ্লো (MoneyFlow): মানি ফ্লো সূচকের অবস্থা বিশ্লেষণ করে বর্তমান বাজারের ট্রেন্ড নিশ্চিত করা হয়। যখন মানি ফ্লো ধনাত্মক থাকে, তখন সেটি ঊর্ধ্বমুখী ট্রেন্ড হিসেবে বিবেচিত হয়; বিপরীত অবস্থায় সেটি নিম্নমুখী ট্রেন্ড হিসেবে বিবেচিত হয়।
লং পজিশন নেওয়ার সময়, কৌশলটি প্রয়োজন করে যে দাম ক্লাউডের উপরে থাকবে, মুভিং এভারেজ ক্লাউডের উপরে থাকবে, সুপার ট্রেন্ড ঊর্ধ্বমুখী হবে, ওয়েভ ট্রেন্ড ঊর্ধ্বমুখী হবে এবং ওভারবট জোনে না থাকবে, এবং মানি ফ্লো ধনাত্মক হবে। শর্ট পজিশনের ক্ষেত্রে বিপরীত শর্ত প্রযোজ্য। এই বহু-সূচক, বহু-টাইমফ্রেমের কঠোর ফিল্টারিং সাইডওয়ে মার্কেটে ঘন ঘন ট্রেডিং কার্যকরভাবে এড়িয়ে চলে, যার ফলে কৌশলের স্থিতিশীলতা এবং নির্ভরযোগ্যতা বৃদ্ধি পায়।
সুবিধা বিশ্লেষণ
-
বহু-সূচকের সমন্বিত বিচার, উচ্চ নির্ভরযোগ্যতা: এই কৌশলটি একাধিক প্রযুক্তিগত সূচককে একত্রিত করে বিবেচনা করে। এই সূচকগুলি বিভিন্ন বাজারের অবস্থায় একে অপরের পরিপূরক, যা বাজারের ট্রেন্ডকে সম্পূর্ণরূপে প্রতিফলিত করতে পারে এবং একটি একক সূচকের সম্ভাব্য ভুল এড়ায়।
-
কঠোর এন্ট্রি শর্ত, ঘন ঘন ট্রেডিং এড়ানো: কৌশলটি কঠোর এন্ট্রি শর্ত নির্ধারণ করে, যেখানে একাধিক সূচককে একই সাথে পূরণ করতে হয়। এটি সাইডওয়ে মার্কেটে ঘন ঘন ট্রেডিং কার্যকরভাবে এড়িয়ে চলে এবং কৌশলের লস কমায়।
-
মাল্টি-টাইমফ্রেম বিশ্লেষণ, বড় ট্রেন্ড ধরা: কৌশলটি একাধিক টাইমফ্রেমে বিশ্লেষণ করে, যা কৌশলটিকে একটি বৃহত্তর দৃষ্টিকোণ থেকে বাজারের প্রধান ট্রেন্ড ধরতে সাহায্য করে এবং স্বল্পমেয়াদী নয়েজ দ্বারা প্রভাবিত হওয়া থেকে রক্ষা করে।
-
স্পষ্ট স্টপ-লস কৌশল, নিয়ন্ত্রিত ঝুঁকি: কৌশলটি স্টপ-লস শর্ত হিসেবে সুপার ট্রেন্ড ব্যবহার করে। একবার বাজারের ট্রেন্ড পরিবর্তিত হলে, কৌশলটি সময়মতো স্টপ-লস নিতে পারে, যার ফলে লস একটি গ্রহণযোগ্য সীমার মধ্যে নিয়ন্ত্রণ করা যায়।
ঝুঁকি বিশ্লেষণ
-
গতিশীল সমন্বয়ের অভাব, বাজার পরিবর্তনের সাথে মানিয়ে নেওয়ার সীমিত ক্ষমতা: এই কৌশলের প্যারামিটার সেটিংস নির্দিষ্ট, বাজারের অবস্থার উপর ভিত্তি করে গতিশীলভাবে সমন্বয় করার ক্ষমতা নেই। বাজারের অবস্থায় বড় পরিবর্তন ঘটলে কৌশলটি অকার্যকর হয়ে যেতে পারে।
-
অত্যন্ত কঠোর এন্ট্রি শর্ত, সুযোগ হারানোর সম্ভাবনা: কৌশলের এন্ট্রি শর্ত অত্যন্ত কঠোর। এটি ঘন ঘন ট্রেডিং এড়ালেও, কৌশলটি কিছু ভালো এন্ট্রি সুযোগ হারিয়ে ফেলতে পারে।
-
চরম বাজার পরিস্থিতির সাথে অভিযোজন ক্ষমতা অজানা: কৌশলটি সাধারণ বাজার অবস্থায় ভালো পারফর্ম করে, কিন্তু দ্রুত এবং বড় মূল্য পরিবর্তনের মতো চরম পরিস্থিতিতে কৌশলটির অভিযোজন ক্ষমতা এখনও যাচাই করা বাকি।
-
স্টপ-লস কৌশল তুলনামূলকভাবে সরল, অপ্টিমাইজেশনের সুযোগ রয়েছে: বর্তমানে কৌশলটি শুধুমাত্র স্টপ-লস শর্ত হিসেবে সুপার ট্রেন্ড ব্যবহার করে। এটি সহজ এবং স্পষ্ট হলেও, ঝুঁকি আরও ভালোভাবে নিয়ন্ত্রণ করতে স্টপ-লস কৌশলটি আরও অপ্টিমাইজ করার সুযোগ রয়েছে।
অপ্টিমাইজেশন দিকনির্দেশনা
-
বাজারের অবস্থা নির্ণয়ের সূচক যুক্ত করা, প্যারামিটার গতিশীলভাবে সমন্বয় করা: বাজারের অবস্থা নির্ণয়ের জন্য কিছু সূচক যেমন ভোলাটিলিটি সূচক ইত্যাদি যুক্ত করার কথা বিবেচনা করা যেতে পারে। বাজারের অবস্থার পরিবর্তনের উপর ভিত্তি করে কৌশলের প্যারামিটারগুলি গতিশীলভাবে সমন্বয় করে বিভিন্ন বাজার পরিবেশের সাথে খাপ খাইয়ে নেওয়া যায়।
-
এন্ট্রি শর্ত অপ্টিমাইজ করা, সংবেদনশীলতা বৃদ্ধি করা: এন্ট্রি শর্ত অপ্টিমাইজ করার কথা বিবেচনা করা যেতে পারে, যেমন আরও নিশ্চিতকরণ সূচক যুক্ত করা। এর ফলে নির্ভরযোগ্যতা বজায় রেখে কৌশলের সংবেদনশীলতা বাড়ানো যায় এবং আরও ট্রেডিং সুযোগ ধরা যায়।
-
চরম বাজার পরিস্থিতির মোকাবিলার ব্যবস্থা যোগ করা: দ্রুত এবং বড় মূল্য পরিবর্তনের মতো চরম পরিস্থিতির জন্য কিছু বিশেষ প্রতিকারমূলক ব্যবস্থা যেমন স্টপ-লসের মাত্রা বাড়ানো বা ট্রেডিং স্থগিত করা ইত্যাদি যুক্ত করার কথা বিবেচনা করা যেতে পারে, যাতে চরম পরিস্থিতিতে কৌশলের ঝুঁকি কমানো যায়।
-
স্টপ-লস কৌশল অপ্টিমাইজ করা, ঝুঁকি নিয়ন্ত্রণ ক্ষমতা বৃদ্ধি করা: আরও স্টপ-লস শর্ত যেমন টাইম স্টপ-লস, ট্রেলিং স্টপ-লস ইত্যাদি যুক্ত করার কথা বিবেচনা করা যেতে পারে। এছাড়াও কিছু গতিশীল স্টপ-লস কৌশল যেমন ট্রেলিং স্টপ-লস ব্যবহার করে ঝুঁকি আরও ভালোভাবে নিয়ন্ত্রণ করা যায়।
সারসংক্ষেপ
TrendHunter w/MF মাল্টি-টাইমফ্রেম ট্রেন্ড স্ট্র্যাটেজি হল একটি বহু-সূচক এবং বহু-টাইমফ্রেম বিশ্লেষণের উপর ভিত্তি করে তৈরি ট্রেন্ড-ট্র্যাকিং কৌশল। এই কৌশলটি ইচিমোকু ক্লাউড, মুভিং এভারেজ, সুপার ট্রেন্ড, ওয়েভ ট্রেন্ড এবং মানি ফ্লোর মতো বিষয়গুলিকে সমন্বিত করে, কঠোর এন্ট্রি শর্ত এবং মাল্টি-টাইমফ্রেম বিশ্লেষণের মাধ্যমে বাজারের প্রধান ট্রেন্ড নির্ভরযোগ্যভাবে ধরতে পারে এবং সাইডওয়ে মার্কেটে ঘন ঘন ট্রেডিং এড়াতে পারে। এটির স্থিতিশীলতা এবং নির্ভরযোগ্যতা ভালো।
একই সাথে, এই কৌশলটির কিছু সীমাবদ্ধতা এবং ঝুঁকি রয়েছে, যেমন গতিশীল সমন্বয়ের অভাব, এন্ট্রি শর্ত অত্যন্ত কঠোর হতে পারে, চরম বাজার পরিস্থিতির সাথে অভিযোজন ক্ষমতা অজানা, এবং স্টপ-লস কৌশল তুলনামূলকভাবে সরল। এগুলি ভবিষ্যতে এই কৌশলটি অপ্টিমাইজ এবং উন্নত করার দিকনির্দেশনা।
সামগ্রিকভাবে, TrendHunter w/MF মাল্টি-টাইমফ্রেম ট্রেন্ড স্ট্র্যাটেজি একটি ভালো সম্ভাবনাসম্পন্ন ট্রেন্ড-ট্র্যাকিং কৌশল। এই কৌশলটি ব্যবহার করার সময়, ট্রেডারদের এর নীতি, সুবিধা এবং ঝুঁকি সম্পর্কে সম্পূর্ণ ধারণা থাকা উচিত এবং নিজের ঝুঁকি সহনশীলতা ও ট্রেডিং শৈলী অনুসারে প্রয়োজনীয় সমন্বয় ও অপ্টিমাইজেশন করা উচিত। একইসাথে, বাজারের অবস্থার পরিবর্তনের প্রতি নজর রাখতে হবে এবং সময়মতো কৌশলটি সমন্বয় করতে হবে। গভীরভাবে বুঝে এবং সাবধানে ব্যবহার করলেই এই কৌশলটি তার সম্ভাব্য সুবিধাগুলি কাজে লাগাতে পারে এবং ট্রেডারদের জন্য স্থিতিশীল মুনাফা আনতে পারে।
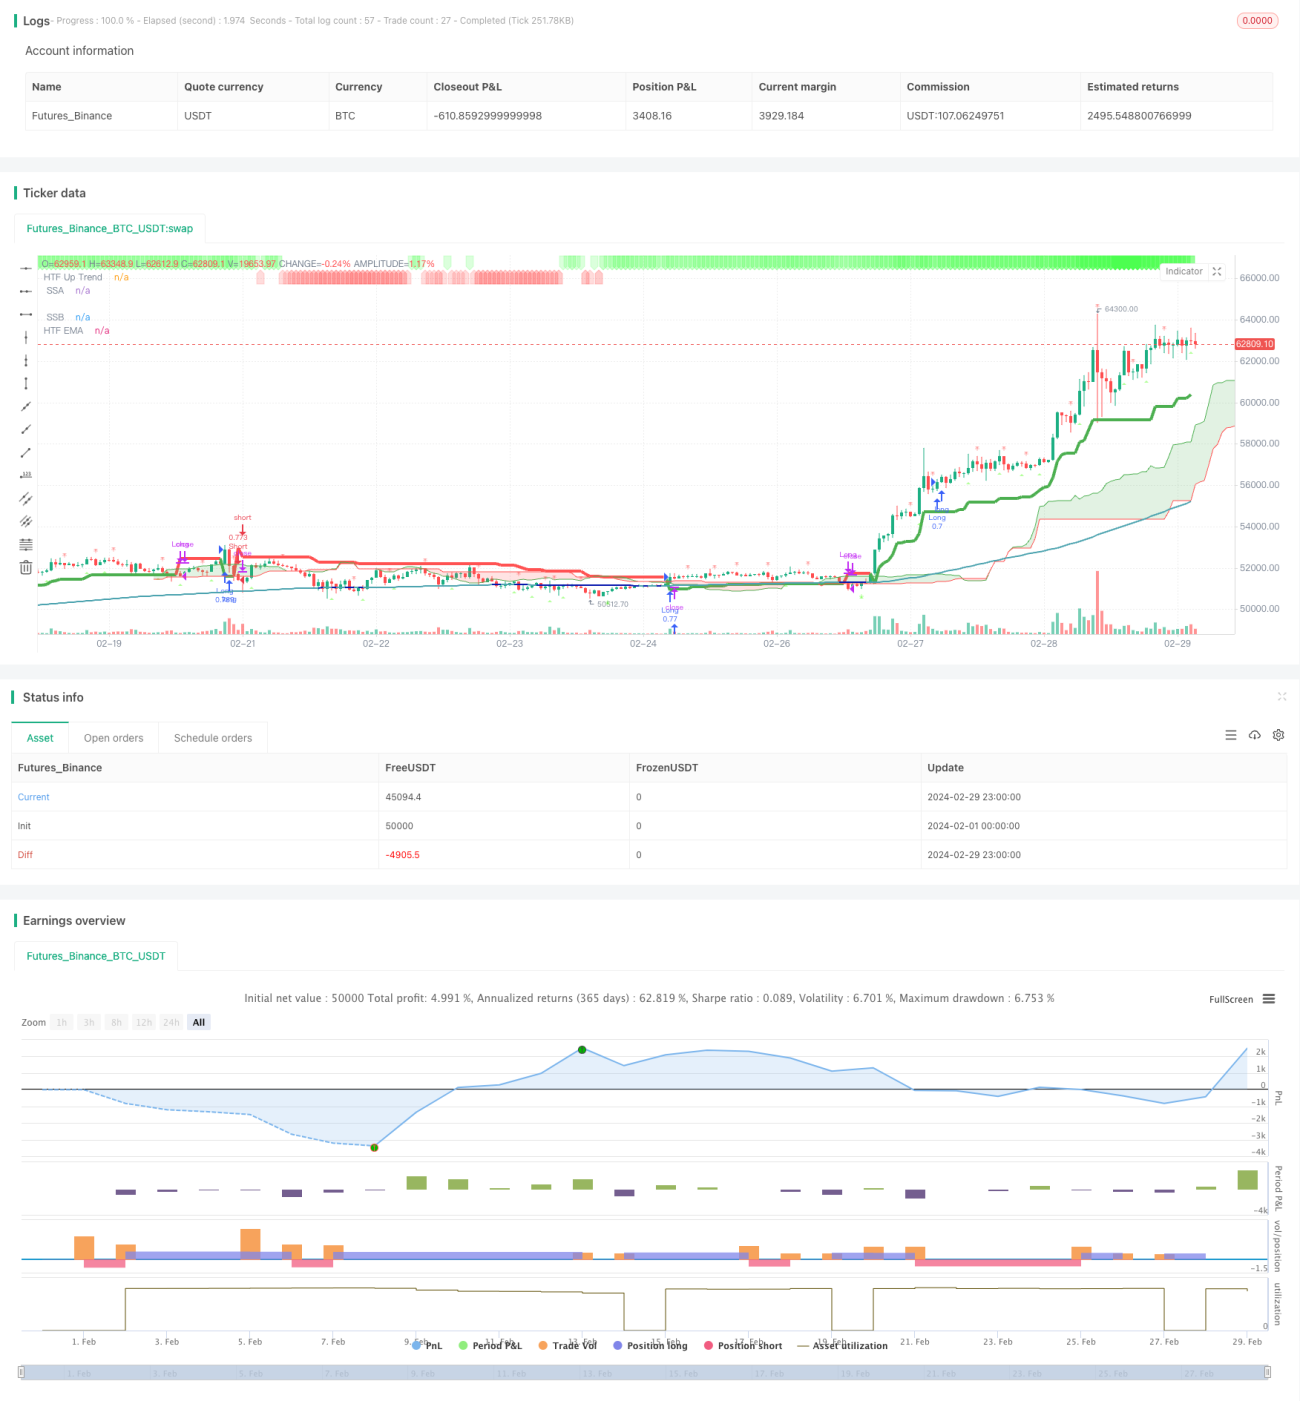
/*backtest
start: 2024-02-01 00:00:00
end: 2024-02-29 23:59:59
period: 1h
basePeriod: 15m
exchanges: [{"eid":"Futures_Binance","currency":"BTC_USDT"}]
*/

// This Pine Script™ code is subject to the terms of the Mozilla Public License 2.0 at https://mozilla.org/MPL/2.0/
// © godzcopilot / blockybears

// Thanks to anthonyf50 for his MTF Ichimoku https://www.tradingview.com/script/Pw9cBFma/- 1