সূচকীয় মুভিং এভারেজ ক্রসওভার পরিমাণগত ট্রেডিং কৌশল

ওভারভিউ
এই কৌশলটি দুটি সূচকীয় চলমান গড় (ইএমএ) এর ক্রস ব্যবহার করে একটি ক্রয়-বিক্রয় সংকেত হিসাবে। যখন সংক্ষিপ্ত সময়ের ইএমএ নীচে থেকে উপরে দীর্ঘ সময়ের ইএমএ অতিক্রম করে, তখন একটি ক্রয় সংকেত উত্পন্ন হয়; বিপরীতভাবে, যখন সংক্ষিপ্ত সময়ের ইএমএ উপরে থেকে নীচে দীর্ঘ সময়ের ইএমএ অতিক্রম করে, তখন একটি বিক্রয় সংকেত উত্পন্ন হয়। একই সাথে, কৌশলটি বিচার করে যে ক্রস পয়েন্টটি সাম্প্রতিক 10 টি ট্রেডিং চক্রের মধ্যে সর্বোচ্চ বা সর্বনিম্ন দাম কিনা, যাতে প্রবণতার শক্তি নিশ্চিত করা যায়। যদি ক্রস পয়েন্টটি সর্বোচ্চ হয় তবে দামটি পটভূমিতে সবুজ দেখানো হবে; যদি সর্বনিম্ন হয় তবে লাল দেখানো হবে।
কৌশল নীতি
- ডিফল্টভাবে 5 এবং 10 <unk> পিরিয়ডের দুটি ভিন্ন পিরিয়ডের EMA গণনা করুন।
- দুটি ইএমএ ক্রস হয় কিনা তা বিচার করার জন্য, যদি স্বল্পমেয়াদী ইএমএ নীচে থেকে উপরে দীর্ঘমেয়াদী ইএমএ অতিক্রম করে তবে একটি কেনার সংকেত উত্পন্ন হয়; যদি স্বল্পমেয়াদী ইএমএ উপরে থেকে নীচে দীর্ঘমেয়াদী ইএমএ অতিক্রম করে তবে একটি বিক্রয় সংকেত উত্পন্ন হয়।
- ক্রস সিগন্যাল তৈরি করার সময়, বিচার করুন যে বর্তমান ক্রস পয়েন্টটি সাম্প্রতিক 10 টি ট্রেডিং চক্রের মধ্যে সর্বোচ্চ বা সর্বনিম্ন দাম কিনা। যদি সর্বোচ্চ দাম হয় তবে এটি একটি শক্তিশালী উত্থানের প্রবণতা বলে মনে করা হয়; যদি সর্বনিম্ন দাম হয় তবে এটি একটি শক্তিশালী পতনের প্রবণতা বলে মনে করা হয়।
- যদি কেনার সংকেত আসে এবং বর্তমানে কোন পজিশন নেই, তবে অতিরিক্ত অর্ডার খুলুন; যদি বিক্রয় সংকেত আসে এবং বর্তমানে কোন পজিশন নেই, তবে খালি অর্ডার খুলুন।
- যদি একাধিক কয়েন থাকে এবং স্বল্পমেয়াদী ইএমএ উপরে থেকে নীচে দীর্ঘমেয়াদী ইএমএ অতিক্রম করে, তবে একাধিক কয়েন বন্ধ হয়ে যায়; যদি ইতিমধ্যে খালি কয়েন থাকে এবং স্বল্পমেয়াদী ইএমএ নীচে থেকে উপরে দীর্ঘমেয়াদী ইএমএ অতিক্রম করে, তবে খালি কয়েন।
কৌশলগত সুবিধা
- ইন্ডেক্সনাল মুভিং এভারেজ সহজ মুভিং এভারেজের তুলনায় দামের পরিবর্তনের প্রতি আরও দ্রুত প্রতিক্রিয়া জানায়, যার ফলে আরও সময়োপযোগী ট্রেডিং সিগন্যাল তৈরি করা যায়।
- ক্রসিং পয়েন্টটি সাম্প্রতিক সর্বোচ্চ বা সর্বনিম্ন দাম কিনা তা বিচার করে, ট্রেন্ডের শক্তির সাথে আরও বড় ব্যবসায়ের সুযোগগুলি বাছাই করা যায় এবং কৌশলগত উপার্জন বাড়ানো যায়।
- ক্রস পয়েন্টের দাম চার্টে চিহ্নিত করা হয়েছে, যা ব্যবসায়ীদের জন্য আরও স্বজ্ঞাত লেনদেনের রেফারেন্স সরবরাহ করে।
- কোড লজিক পরিষ্কার, সহজে বোঝা এবং বাস্তবায়ন করা যায়।
কৌশলগত ঝুঁকি
- ইএমএ ক্রস থেকে প্রাপ্ত সংকেতগুলি বিলম্বিত হতে পারে, যার ফলে সেরা ট্রেডিং সময় মিস করা যায়।
- অস্থির বাজারে, ইএমএ ক্রসিং ঘন ঘন ঘটতে পারে, যার ফলে অতিরিক্ত লেনদেন হয় এবং লেনদেনের খরচ বৃদ্ধি পায়।
- এই কৌশলটিতে ক্ষতির জন্য কোন ব্যবস্থা নেই, এবং যদি ভুল সিদ্ধান্ত নেওয়া হয়, তাহলে প্রত্যাহারের ঝুঁকি অনেক বেশি হতে পারে।
কৌশল অপ্টিমাইজেশনের দিকনির্দেশনা
- প্রবণতা শক্তি এবং দিক নির্ণয় করতে সাহায্য করার জন্য আরএসআই, এমএসিডি ইত্যাদির মতো আরও প্রযুক্তিগত সূচকগুলি প্রবর্তন করা, সংকেতের নির্ভুলতা উন্নত করা।
- একক লেনদেনের ঝুঁকি নিয়ন্ত্রণের জন্য যুক্তিসঙ্গত স্টপ লস এবং স্টপ পয়েন্ট সেট করুন।
- ট্রেডিং প্যারামিটারগুলিকে অপ্টিমাইজ করুন, যেমন ইএমএ চক্র, ক্রস কনফার্মেশন টাইম উইন্ডো ইত্যাদি, কৌশলগত অভিযোজনযোগ্যতা বাড়ানোর জন্য।
- ট্রেডিং সিগন্যাল ফিল্টার করার জন্য মার্কেট সেন্টিমেন্ট ইন্ডিকেটর যেমন ভিআইএক্স ব্যবহার করা হয়, যাতে ভুল সংকেত কম হয়।
- পজিশন ম্যানেজমেন্ট এবং ফান্ড ম্যানেজমেন্ট মডিউল যুক্ত করার কথা বিবেচনা করুন, প্রতিটি লেনদেনের জন্য তহবিলের পরিমাণকে গতিশীলভাবে সামঞ্জস্য করুন, তহবিলের ব্যবহারের দক্ষতা বাড়ান।
সারসংক্ষেপ
এই কৌশলটি সূচকীয় চলমান গড়ের ক্রসকে কেন্দ্রীয় লজিক হিসাবে গ্রহণ করে এবং ক্রস পয়েন্টের দামের সাম্প্রতিক সময়ের তুলনামূলক অবস্থানগুলির সাথে মিলিত হয় যাতে প্রবণতার শক্তি বিচার করা যায়। সামগ্রিকভাবে, কৌশলটির যুক্তি পরিষ্কার এবং সুবিধাগুলি সুস্পষ্ট, তবে কিছু সীমাবদ্ধতা এবং ঝুঁকিও রয়েছে। আরও সহায়ক বিচারক সূচক প্রবর্তন করে, যুক্তিসঙ্গত ঝুঁকি নিয়ন্ত্রণ ব্যবস্থা স্থাপন করে এবং মূল প্যারামিটারগুলি অপ্টিমাইজ করে কৌশলটির স্থায়িত্ব এবং লাভজনকতা আরও বাড়ানো যায়।
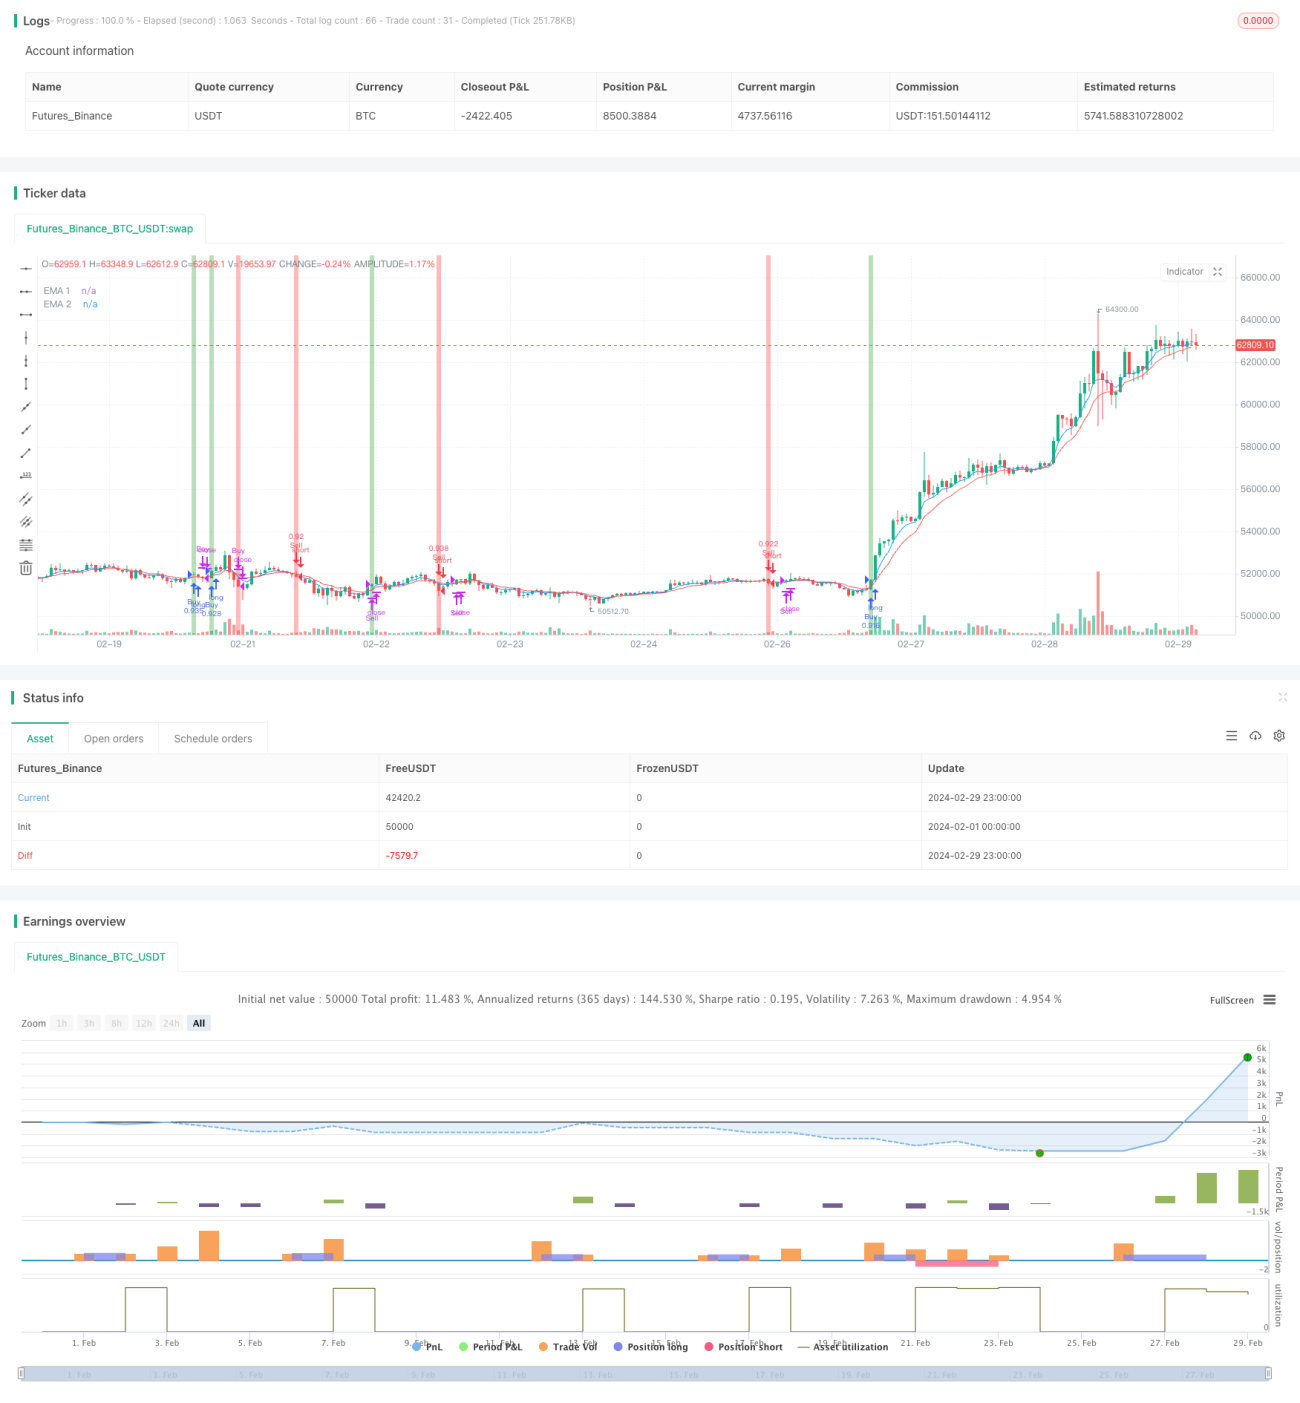
/*backtest
start: 2024-02-01 00:00:00
end: 2024-02-29 23:59:59
period: 1h
basePeriod: 15m
exchanges: [{"eid":"Futures_Binance","currency":"BTC_USDT"}]
*/

// This source code is subject to the terms of the Mozilla Public License 2.0 at https://mozilla.org/MPL/2.0/
// © ZenAndTheArtOfTrading
// @version=5
strategy("ema giao nhau", overlay=true, default_qty_type=strategy.percent_of_equity, default_qty_value=100)- 1