কৌশল অনুসরণ করে পরিবর্তিত আপেক্ষিক শক্তি সূচক প্রবণতা
ওভারভিউ
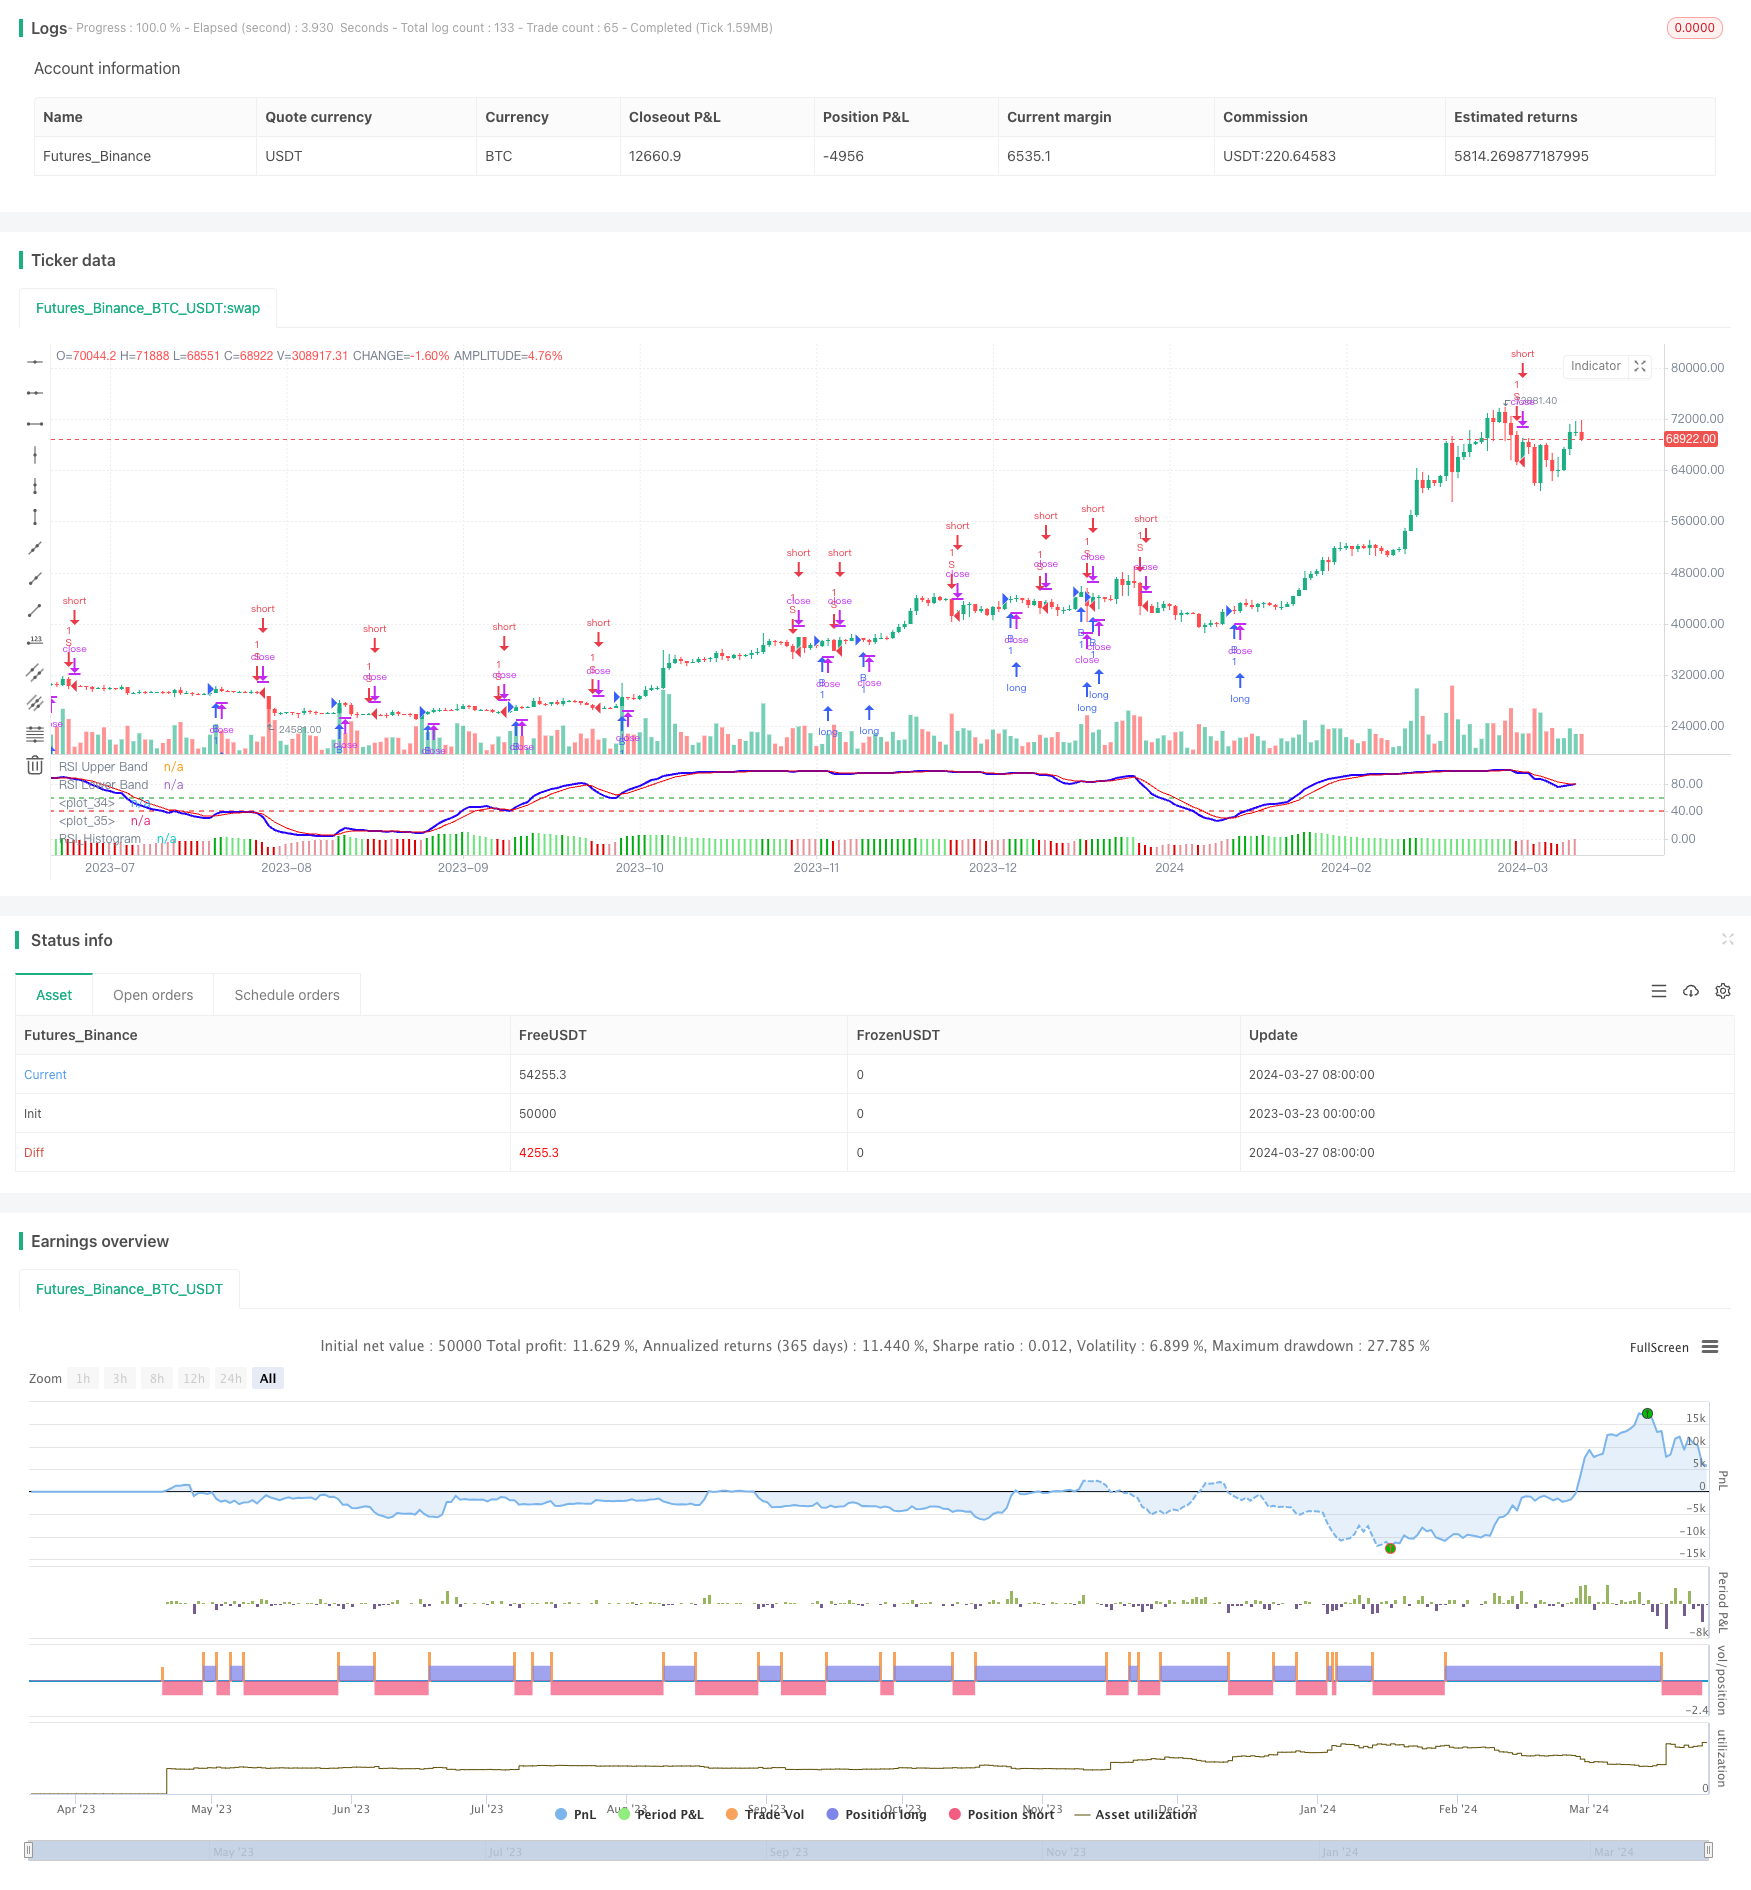
এই কৌশলটি সংশোধিত তুলনামূলকভাবে দুর্বল সূচকের উপর ভিত্তি করে বাজার প্রবণতা ক্যাপচার করে। কৌশলটির মূল ধারণাটি হ’ল পরিবর্তিত আরএসআই সূচকের ক্রস সংকেত এবং ডাইরেক্ট গ্রাফ সংকেত ব্যবহার করে বাজার প্রবণতা বিচার করা এবং প্রবণতার দিকনির্দেশের ভিত্তিতে বাণিজ্য করা।
কৌশল নীতি
- পরিবর্তিত RSI ইনপুট হিসাবে মূল্য EMA গণনা
- সংশোধিত RSI গণনা
- সংকেত লাইন হিসাবে পরিবর্তিত RSI এর EMA গণনা করুন
- সংশোধিত আরএসআই এবং সিগন্যাল লাইনের পার্থক্য গণনা করুন
- যখন Modified RSI-এর উপর সিগন্যাল লাইন অতিক্রম করে এবং ডায়াগনামিক গ্রাফটি 0 এর চেয়ে বড় হয়, তখন একটি ক্রয় সংকেত তৈরি হয়
- যখন Modified RSI এর নিচে সিগন্যাল লাইন অতিক্রম করে এবং ডাইরেক্ট গ্রাফটি 0 এর চেয়ে ছোট হয়, তখন বিক্রয় সংকেত তৈরি হয়
কৌশলগত সুবিধা
- Modified RSI সূচকটি প্রচলিত RSI সূচকের তুলনায় ট্রেন্ডকে আরও ভালভাবে ক্যাপচার করে
- Modified RSI এর ক্রস সিগন্যাল এবং রৈখিক মানচিত্রের সংকেত সংযুক্ত করে, যা কার্যকরভাবে জাল সংকেতগুলি ফিল্টার করে
- প্যারামিটারগুলি বিভিন্ন বাজার এবং সময়কালের জন্য সামঞ্জস্যপূর্ণ
- সহজ এবং কার্যকরী
কৌশলগত ঝুঁকি
- সংশোধিত RSI সূচকটি বাজারের অস্থিরতার সময় ভুল সংকেত দিতে পারে
- ট্রেন্ড টার্নিং পয়েন্ট ধরা দেরিতে হতে পারে
- একক সূচক মূল্যের গোলমালের দ্বারা প্রভাবিত হয়
কৌশল অপ্টিমাইজেশনের দিকনির্দেশনা
- অন্যান্য প্রবণতা সূচক যেমন চলমান গড়ের সাথে সংযুক্ত করা যেতে পারে, যা সংকেতের নির্ভরযোগ্যতা বাড়ায়
- একক লেনদেনের ঝুঁকি নিয়ন্ত্রণের জন্য স্টপ লস স্টপ মডিউল যুক্ত করা যেতে পারে
- বিভিন্ন বাজারের বৈশিষ্ট্য অনুসারে প্যারামিটারগুলি অপ্টিমাইজ করা যায়
- পজিশন ম্যানেজমেন্ট মডিউল যোগ করুন, গতিশীলভাবে পজিশন সামঞ্জস্য করুন
সারসংক্ষেপ
এই কৌশলটি ট্রেডিং সিস্টেমটি ট্রেডিং ট্র্যাকিংয়ের দৃষ্টিকোণ থেকে তৈরি করার জন্য পরিবর্তিত RSI সূচকের বৈশিষ্ট্যগুলি ব্যবহার করে। পরিবর্তিত RSI সূচকটি প্রচলিত RSI সূচকের কিছু ত্রুটিগুলি কাটিয়ে উঠেছে এবং প্রবণতা ক্যাপচার করার ক্ষমতা তুলনামূলকভাবে শক্তিশালী। তবে একক সূচকের কৌশলগুলি প্রায়শই সীমাবদ্ধ থাকে এবং অন্যান্য প্রযুক্তিগত উপকরণগুলির সাথে মিলিত হওয়ার প্রয়োজন। কৌশল প্যারামিটারগুলি অনুকূলিতকরণ, সংকেত উত্সকে সমৃদ্ধ করা, বায়ু নিয়ন্ত্রণ মডিউল যুক্ত করা ইত্যাদির মতো পদ্ধতিগুলি দ্বারা কৌশলটির স্থিতিশীলতা এবং লাভজনকতা আরও বাড়ানো যেতে পারে।
/*backtest
start: 2023-03-23 00:00:00
end: 2024-03-28 00:00:00
period: 1d
basePeriod: 1h
exchanges: [{"eid":"Futures_Binance","currency":"BTC_USDT"}]
*/

// This source code is subject to the terms of the Mozilla Public License 2.0 at https://mozilla.org/MPL/2.0/
// © YogirajDange

//@version=5


// Verical lines


// // Define the times
// t1 = timestamp(year, month, dayofmonth, 09, 15) // 9:15
// t2 = timestamp(year, month, dayofmonth, 11, 15) // 11:15
// t3 = timestamp(year, month, dayofmonth, 13, 15) // 1:15
// t4 = timestamp(year, month, dayofmonth, 15, 25) // 3:25

// // Check if the current bar is on the current day
// is_today = (year(time) == year(timenow)) and (month(time) == month(timenow)) and (dayofmonth(time) == dayofmonth(timenow))

// // Draw a vertical line at each time
// if is_today and (time == t1 or time == t2 or time == t3 or time == t4)
//     line.new(x1 = bar_index, y1 = low, x2 = bar_index, y2 = high, extend = extend.both, color=color.red, width = 1)

strategy('Modified RSI')
col_grow_above = input(#02ac11, "Above   Grow", group="Histogram", inline="Above")
col_fall_above = input(#6ee47d, "Fall", group="Histogram", inline="Above")
col_grow_below = input(#e5939b, "Below Grow", group="Histogram", inline="Below")
col_fall_below = input(#dd0000, "Fall", group="Histogram", inline="Below")
EMA_length = input.int(13, 'Price_EMA', minval=1)
RSI_length = input.int(14, 'RSI_Period', minval=1)
Avg_length = input.int(5, 'RSI_Avg_EMA', minval=1)
fastMA = ta.ema(close, EMA_length)
modrsi = ta.rsi(fastMA, RSI_length)
RSIAVG = ta.ema(modrsi, Avg_length)
plot(modrsi, color=color.rgb(38, 0, 255), linewidth=2)
plot(RSIAVG, color=color.rgb(247, 0, 0))
rsiUpperBand = hline(60, 'RSI Upper Band', color=#099b0e)
//hline(50, "RSI Middle Band", color=color.new(#787B86, 50))
rsiLowerBand = hline(40, 'RSI Lower Band', color=#e90101)

RSI_hist = modrsi - RSIAVG

//plot(RSI_hist,"RSI_Histogram", color = #c201e9, style = plot.style_columns,linewidth= 5)

plot(RSI_hist, title="RSI_Histogram", style=plot.style_columns, color=(RSI_hist>=0 ? (RSI_hist[1] < RSI_hist ? col_grow_above : col_fall_above) : (RSI_hist[1] < RSI_hist ? col_grow_below : col_fall_below)))


/////// Moving Averages 20 50 EMA

fast_ma = input.int(20, minval=2, title="Fast_EMA")
slow_ma = input.int(50, minval=2, title="Slow_EMA")

src = input.source(close, title="Source")

out = ta.ema(src, fast_ma)
out1 = ta.ema(src, slow_ma)

//plot(out, title="20 EMA", color=color.rgb(117, 71, 247), linewidth = 2)
//plot(out1, title="50 EMA", color=color.rgb(0, 0, 0), linewidth = 2)


longCondition = ((ta.crossover(modrsi, RSIAVG)) and (RSI_hist > 0))
if longCondition
    strategy.entry('B', strategy.long)

shortCondition = ((ta.crossunder(modrsi, RSIAVG)) and (RSI_hist < 0))
if shortCondition
    strategy.entry('S', strategy.short)