মোমেন্টাম ট্রেডিং ডাবল মুভিং এভারেজ ক্রসওভার কৌশল

ওভারভিউ
এই কৌশলটি 8 এবং 21 চক্রের সূচকীয় চলমান গড় (ইএমএ) ব্যবহার করে বাজারের প্রবণতার পরিবর্তনগুলি সনাক্ত করতে। যখন সংক্ষিপ্ত চক্রের ইএমএ নীচে থেকে দীর্ঘ চক্রের ইএমএ অতিক্রম করে, তখন এটি একটি কেনার সংকেত দেয়; বিপরীতভাবে, যখন সংক্ষিপ্ত চক্রের ইএমএ উপরে থেকে দীর্ঘ চক্রের ইএমএ অতিক্রম করে, তখন এটি একটি বিক্রয় সংকেত দেয়। এই কৌশলটি আরও তিনটি ধারাবাহিক উচ্চতর নিম্ন (এইচএলএল) এবং তিনটি ধারাবাহিক নিম্ন উচ্চতা (এলএলএইচ) সংযুক্ত করে যা প্রবণতা বিপরীত হওয়ার সংকেত হিসাবে আরও নিশ্চিত করে। এছাড়াও, কৌশলটি ঝুঁকি নিয়ন্ত্রণ এবং মুনাফা লক করার জন্য স্টপ লস এবং স্টপ লেভেল সেট করে।
কৌশল নীতি
- প্রধান প্রবণতা নির্দেশনা সনাক্ত করার জন্য 8 এবং 21 চক্রের EMA গণনা করা হয়।
- প্রবণতা বিপরীত হওয়ার প্রাথমিক সংকেত হিসেবে তিনটি পরপর উচ্চ নিম্ন নিম্ন নিম্ন নিম্ন নিম্ন নিম্ন নিম্ন নিম্ন নিম্ন নিম্ন নিম্ন নিম্ন নিম্ন নিম্ন নিম্ন নিম্ন নিম্ন নিম্ন নিম্ন নিম্ন নিম্ন নিম্ন নিম্ন নিম্ন নিম্ন নিম্ন নিম্ন নিম্ন নিম্ন নিম্ন নিম্ন নিম্ন নিম্ন নিম্ন নিম্ন নিম্ন নিম্ন নিম্ন নিম্ন নিম্ন নিম্ন নিম্ন নিম্ন নিম্ন নিম্ন নিম্ন নিম্ন নিম্ন নিম্ন নিম্ন নিম্ন নিম্ন নিম্ন নিম্ন নিম্ন নিম্ন নিম্ন নিম্ন নিম্ন নিম্ন নিম্ন নিম্ন নিম্ন নিম্ন নিম্ন নিম্ন নিম্ন নিম্ন নিম্ন নিম্ন নিম্ন নিম্ন নিম্ন নিম্ন নিম্ন নিম্ন নিম্ন নিম্ন নিম্ন নিম্ন নিম্ন নিম্ন নিম্ন নিম্ন নিম্ন নিম্ন নিম্ন নিম্ন নিম্ন নিম্ন নিম্ন নিম্ন নিম্ন নিম্ন নিম্ন নিম্ন নিম্ন নিম্ন নিম্ন নিম্ন নিম্ন নিম্ন নিম্ন নিম্ন নিম্ন নিম্ন নিম্ন নিম্ন নিম্ন নিম্ন নিম্ন নিম্ন নিম্ন নিম্ন নিম্ন নিম্ন নিম্ন নিম্ন নিম্ন নিম্ন নিম্ন নিম্ন নিম্ন নিম্ন নিম্ন নিম্ন নিম্ন নিম্ন নিম্ন নিম্ন নিম্ন নিম্ন নিম্ন নিম্ন নিম্ন নিম্ন নিম্ন নিম্ন নিম্ন নিম্ন নিম্ন নিম্ন নিম্ন নিম্ন নিম্ন নিম্ন নিম্ন নিম্ন নিম্ন নিম্ন নিম্ন নিম্ন নিম্ন নিম্ন নিম্ন নিম্ন নিম্ন নিম্ন নিম্ন নিম্ন নিম্ন নিম্ন
- যখন 8 চক্রের ইএমএ নীচে থেকে 21 চক্রের ইএমএ অতিক্রম করে এবং এইচএলএল ব্রেকআউট হয়, তখন একটি কেনার সংকেত উত্পন্ন হয়; যখন 8 চক্রের ইএমএ উপরে থেকে 21 চক্রের ইএমএ অতিক্রম করে এবং এলএলএইচ ব্রেকআউট হয়, তখন একটি বিক্রয় সংকেত উত্পন্ন হয়।
- ঝুঁকি নিয়ন্ত্রণ এবং মুনাফা লক করার জন্য স্টপ লস লেভেলটি প্রবেশ মূল্যের ৫% এবং স্টপ বক্স লেভেলটি প্রবেশ মূল্যের ১৬% সেট করুন।
- যখন বিপরীত সিগন্যাল আসে, তখন পজিশন বন্ধ করে বিপরীতভাবে খুলতে হবে।
কৌশলগত সুবিধা
- ইএমএ এবং মূল্য আচরণ প্যাটার্ন ((এইচএলএল এবং এলএলএইচ) এর সাথে মিলিত হয়ে প্রবণতা নিশ্চিত করতে, সংকেতের নির্ভরযোগ্যতা বাড়ায়।
- একটি স্পষ্ট স্টপ লস এবং স্টপ স্টপ লেভেল সেট করুন যা ঝুঁকি নিয়ন্ত্রণ এবং মুনাফা লক করতে সহায়তা করে।
- বিভিন্ন সময়সীমার জন্য এবং বিভিন্ন বাজারের জন্য প্রযোজ্য, যার কিছু সর্বজনীনতা রয়েছে।
- এটা খুবই সহজ, সহজে বোঝা যায় এবং বাস্তবায়ন করা যায়।
কৌশলগত ঝুঁকি
- বাজারে ঘন ঘন ক্রসিংয়ের ফলে একাধিক মিথ্যা সংকেত পাওয়া যায়, যার ফলে ক্ষতি হয়।
- স্থির স্টপ লস এবং স্টপস্টপ লেভেলগুলি বিভিন্ন বাজার পরিস্থিতির সাথে খাপ খাইয়ে নিতে পারে না, যার ফলে সম্ভাব্য সুযোগের খরচ বা আরও বড় ক্ষতি হতে পারে।
- কৌশলগুলি ঐতিহাসিক তথ্যের উপর নির্ভরশীল, এবং হঠাৎ ঘটনা বা মৌলিক পরিবর্তনের জন্য অনুকূল হতে পারে।
কৌশল অপ্টিমাইজেশনের দিকনির্দেশনা
- স্বনির্ধারিত স্টপ ও স্টপ ব্যবস্থা চালু করা, যেমন ওঠানামা-ভিত্তিক (যেমন ATR) স্টপ ও স্টপ স্তরগুলিকে সমন্বয় করা যাতে বিভিন্ন বাজারের অবস্থার সাথে আরও ভালভাবে মানিয়ে নেওয়া যায়।
- অন্যান্য সূচক বা ফ্যাক্টর যেমন লেনদেনের পরিমাণ, তুলনামূলকভাবে দুর্বল সূচক (আরএসআই) ইত্যাদির সাথে সংযুক্ত করে সংকেতগুলি আরও ফিল্টার করতে এবং নির্ভরযোগ্যতা বাড়াতে।
- প্যারামিটার (যেমন ইএমএ চক্র, স্টপ স্টপ অনুপাত ইত্যাদি) অপ্টিমাইজ করা হয় এবং একটি নির্দিষ্ট বাজার বা মানদণ্ডে সর্বোত্তম পারফরম্যান্সের প্যারামিটার সমন্বয় খুঁজে পাওয়া যায়।
- একক লেনদেনের ঝুঁকি কমানোর জন্য পজিশন সাইজিংয়ের মতো ঝুঁকি ব্যবস্থা গ্রহণের বিষয়টি বিবেচনা করুন।
সারসংক্ষেপ
এই কৌশলটি 8 চক্র এবং 21 চক্রের ইএমএর ক্রস ব্যবহার করে, এইচএলএল এবং এলএলএইচ মূল্যের মডেলের সাথে মিলিত হয়ে ট্রেন্ডের বিপরীত চিহ্নিত করে এবং ট্রেডিং সংকেত উত্পন্ন করে। সুস্পষ্ট স্টপ লস রুলস ঝুঁকি নিয়ন্ত্রণে এবং মুনাফা লক করতে সহায়তা করে। যাইহোক, এই কৌশলটি অস্থির বাজারে ভুয়া সংকেত তৈরি করতে পারে এবং নির্দিষ্ট স্টপ লস স্তরগুলি বিভিন্ন বাজার পরিবেশের সাথে খাপ খাইয়ে নিতে পারে না। আরও উন্নতির জন্য, স্ব-অনুকূলিত স্টপ লস, অন্যান্য সূচক, অপ্টিমাইজেশন প্যারামিটার এবং ঝুঁকি পরিচালনার ব্যবস্থা গ্রহণের জন্য বিবেচনা করা যেতে পারে। সামগ্রিকভাবে, এই কৌশলটি গতিশীলতা এবং প্রবণতা ট্র্যাকিংয়ের উপর ভিত্তি করে একটি ট্রেডিং কাঠামো সরবরাহ করে, তবে এখনও নির্দিষ্ট বাজার এবং ব্যক্তিগত পছন্দ অনুসারে সামঞ্জস্য এবং অপ্টিমাইজ করার প্রয়োজন।
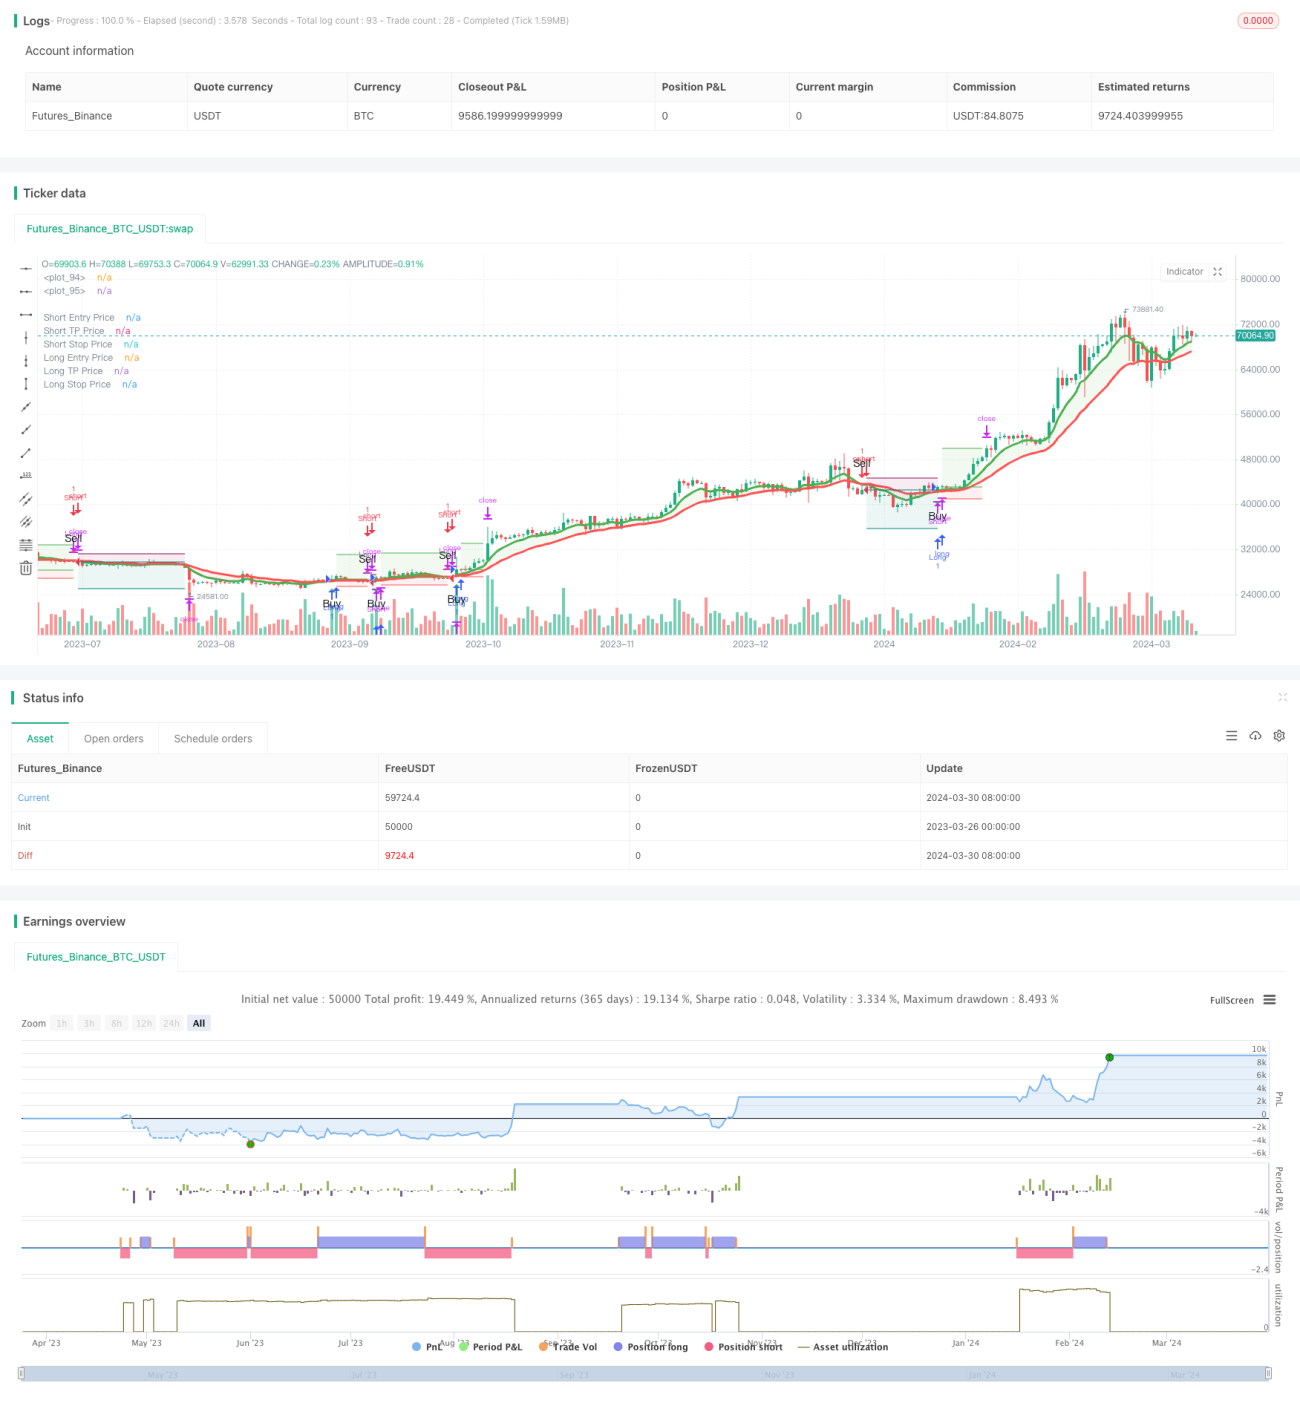
/*backtest
start: 2023-03-26 00:00:00
end: 2024-03-31 00:00:00
period: 1d
basePeriod: 1h
exchanges: [{"eid":"Futures_Binance","currency":"BTC_USDT"}]
*/

//@version=5
strategy('Trend Following 8&21EMA with strategy tester [ukiuro7]', overlay=true, process_orders_on_close=true, calc_on_every_tick=true, initial_capital = 10000)

//INPUTS- 1