প্রবণতা ধরার কৌশল

ওভারভিউ
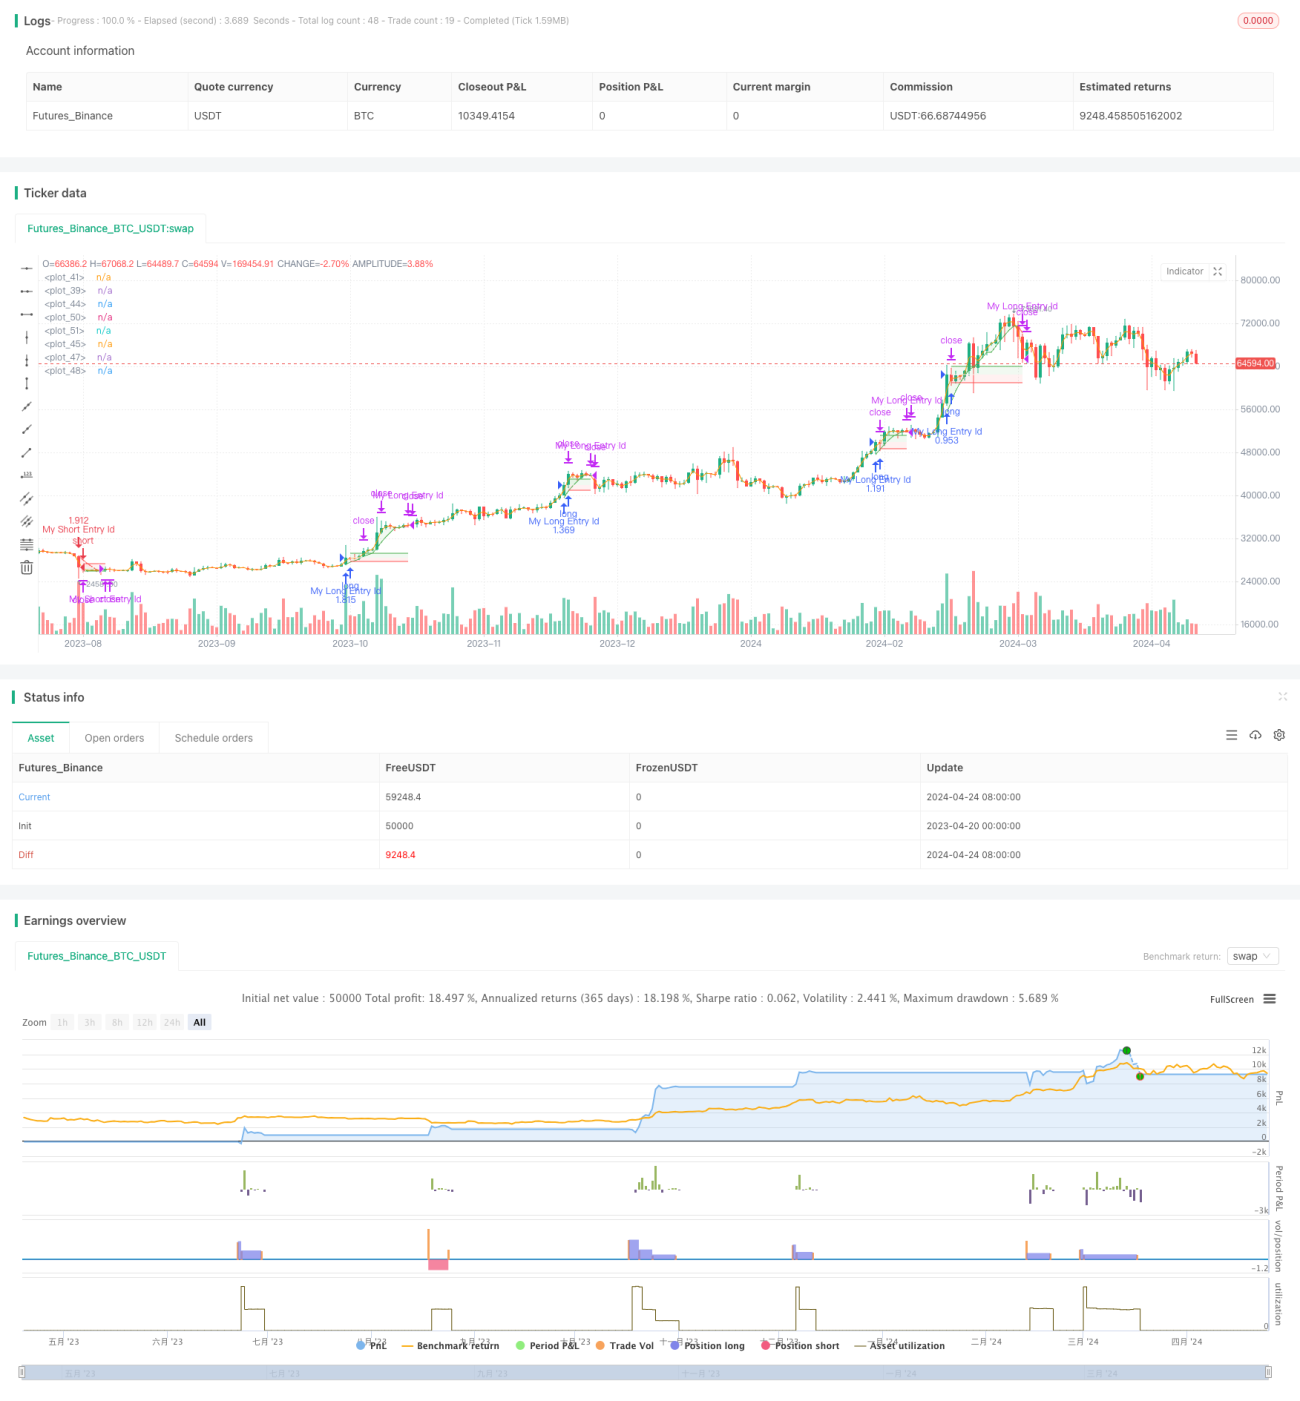
প্রবণতা ক্যাপচার কৌশল একটি কৌশল যা একটি প্রবণতা সনাক্ত করার জন্য একটি অনন্য পদ্ধতি ব্যবহার করে এবং প্রবণতার দিকে অবস্থান স্থাপন করে। এটি একটি নির্দিষ্ট পরিসরের মধ্যে সর্বোচ্চ এবং সর্বনিম্ন মূল্যের পার্থক্য এবং সেই পরিসরের মধ্যে সমস্ত কে লাইনের দৈর্ঘ্যের সমষ্টির সাথে একটি শতাংশের মানকে "সীমা" হিসাবে গণনা করে। এই মানটি 100 এর কাছাকাছি, প্রবণতাটি আরও শক্তিশালী। যখন এই মানটি সেট করা সীমাবদ্ধতা অতিক্রম করে এবং চলমান গড়ের উপরে চলে যায়, তখন কৌশলটি একটি মাল্টিপ্লট খোলে; যখন এটি সেট করা সীমাবদ্ধতা অতিক্রম করে এবং চলমান গড়টি নীচে চলে যায়, তখন কৌশলটি খালি পলিসি খোলে। পজিশন খোলার পরে, কৌশলটি নির্দিষ্ট স্তরের দাম পৌঁছে গেলে পজিশনের অংশটি সমতল করে এবং অবশিষ্ট অবস্থানটি প্রবণতা হিসাবে বিবেচিত শেষ পয়েন্টে স্থানান্তরিত করে।
কৌশল নীতি
- একটি নির্দিষ্ট পরিসরে সর্বোচ্চ এবং সর্বনিম্ন মূল্যের পার্থক্য এবং সেই পরিসরে সমস্ত K-লাইন দৈর্ঘ্যের সমষ্টি গণনা করুন।
- পার্থক্যের মানকে কে লাইনের দৈর্ঘ্যের সমষ্টি দ্বারা ভাগ করে ১০০ দ্বারা গুণ করলে একটি শতাংশের মান পাওয়া যায়, যাকে "সীমা" বলা হয়।
- যখন সীমাবদ্ধতা সেট মান অতিক্রম করে এবং চলমান গড় উপরে চলে যায়, তখন একাধিক কার্ড খুলুন; যখন সীমাবদ্ধতা সেট মান অতিক্রম করে এবং চলমান গড় নীচে চলে যায়, তখন খালি কার্ড খুলুন।
- পজিশন খোলার পর, যখন দাম স্টপ পজিশনে পৌঁছায় তখন পজিশনের কিছু অংশ মুছে ফেলা হয় এবং অবশিষ্ট পজিশন স্টপ লস পজিশনে চলে যায়।
- যখন চলমান গড় নীচে অতিক্রম করে, তখন একাধিক টিকিটকে সমতল করে; যখন চলমান গড় উপরে অতিক্রম করে, তখন খালি টিকিটকে সমতল করে।
কৌশলগত সুবিধা
- কৌশলটি প্রবণতা সনাক্তকরণের একটি অনন্য পদ্ধতি ব্যবহার করে, প্রবণতার শক্তি নির্ধারণের জন্য সীমাবদ্ধতার মান গণনা করে, যা প্রবণতার শুরুতে পজিশন খোলার ক্ষেত্রে সহায়তা করে।
- পজিশন খোলার পর, পজিশনের কিছু অংশ মুছে ফেলার এবং অবশিষ্ট পজিশনের স্টপ লস স্থানান্তরিত করে ঝুঁকি নিয়ন্ত্রণের কৌশল।
- কৌশলটি ট্রেন্ডের সমাপ্তি নির্ধারণের জন্য চলমান গড়ের উপরে ও নিচে চলাচলের ব্যবহার করে, যা সময়মত পজিশনের অবসান ঘটাতে সহায়তা করে।
কৌশলগত ঝুঁকি
- ট্রেন্ডের শুরুতে পজিশন খোলার কৌশল, যদি ট্রেন্ড চলতে না পারে তবে ক্ষতি হতে পারে।
- কৌশলটি নির্দিষ্ট স্টপ এবং স্টপ লস ব্যবহার করে, যা কিছু ক্ষেত্রে অপর্যাপ্ত হতে পারে।
- ট্রেন্ডিং এর ক্ষেত্রে, ট্রেন্ডিং এর সুযোগগুলি মিস করা যেতে পারে, যেহেতু কৌশলটি কেবলমাত্র প্রবণতা নির্ধারণের জন্য চলন্ত গড় ব্যবহার করে।
কৌশল অপ্টিমাইজেশনের দিকনির্দেশনা
- অন্যান্য সূচক যেমন MACD, RSI ইত্যাদির ব্যবহার বিবেচনা করা যেতে পারে যাতে পজিশন খোলার সঠিকতা বাড়তে পারে।
- বাজারের অস্থিরতার উপর ভিত্তি করে স্টপ ও লস পয়েন্টগুলিকে গতিশীলভাবে সামঞ্জস্য করা যেতে পারে, যাতে ঝুঁকিগুলি আরও ভালভাবে নিয়ন্ত্রণ করা যায়।
- ট্রেন্ডের শুরুতে ঝুঁকি কমানোর জন্য ট্রেন্ড নিশ্চিত হওয়ার পরে পজিশন খোলার বিষয়টি বিবেচনা করা যেতে পারে।
সারসংক্ষেপ
ট্রেন্ড ক্যাপচার কৌশলটি ট্রেন্ড গঠনের জন্য একটি অনন্য পদ্ধতি ব্যবহার করে এবং ট্রেন্ডের দিকনির্দেশে পজিশন খোলে। এটি প্রবণতার শক্তি নির্ধারণের জন্য সীমাবদ্ধতার মান গণনা করে এবং চলমান গড়কে অতিক্রম করে ট্রেন্ডের সমাপ্তি নির্ধারণ করে। পজিশন খোলার পরে কৌশলটি কিছু পজিশন এবং চলমান স্টপ লস পজিশনকে সমতল করে ঝুঁকি নিয়ন্ত্রণ করে। তবে, কৌশলটি প্রবণতার শুরুতে পজিশন খোলার ক্ষেত্রে কিছু ঝুঁকি থাকতে পারে, নির্দিষ্ট স্টপ লস ব্যবহার করে স্থির স্টপ লস যথেষ্ট নমনীয় নাও হতে পারে, কেবল চলমান গড় লাইন ব্যবহার করে ট্রেন্ডের বিচার করার জন্য কিছু সুযোগ মিস হতে পারে। ভবিষ্যতে অন্যান্য সূচকগুলি, গতিশীল স্টপ লস সামঞ্জস্য এবং ট্রেন্ড নিশ্চিত হওয়ার পরে পজিশন খোলার মতো কৌশলগুলিকে অনুকূলিত করার জন্য বিবেচনা করা যেতে পারে।
- 1