RSI প্রবণতা কৌশল

1
Follow
1780
Followers
ওভারভিউ
এই কৌশলটি তুলনামূলকভাবে দুর্বল সূচক (আরএসআই) এর উপর ভিত্তি করে, আরএসআই সূচকের মানটি পূর্ব নির্ধারিত উত্থান-পতনের চেয়ে বেশি কিনা তা বিচার করে ক্রয়-বিক্রয় সংকেত নির্ধারণ করে। একই সাথে, এই কৌশলটি ঝুঁকি নিয়ন্ত্রণের জন্য স্টপ লস এবং পজিশনের সময়সীমা সেট করে।
কৌশল নীতি
- আরএসআই এর মান গণনা করুন।
- যখন RSI মানটি ডিফল্ট ক্রয় থ্রেশহোল্ডের নীচে থাকে তখন একটি ক্রয় সংকেত উত্পন্ন হয়; যখন RSI মানটি ডিফল্ট বিক্রয় থ্রেশহোল্ডের উপরে থাকে তখন একটি বিক্রয় সংকেত উত্পন্ন হয়।
- ক্রয় সংকেত অনুসারে, বর্তমান ক্লোজ-আপ মূল্যের উপর ভিত্তি করে ক্রয়ের পরিমাণ গণনা করুন এবং অর্ডার করুন।
- যদি স্টপ লস অনুপাত সেট করা থাকে, তাহলে স্টপ লস মূল্য গণনা করা হবে এবং স্টপ লস অর্ডার দেওয়া হবে।
- বিক্রয় সংকেত বা স্টপ লস শর্তের উপর ভিত্তি করে, সমস্ত পজিশন প্লেইন করুন।
- যদি সর্বোচ্চ পজিশনের সময় নির্ধারণ করা হয়, তাহলে পজিশনের সময় সর্বোচ্চ পজিশনের সময় অতিক্রম করার পর, লাভ-ক্ষতি যাই হোক না কেন, সমস্ত পজিশনের পজিশনের সমতুল্য করা হবে।
কৌশলগত সুবিধা
- আরএসআই একটি বহুল ব্যবহৃত প্রযুক্তিগত বিশ্লেষণ সূচক যা কার্যকরভাবে বাজারের ওভার-বই এবং ওভার-সেল সংকেত ক্যাপচার করে।
- এই কৌশলটি ঝুঁকি নিয়ন্ত্রণে সহায়তা করার জন্য স্টপ লস এবং হোল্ডিং টাইম সীমাবদ্ধতা প্রবর্তন করে।
- এই নীতির যৌক্তিকতা স্পষ্ট, সহজে বোঝা যায় এবং বাস্তবায়িত হয়।
- আরএসআই এর প্যারামিটার এবং থ্রেশহোল্ডের সমন্বয় করে, এটি বিভিন্ন বাজারের অবস্থার সাথে মানিয়ে নিতে পারে।
কৌশলগত ঝুঁকি
- RSI সূচকটি কিছু ক্ষেত্রে ভুল সংকেত দিতে পারে, যার ফলে কৌশলটি ক্ষতিগ্রস্ত হতে পারে।
- এই কৌশলটি ট্রেডিং জাতের মৌলিক বিষয়গুলিকে বিবেচনা করে না, কেবলমাত্র প্রযুক্তিগত সূচকগুলির উপর নির্ভর করে, যা বাজারের অপ্রত্যাশিত ঘটনার ঝুঁকির মুখোমুখি হতে পারে।
- স্থির ক্ষতির অনুপাত বাজারের অস্থিরতার সাথে মানিয়ে নিতে পারে না।
- প্যারামিটার সেটিং দ্বারা কৌশলটির কার্যকারিতা প্রভাবিত হতে পারে, এবং ভুল প্যারামিটারগুলি কৌশলটির দুর্বল কার্যকারিতার কারণ হতে পারে।
কৌশল অপ্টিমাইজেশনের দিকনির্দেশনা
- কৌশলটির নির্ভরযোগ্যতা বাড়াতে অন্যান্য প্রযুক্তিগত সূচক যেমন চলমান গড় প্রবর্তন করা।
- অপ্টিমাইজড স্টপ-অফ-লস কৌশল, যেমন চলমান স্টপ বা অস্থিরতা-ভিত্তিক গতিশীল স্টপ।
- RSI এর প্যারামিটার এবং থ্রেশহোল্ডগুলি বাজারের অবস্থার সাথে সামঞ্জস্যপূর্ণ।
- কৌশলগত ঝুঁকি নিয়ন্ত্রণের ক্ষমতা উন্নত করার জন্য ট্রেডিং প্রজাতির মৌলিক বিষয়গুলির বিশ্লেষণের সাথে মিলিত।
- কৌশলগুলি পুনরায় পরীক্ষা করা হয় এবং সর্বোত্তম প্যারামিটার সমন্বয় খুঁজে পেতে প্যারামিটার অপ্টিমাইজ করা হয়।
সারসংক্ষেপ
এই কৌশলটি RSI সূচক ব্যবহার করে বাজারের ওভার-বই এবং ওভার-সেল সংকেতগুলি ক্যাপচার করে এবং ঝুঁকি নিয়ন্ত্রণের জন্য স্টপ লস এবং হোল্ডিং টাইম সীমাবদ্ধতা প্রবর্তন করে। কৌশলটির যুক্তিটি সহজ, সহজেই বাস্তবায়ন এবং অপ্টিমাইজ করা যায়। যাইহোক, কৌশলটির কার্যকারিতা বাজার ওঠানামা এবং প্যারামিটার সেটিংয়ের দ্বারা প্রভাবিত হতে পারে, তাই কৌশলটির স্থিতিশীলতা এবং লাভজনকতা বাড়ানোর জন্য অন্যান্য বিশ্লেষণ পদ্ধতি এবং ঝুঁকি পরিচালনার সরঞ্জামগুলির সাথে মিলিত হওয়া প্রয়োজন।
Source
Pine
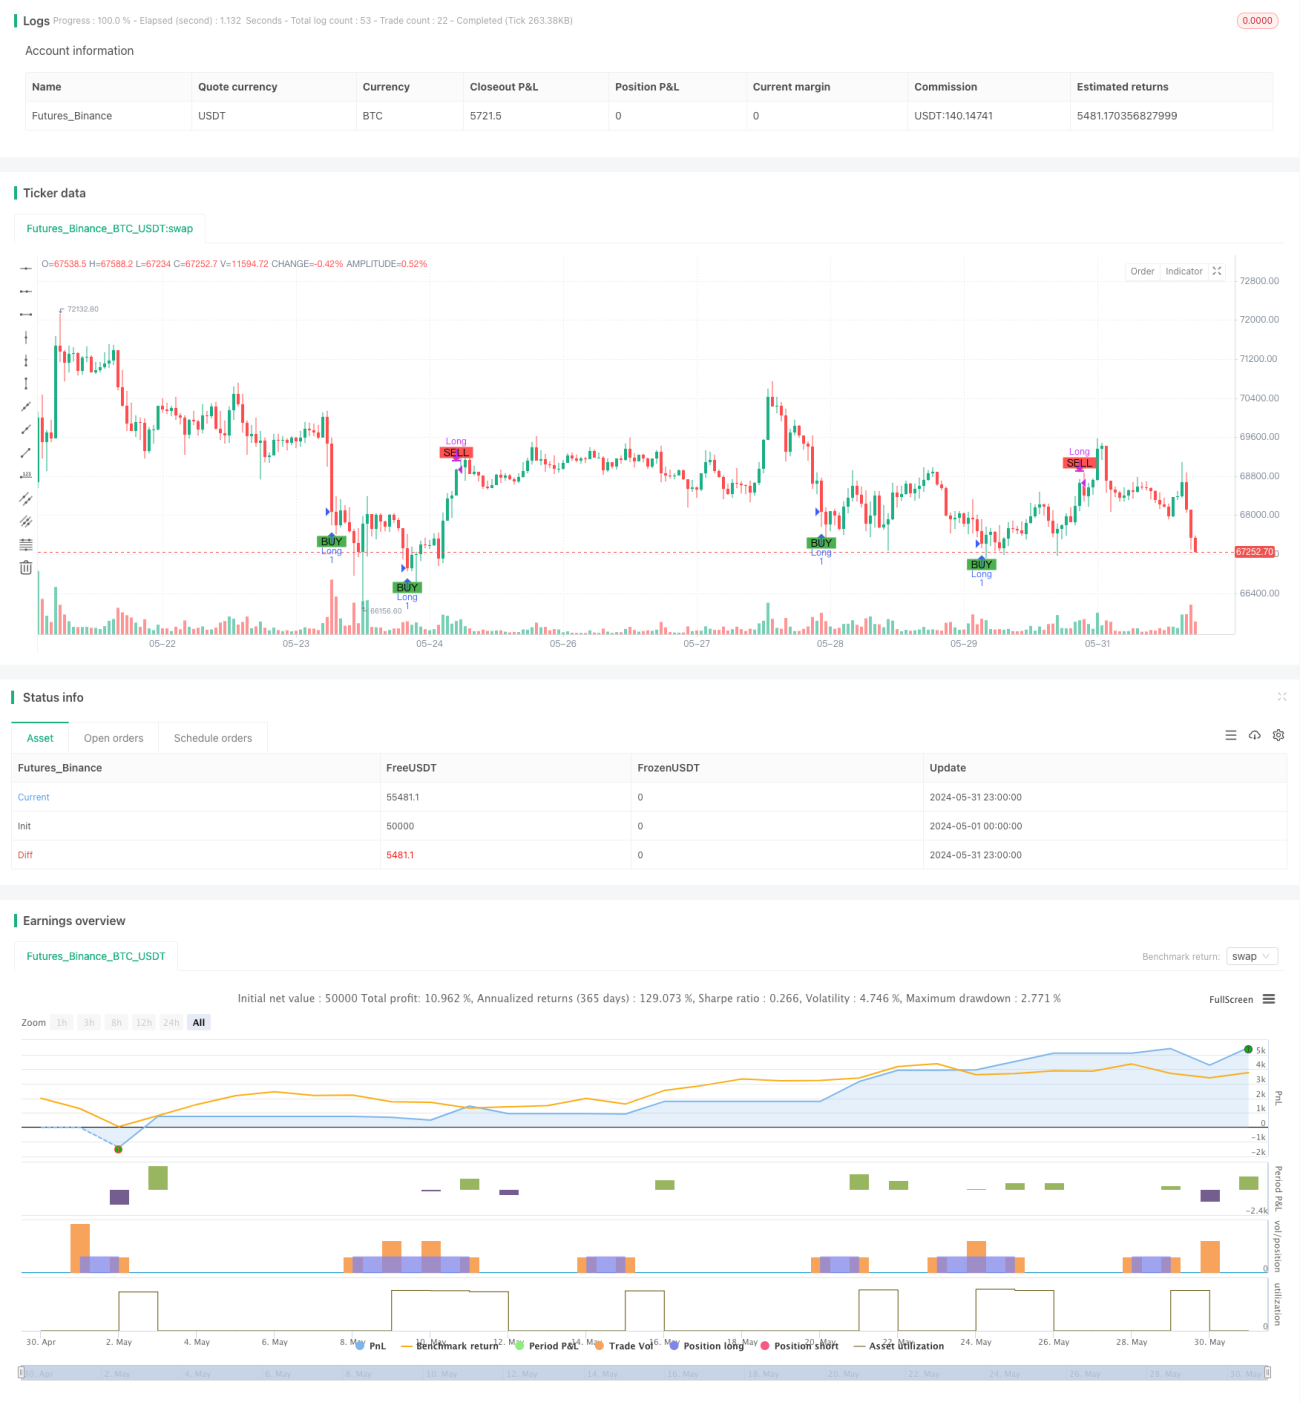
/*backtest
start: 2024-05-01 00:00:00
end: 2024-05-31 23:59:59
period: 1h
basePeriod: 15m
exchanges: [{"eid":"Futures_Binance","currency":"BTC_USDT"}]
*/

//@version=5
strategy("Simple RSI Strategy", overlay=true,  initial_capital=20, commission_value=0.1, commission_type=strategy.commission.percent)

// Define the hardcoded date (Year, Month, Day, Hour, Minute)Strategy parameters
Related strategies
Comment
All comments (0)
No data
- 1