গতিশীল ডনচিয়ান চ্যানেল এবং সরল চলমান গড় সমন্বয় করে পরিমাণগত কৌশল
SMA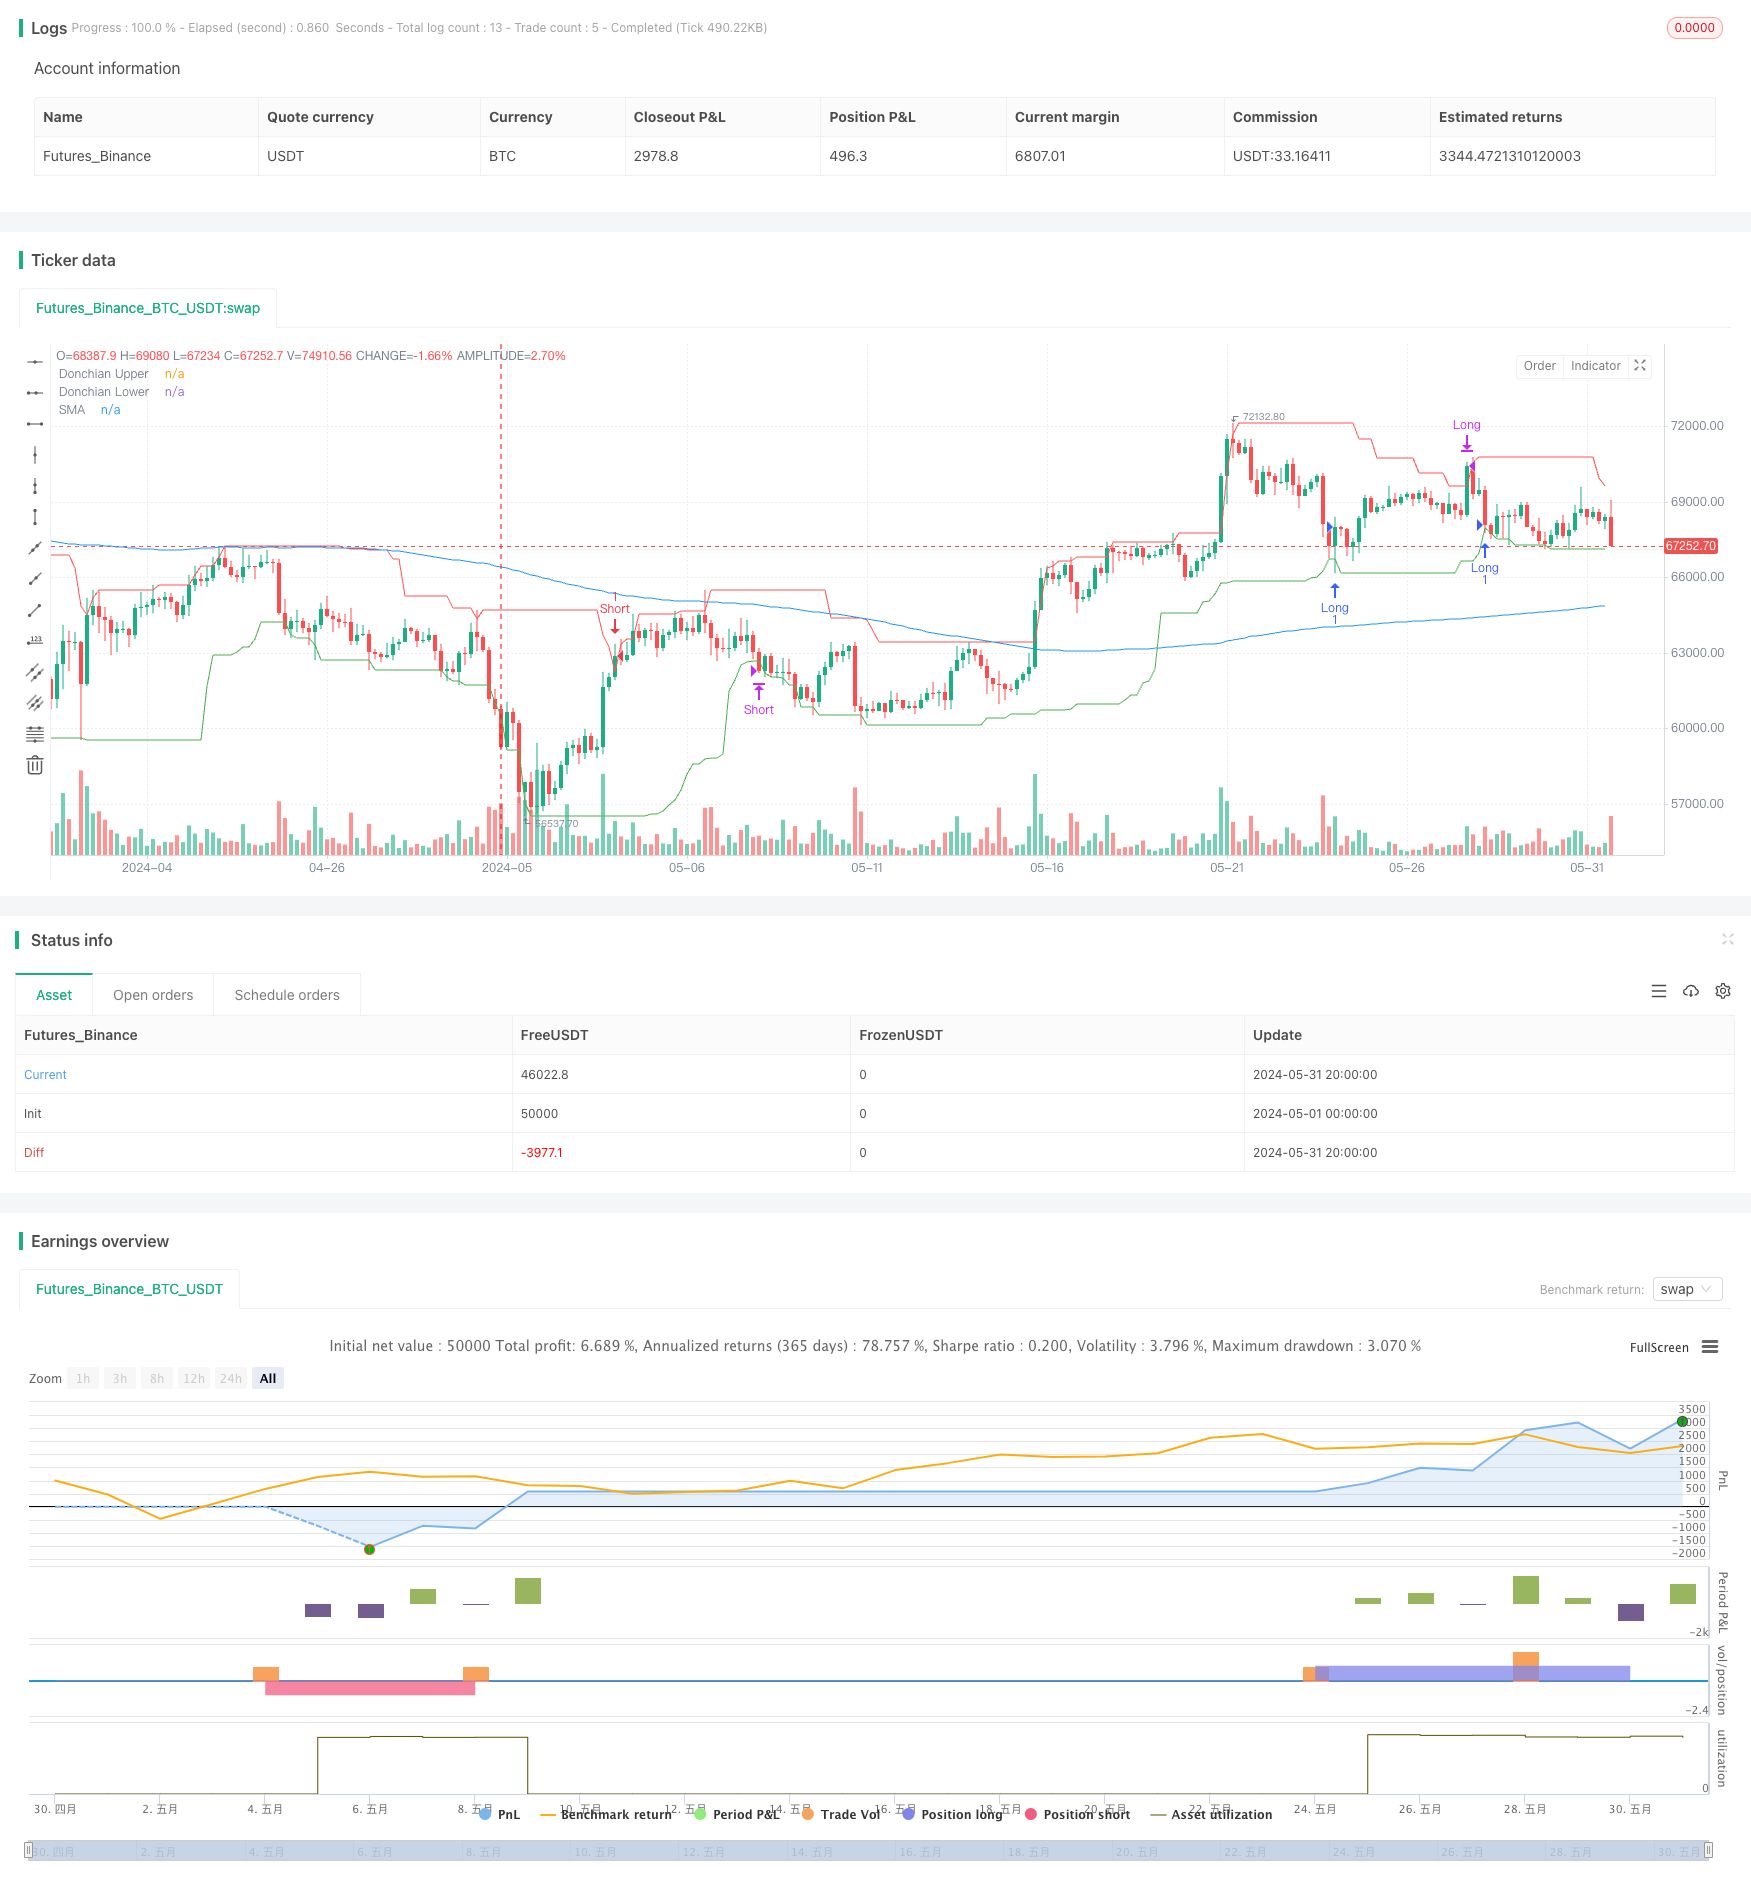
ওভারভিউ
এই কৌশলটি ডং চি চ্যানেল এবং সরল চলমান গড়ের দুটি প্রযুক্তিগত সূচককে একত্রিত করে। যখন দাম ডং চি চ্যানেলের নিচের ট্র্যাকটি অতিক্রম করে এবং সরল চলমান গড়ের উপরে থাকে তখন অতিরিক্ত পজিশন খুলুন এবং যখন দাম ডং চি চ্যানেলের উপরে এবং সরল চলমান গড়ের নীচে থাকে তখন শূন্য পজিশন খুলুন। মাল্টি-হেড পজিশনটি যখন দাম ডং চি চ্যানেলের উপরের ট্র্যাকটিকে স্পর্শ করে তখন শূন্য পজিশনটি যখন দাম ডং চি চ্যানেলের নিচের ট্র্যাকটিকে স্পর্শ করে তখন শূন্য পজিশন। এই কৌশলটি প্রবণতাযুক্ত বাজারের জন্য উপযুক্ত।
কৌশল নীতি
- টং চ্যান চ্যানেলের উপর ও নিচের ট্র্যাক গণনা করুন। টং চ্যান চ্যানেলের উপরের ট্র্যাকটি গত n টি চক্রের সর্বোচ্চ মূল্য এবং নীচের ট্র্যাকটি গত n টি চক্রের সর্বনিম্ন মূল্য।
- সরল চলমান গড় গণনা করুন। সরল চলমান গড় হল গত m টি চক্রের ক্লোজিং দামের গড় গড়।
- মাল্টি-হেড পজিশন খোলারঃ যখন দাম দং চিয়ান চ্যানেলের নিচের রেলের চেয়ে কম হয় এবং ক্লোজিং মূল্য সরল চলমান গড়ের চেয়ে বেশি হয় তখন পজিশন খোলার।
- খালি পজিশনঃ যখন দাম দং চিয়ান চ্যানেলের উপরে থাকে এবং ক্লোজিং মূল্য সরল চলমান গড়ের নীচে থাকে তখন খালি পজিশন।
- মাল্টি-টার্ম পজিশনঃ যখন দাম ডং চিয়াং চ্যানেলের উপরে পৌঁছায় তখন মাল্টি-টার্ম পজিশন।
- খালি পজিশনঃ যখন দাম ডং চিয়াং চ্যানেলের নীচের ট্র্যাকের সাথে যোগাযোগ করে তখন খালি পজিশন।
কৌশলগত সুবিধা
- ট্রেন্ডিং এবং ওঠানামা দুটি বাজার উপাদান একত্রিত করুন। সরল চলমান গড় ট্রেন্ডিং ক্যাপচার করে, ডং চিয়ান চ্যানেল ওঠানামা ক্যাপচার করে, ট্রেন্ডিং পরিস্থিতিতে প্রত্যাহারের সুযোগগুলি আরও ভালভাবে ধরে রাখে।
- স্টপ শর্তগুলি সুস্পষ্ট, সময়মতো মুনাফা লক করতে সহায়তা করে। মাল্টি হেড এবং খালি হেড যথাক্রমে যখন দাম ডং চিয়ান খালের উপরের এবং নীচের ট্র্যাকে স্পর্শ করে তখন সমতল হয়, প্রবণতা বিপরীত হওয়ার আগে সময়মতো মুনাফা অর্জন করা যায়।
- প্যারামিটার কম, অপ্টিমাইজেশন কম কঠিন। এই কৌশলটি কেবলমাত্র তিনটি প্যারামিটার রয়েছেঃ দংচি চ্যানেলের সময়কাল, বিচ্যুতি এবং সরল চলমান গড়ের সময়কাল, যা অপ্টিমাইজেশনের জন্য সহজ।
কৌশলগত ঝুঁকি
- ঘন ঘন লেনদেনঃ এই কৌশলটি উচ্চ ঘন ঘন পজিশন খোলার জন্য ব্যবহৃত হয়, যা উচ্চ লেনদেনের ব্যয়বহুল বাজারে উপার্জনকে হ্রাস করে। লেনদেনের সংখ্যা হ্রাস করার জন্য পজিশন খোলার শর্তগুলিকে মাঝারিভাবে শিথিল করা বা সময়সীমা বাড়ানো যেতে পারে।
- অস্থির বাজারগুলি ভাল পারফরম্যান্স করে না। যখন প্রবণতা অস্পষ্ট হয়, তখন কৌশলটি আরও বেশি ক্ষতির সম্মুখীন হতে পারে। স্ট্যাটিস্টিকাল ওঠানামা সূচকগুলি দ্বারা অস্থির বাজারগুলি সনাক্ত করা এবং কৌশলটি স্থগিত করা যেতে পারে।
- প্যারামিটার স্থায়িত্বের অভাব রয়েছে। বিভিন্ন মান এবং সময়কালের মধ্যে, সর্বোত্তম প্যারামিটারগুলির মধ্যে বড় পার্থক্য থাকতে পারে, প্যারামিটার স্থায়িত্ব দুর্বল, রিয়েল-ডিস্কের পারফরম্যান্সটি পুনরাবৃত্তির জন্য যথেষ্ট নাও হতে পারে। প্যারামিটারগুলি স্থিতিশীল কিনা তা নিশ্চিত করার জন্য পর্যাপ্ত নমুনা পরীক্ষা এবং সংবেদনশীলতা বিশ্লেষণের প্রয়োজন।
কৌশল অপ্টিমাইজেশনের দিকনির্দেশনা
- অন্যান্য সূচকগুলির সাথে সংযুক্ত বিকল্প পজিশন শর্তগুলি যুক্ত করুন, যেমন ডিএমআই-তে এডিএক্স-এর একটি নির্দিষ্ট থ্রেশহোল্ডের চেয়ে বেশি পজিশন খোলার অনুমতি দেওয়া বা আরএসআই যখন ওভারসোল্ড অঞ্চল থেকে বেরিয়ে আসে তখন অতিরিক্ত পজিশন খোলার অনুমতি দেওয়া, পজিশন খোলার হার বাড়িয়ে তোলে।
- ডায়নামিক স্টপ লাইন ব্যবহার করে স্থির দংচিয়ান চ্যানেল লাইন স্টপিংয়ের পরিবর্তে মুনাফা ট্র্যাকিংয়ের কার্যকারিতা উপলব্ধ করা যায়। উদাহরণস্বরূপ, দাম দংচিয়ান চ্যানেলের ট্র্যাকিংয়ের পরে, এটিআর স্টপ লাইন বা এসএআর স্টপ লাইনে প্লেইন করার পরিবর্তে মাল্টি-হেড ব্যবহার করা যেতে পারে।
- দোলন স্তরের গতিশীলতা অনুসারে দোলন চ্যানেলের চক্রটি সামঞ্জস্য করুন, উচ্চ দোলন বাজারের অবস্থার সময় দোলন চ্যানেলের চক্রটি সংক্ষিপ্ত করুন, নিম্ন দোলন বাজারের অবস্থার সময় দোলন চক্রটি প্রসারিত করুন। এটি বিভিন্ন বাজারের সাথে মানিয়ে নিতে সহায়তা করে।
সারসংক্ষেপ
ডায়নামিক টানচিয়ান চ্যানেল এবং সরল চলমান গড়ের সাথে সংযুক্ত কৌশলটি একটি সহজ এবং সহজেই ব্যবহারযোগ্য পরিমাণগত ট্রেডিং কৌশল ফ্রেমওয়ার্ক। এটি প্রবণতা অনুসরণ এবং অস্থিরতা বিরতি থেকে দুটি দৃষ্টিকোণ থেকে পজিশন খোলার লজিক তৈরি করে, যা প্রবণতাযুক্ত জাতের জন্য উপযুক্ত। তবে এই কৌশলটি ঘন ঘন অস্থির বাজারে দুর্বলভাবে কাজ করে এবং প্যারামিটারটি সাধারণত স্থিতিশীল থাকে। এই কৌশলটির অভিযোজনযোগ্যতা এবং রুক্ষতা বাড়ানোর জন্য সহায়ক পজিশন খোলার শর্ত, গতিশীল স্টপ এবং প্যারামিটার স্বয়ংক্রিয় অভিযোজন যন্ত্রের প্রবর্তন করা যেতে পারে। সামগ্রিকভাবে, এই কৌশলটি একটি মৌলিক কৌশল ফ্রেমওয়ার্ক হিসাবে কাজ করতে পারে, যার উপর ভিত্তি করে আরও উন্নত পরিমাণগত কৌশল তৈরি করতে আরও সংশোধন করা যেতে পারে।
/*backtest
start: 2024-05-01 00:00:00
end: 2024-05-31 23:59:59
period: 4h
basePeriod: 15m
exchanges: [{"eid":"Futures_Binance","currency":"BTC_USDT"}]
*/

//@version=5
strategy("FBK Donchian Channel Strategy", overlay=true)

// Inputs
donchian_period = input.int(20, title="Donchian Channel Period")
donchian_offset = input.int(1, title="Donchian Channel Offset")
sma_period = input.int(200, title="SMA Period")
start_date = input(timestamp("2023-01-01 00:00 +0000"), title="Start Date")
end_date = input(timestamp("2023-12-31 23:59 +0000"), title="End Date")
trade_type = input.string("Both", title="Trade Type", options=["Buy Only", "Sell Only", "Both"])

// Calculate indicators
donchian_upper = ta.highest(high, donchian_period)[donchian_offset]
donchian_lower = ta.lowest(low, donchian_period)[donchian_offset]
sma = ta.sma(close, sma_period)

// Plot indicators
plot(donchian_upper, color=color.red, title="Donchian Upper")
plot(donchian_lower, color=color.green, title="Donchian Lower")
plot(sma, color=color.blue, title="SMA")

// Helper function to check if within testing period
is_in_testing_period() => true

// Entry conditions
long_condition = low <= donchian_lower and close > sma
short_condition = high >= donchian_upper and close < sma

// Exit conditions
exit_long_condition = high >= donchian_upper
exit_short_condition = low <= donchian_lower

// Open long position
if (is_in_testing_period() and (trade_type == "Buy Only" or trade_type == "Both") and long_condition)
    strategy.entry("Long", strategy.long)

// Close long position
if (is_in_testing_period() and exit_long_condition)
    strategy.close("Long")

// Open short position
if (is_in_testing_period() and (trade_type == "Sell Only" or trade_type == "Both") and short_condition)
    strategy.entry("Short", strategy.short)

// Close short position
if (is_in_testing_period() and exit_short_condition)
    strategy.close("Short")

// Close all positions at the end of the testing period
if not is_in_testing_period()
    strategy.close_all()