থ্রি-পিরিয়ড হাই-লো মোমেন্টাম ট্রেডিং কৌশল

ওভারভিউ
এই কৌশলটি একটি গতিশীল ট্রেডিং কৌশল যা তিন চক্রের উচ্চ ও নিম্নের উপর ভিত্তি করে তৈরি করা হয়েছে। এটি সাম্প্রতিক তিন সপ্তাহের দামের তথ্য ব্যবহার করে সম্ভাব্য ক্রয় এবং বিক্রয় সুযোগগুলি সনাক্ত করতে। এই কৌশলটি মূলত সাম্প্রতিক উচ্চতা, সাম্প্রতিক সমাপ্তির দাম এবং তিন সপ্তাহ আগে সমাপ্তির দামের মধ্যে সম্পর্ককে কেন্দ্র করে, এই মূল্যের স্তরের তুলনা করে ট্রেডিং সিগন্যাল তৈরি করে। এই পদ্ধতিটি মধ্যমেয়াদী মূল্য প্রবণতা ক্যাপচার করার জন্য এবং স্বল্পমেয়াদী বাজারের গোলমালের প্রভাব এড়ানোর জন্য তৈরি করা হয়েছে।
কৌশল নীতি
এই কৌশলটির মূলনীতিতে নিম্নলিখিত মূল উপাদানগুলি অন্তর্ভুক্ত রয়েছেঃ
-
পরিমাপঃ
- সর্বশেষ সর্বোচ্চ: ta.highest () ফাংশন ব্যবহার করে সর্বশেষ ৩০ ট্রেডিং দিনের (প্রায় ৪ সপ্তাহ) সর্বোচ্চ মূল্য গণনা করা হয়েছে।
- সর্বশেষ মূল্যঃ close ব্যবহার করে[১] আগের দিনের শেষের মূল্যের তথ্য।
- তিন সপ্তাহ আগে বন্ধের দামঃ close ব্যবহার করে[[৩০] ৩০টি ট্রেডিং দিনের শেষের মূল্য দেখুন।
-
কেনার শর্ত:
- শর্ত ১ঃ সর্বশেষ সর্বোচ্চ মূল্য তিন সপ্তাহ আগের মূল্যের সমান বা তার চেয়ে বেশি।
- শর্ত ২ঃ সর্বশেষ বন্ধের মূল্য তিন সপ্তাহ আগের বন্ধের মূল্যের চেয়ে বেশি।
-
বিক্রয় শর্ত:
- বিক্রির সংকেত যখন সর্বশেষ বন্ধের দাম তিন সপ্তাহ আগের বন্ধের দামের চেয়ে বেশি হয় তখনই দেওয়া হয়।
-
লেনদেন সম্পাদনঃ
- সিগন্যাল ট্রিগার কেনার সময়, অতিরিক্ত প্রবেশ করুন।
- বিক্রয় সংকেত ট্রিগার করার সময়, প্লেইন পজিশনটি বর্তমান প্ল্যাটফর্ম পজিশনটি বন্ধ করে দেয়।
-
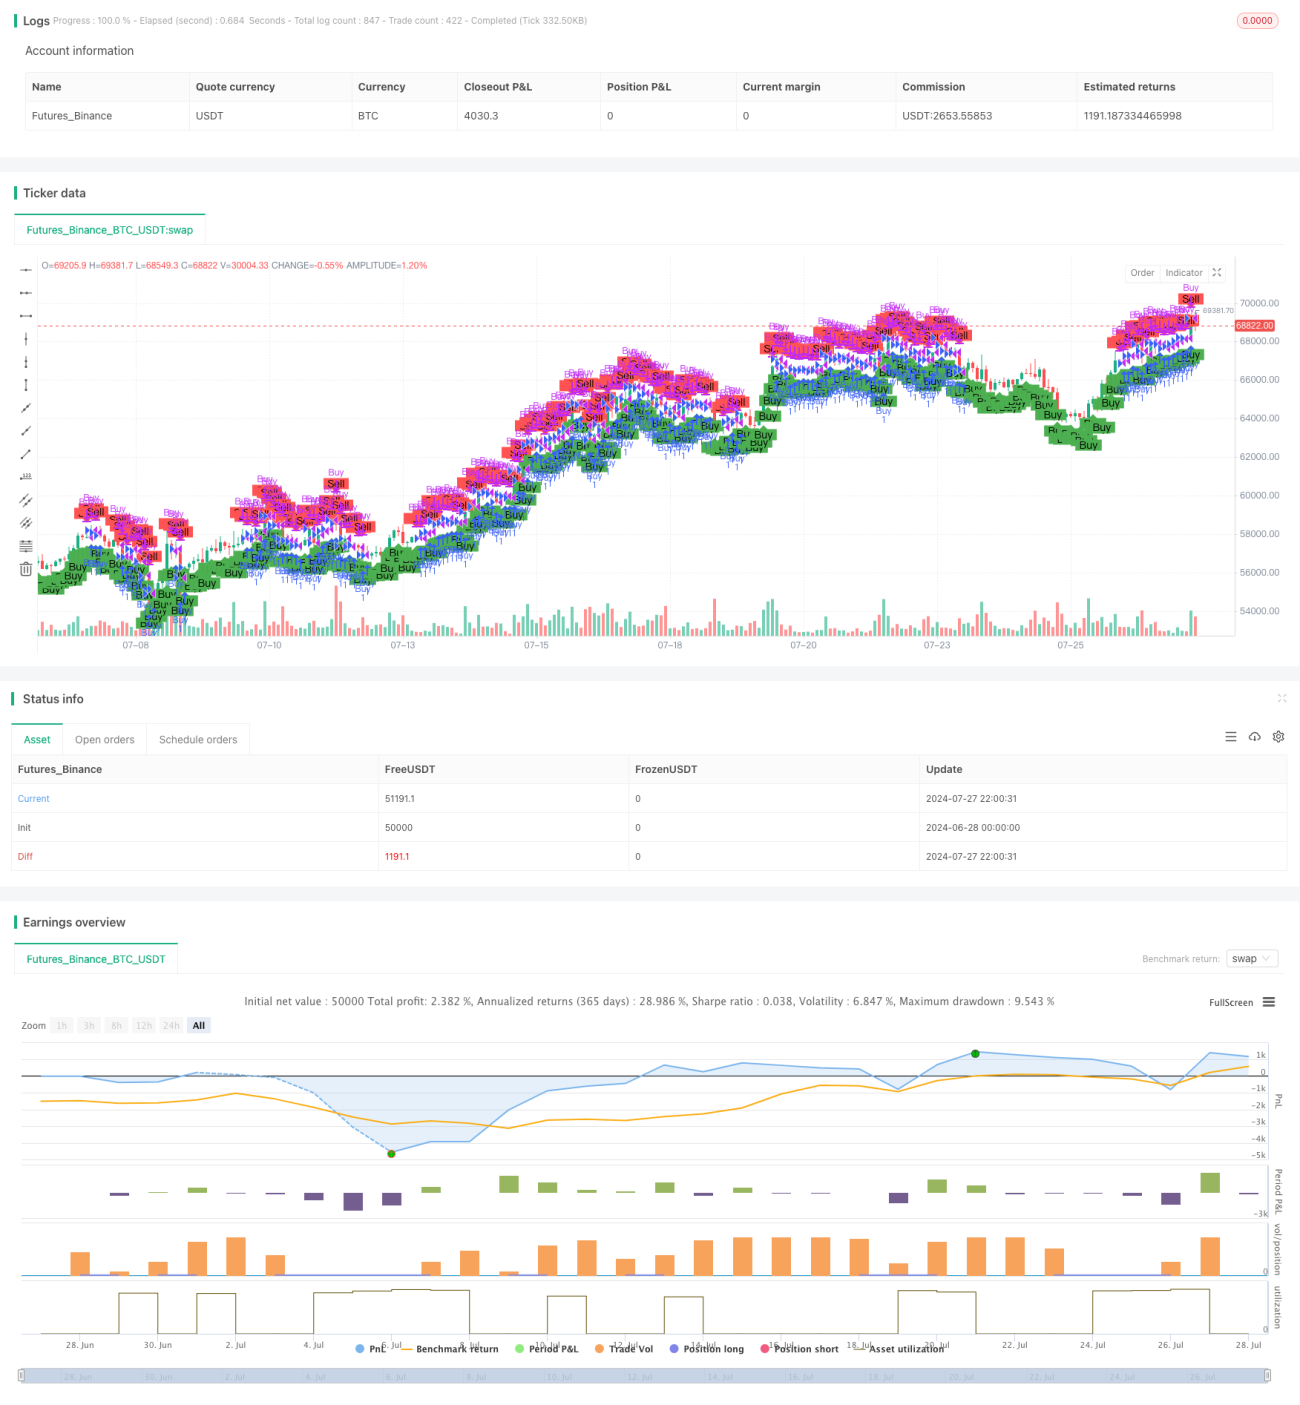
ছবির চিত্রঃ
- প্লটশেপ () ফাংশন ব্যবহার করে একটি চার্টে ক্রয় এবং বিক্রয় সংকেত চিহ্নিত করুন।
এই নকশাটি মূলত তিন সপ্তাহ আগের স্তর অতিক্রম করার সময় মূল্যের উত্থানের গতিশীলতা ধরে রাখার জন্য তৈরি করা হয়েছে, এবং যখন দাম ফিরে আসে তখন মুনাফা সুরক্ষার জন্য সময়মতো প্যাকেজিং করা হয়েছে।
কৌশলগত সুবিধা
-
মধ্যবর্তী প্রবণতা ক্যাপচারঃ বর্তমান মূল্যের সাথে তিন সপ্তাহ আগের মূল্যের স্তরের তুলনা করে কৌশলটি মধ্যবর্তী প্রবণতার গঠন এবং ধারাবাহিকতা কার্যকরভাবে সনাক্ত করতে পারে।
-
গোলমাল ফিল্টারঃ তিন চক্রের সময়সীমা ব্যবহার করে সংকেতের নির্ভরযোগ্যতা বাড়ানোর জন্য স্বল্পমেয়াদী বাজার ওঠানামা ফিল্টার করতে সাহায্য করে।
-
গতিশীল অভিযোজনঃ কৌশলটি বাজারের পরিবর্তনের সাথে গতিশীলভাবে খাপ খাইয়ে নিতে সক্ষম, সর্বশেষ মূল্যের তথ্যের উপর ভিত্তি করে সিদ্ধান্তের মানদণ্ডকে ক্রমাগত আপডেট করে।
-
ঝুঁকি ব্যবস্থাপনাঃ বিক্রির জন্য সুস্পষ্ট শর্তাদি নির্ধারণের মাধ্যমে, কৌশলটি বাজারের পরিবর্তনের সময় অবিলম্বে পজিশন বন্ধ করতে এবং ঝুঁকি কার্যকরভাবে নিয়ন্ত্রণ করতে সক্ষম।
-
সহজেই বোঝা যায়ঃ কৌশলগত যুক্তি স্বজ্ঞাত, সহজেই বোঝা যায় এবং প্রয়োগ করা যায়, নতুন এবং অভিজ্ঞ ব্যবসায়ীদের জন্য উপযুক্ত।
-
ভিজ্যুয়ালাইজেশন সহায়তাঃ ট্রেডারদের স্বতঃস্ফূর্ত বিচার এবং প্রতিক্রিয়া বিশ্লেষণের জন্য চার্টগুলিতে ক্রয়-বিক্রয় সংকেতগুলি স্পষ্টভাবে চিহ্নিত করুন।
কৌশলগত ঝুঁকি
-
ভুয়া ব্রেকআপের ঝুঁকিঃ ক্রমাগত ভুয়া ব্রেকআপের ফলে অতিরিক্ত লেনদেন এবং অপ্রয়োজনীয় ফীজ ক্ষতি হতে পারে।
-
পিছিয়ে পড়াঃ ত্রি-চক্রের ঐতিহাসিক ডেটা ব্যবহারের ফলে সংকেত পিছিয়ে যেতে পারে এবং দ্রুত পরিবর্তিত বাজারে সেরা প্রবেশের সময়টি মিস করতে পারে।
-
একক সময় ফ্রেমের সীমাবদ্ধতাঃ শুধুমাত্র তিন সময়ের উপর নির্ভরশীল তথ্য অন্যান্য সময় ফ্রেমের গুরুত্বপূর্ণ বাজার তথ্য উপেক্ষা করতে পারে।
-
স্টপ লস মেকানিজমের অভাবঃ বর্তমান কৌশলগুলির কোনও সুস্পষ্ট স্টপ লস মেকানিজম নেই এবং বাজারের তীব্র অস্থিরতার সময় বড় ক্ষতির মুখোমুখি হতে পারে।
-
অতিরিক্ত নির্ভরশীলতাঃ কৌশলটি মূলত বন্ধের দামের উপর ভিত্তি করে বিচার করে এবং সম্ভবত বন্ধের গুরুত্বপূর্ণ মূল্য পরিবর্তনকে উপেক্ষা করে।
-
ট্র্যাফিক নিশ্চিতকরণের অভাবঃ ট্র্যাফিকের কারণ বিবেচনা না করে, এটি কম ট্র্যাফিকের সময় মিথ্যা সংকেত তৈরি করতে পারে।
কৌশল অপ্টিমাইজেশনের দিকনির্দেশনা
-
মাল্টি-টাইম ফ্রেম বিশ্লেষণঃ একাধিক সময় ফ্রেমের ডেটা যেমন সূর্য, ঘূর্ণিঝড় এবং চাঁদের লাইনকে একত্রিত করে, যাতে একটি বিস্তৃত বাজার দৃষ্টিভঙ্গি সরবরাহ করা যায়।
-
ট্র্যাফিকের পরিমাপঃ ট্র্যাফিকের বিশ্লেষণের সাথে সংযুক্ত, এটি বিশেষত ব্রেকথ্রু নিশ্চিতকরণের ক্ষেত্রে সংকেতের নির্ভরযোগ্যতা বাড়িয়ে তুলতে পারে।
-
ডায়নামিক স্টপ মেকানিজম: ঝুঁকি ব্যবস্থাপনা উন্নত করতে ট্র্যাকিং স্টপ বা এটিআর-ভিত্তিক স্টপ-এর মতো অভিযোজিত স্টপ কৌশল বাস্তবায়ন করা।
-
সিগন্যাল ফিল্টারঃ মিথ্যা সংকেত কমাতে অতিরিক্ত প্রযুক্তিগত সূচক বা বাজার সংবেদন সূচক যেমন আরএসআই বা এমএসিডি যুক্ত করুন।
-
এন্ট্রি অপ্টিমাইজেশানঃ সরাসরি বাজার মূল্যের পরিবর্তে সীমিত মূল্য তালিকা বা পর্যবেক্ষণ বিভাগ ব্যবহার করে আরও ভাল লেনদেনের দাম অর্জনের জন্য বিবেচনা করুন।
-
পজিশন ম্যানেজমেন্টঃ একটি গতিশীল পজিশন ম্যানেজমেন্ট কৌশল বাস্তবায়ন করুন, বাজারের অস্থিরতা এবং অ্যাকাউন্টের ঝুঁকির ভিত্তিতে প্রতিটি লেনদেনের পজিশনের আকার সামঞ্জস্য করুন।
-
মার্কেট স্ট্যাটাস আইডেন্টিফিকেশনঃ মার্কেট স্ট্যাটাস (ট্রেন্ড, কনভলশন, হাই ওভারল্যাপ) এর আইডেন্টিফিকেশন লজিক যোগ করুন, বিভিন্ন মার্কেট পরিবেশে বিভিন্ন ট্রেডিং প্যারামিটার ব্যবহার করুন।
-
পুনরুদ্ধার এবং অপ্টিমাইজেশনঃ প্রচুর পরিমাণে ইতিহাসের তথ্য পুনরুদ্ধার করুন, সময়কাল, শর্তাদি থ্রেশহোল্ড ইত্যাদির মতো কৌশলগত প্যারামিটারগুলিকে অনুকূলিত করুন।
সারসংক্ষেপ
তিন-চক্রের উচ্চ-নিম্ন গতিশীল ট্রেডিং কৌশলটি একটি সহজ এবং কার্যকর মধ্যমেয়াদী প্রবণতা ট্র্যাকিং পদ্ধতি। সর্বশেষ উচ্চতা, সর্বশেষ বন্ধের দাম এবং তিন সপ্তাহ আগে বন্ধের দামের তুলনা করে কৌশলটি মূল্যের ব্রেকআপ এবং গতিশীলতার পরিবর্তনগুলি ধরতে সক্ষম। এর সুবিধা হ'ল এটি স্বল্পমেয়াদী শব্দটি ফিল্টার করতে সক্ষম, মধ্যমেয়াদী প্রবণতা ক্যাপচার করে এবং যুক্তিটি সহজেই বোঝা যায়। তবে কৌশলটি মিথ্যা ব্রেকআপ, সংকেত পিছিয়ে এবং ঝুঁকি পরিচালনার অভাবের মতো চ্যালেঞ্জগুলির মুখোমুখি হয়।
ভবিষ্যতে অপ্টিমাইজেশনের দিকটি মাল্টি টাইম ফ্রেম বিশ্লেষণ, লেনদেনের পরিমাণ নিশ্চিতকরণ, গতিশীল ঝুঁকি ব্যবস্থাপনা এবং বাজারের অবস্থা সনাক্তকরণের দিকে নজর দেওয়া উচিত। এই উন্নতিগুলির মাধ্যমে, কৌশলগুলি বিভিন্ন বাজারের পরিবেশে আরও স্থিতিশীল হওয়ার সম্ভাবনা রয়েছে এবং ব্যবসায়ীদের আরও নির্ভরযোগ্য সিদ্ধান্ত সমর্থন সরবরাহ করে।
সামগ্রিকভাবে, এই কৌশলটি পরিমাণগত ব্যবসায়ের জন্য একটি ভাল সূচনা পয়েন্ট সরবরাহ করে, যা ক্রমাগত অপ্টিমাইজেশন এবং পরিমার্জনের মাধ্যমে একটি শক্তিশালী ব্যবসায়ের সরঞ্জাম হওয়ার সম্ভাবনা রয়েছে। তবে, বিনিয়োগকারীদের ব্যবহারিক প্রয়োগের সময় সতর্কতা অবলম্বন করা উচিত, বাজারের ঝুঁকি সম্পর্কে পুরোপুরি সচেতন হওয়া উচিত এবং তাদের ঝুঁকি সহনশীলতা এবং বিনিয়োগের লক্ষ্যের সাথে মিলিয়ে এই কৌশলটি ব্যবহার করা উচিত।
Overview
This strategy is a momentum trading approach based on three-week high and low points. It utilizes price data from the recent three weeks to identify potential buying and selling opportunities. The strategy primarily focuses on the relationship between the latest high, the latest closing price, and the closing price from three weeks ago, generating trading signals by comparing these price levels. This method aims to capture medium-term price trends while avoiding the impact of short-term market noise.
Strategy Principle
The core principles of this strategy include the following key elements:
-
Indicator Calculations:
- Latest High: Uses the ta.highest() function to calculate the highest price over the last 30 trading days (approximately 4 weeks).
- Latest Close: Uses close[1] to get the closing price of the previous day.
- Three Weeks Ago Close: Uses close[30] to get the closing price from 30 trading days ago.
-
Buy Conditions:
- Condition 1: The latest high is greater than or equal to the closing price from three weeks ago.
- Condition 2: The latest closing price is greater than the closing price from three weeks ago.
-
Sell Condition:
- Triggers a sell signal when the latest closing price is greater than the closing price from three weeks ago.
-
Trade Execution:
- Enters a long position when the buy signal is triggered.
- Closes the current long position when the sell signal is triggered.
-
Visualization:
- Uses the plotshape() function to mark buy and sell signals on the chart.
This design aims to capture upward momentum when the price breaks above the level from three weeks ago, while promptly closing positions to protect profits when the price falls back.
Strategy Advantages
-
Medium-Term Trend Capture: By comparing current prices with levels from three weeks ago, the strategy effectively identifies the formation and continuation of medium-term trends.
-
Noise Filtering: Using a three-week time frame helps filter out short-term market fluctuations, improving the reliability of signals.
-
Dynamic Adaptation: The strategy continuously updates its decision criteria based on the latest price data, allowing it to dynamically adapt to market changes.
-
Risk Management: Through clear sell conditions, the strategy can close positions promptly when the market turns, effectively controlling risk.
-
Simple and Understandable: The strategy logic is intuitive, easy to understand and implement, suitable for both novice and experienced traders.
-
Visual Support: Buy and sell signals are clearly marked on the chart, facilitating intuitive judgment and backtesting analysis for traders.
Strategy Risks
-
False Breakout Risk: In sideways markets, frequent false breakouts may occur, leading to excessive trading and unnecessary transaction fee losses.
-
Lagging Nature: Using historical data from three weeks may result in lagging signals, potentially missing optimal entry points in rapidly changing markets.
-
Single Time Frame Limitation: Relying solely on three-week data may overlook important market information from other time frames.
-
Lack of Stop-Loss Mechanism: The current strategy lacks a clear stop-loss mechanism, potentially facing significant losses during severe market fluctuations.
-
Over-reliance on Closing Prices: The strategy mainly bases its judgments on closing prices, potentially ignoring important intraday price movements.
-
Lack of Volume Confirmation: Not considering volume factors may lead to false signals during periods of low trading volume.
Strategy Optimization Directions
-
Multi-Time Frame Analysis: Integrate data from multiple time frames, such as daily, weekly, and monthly, to provide a more comprehensive market perspective.
-
Incorporate Volume Indicators: Combining volume analysis can improve signal reliability, especially in breakout confirmation.
-
Dynamic Stop-Loss Mechanism: Implement adaptive stop-loss strategies, such as trailing stops or ATR-based stops, for better risk management.
-
Signal Filters: Add additional technical or market sentiment indicators, like RSI or MACD, to reduce false signals.
-
Entry Optimization: Consider using limit orders or observation zones instead of direct market orders for entry to obtain better execution prices.
-
Position Management: Implement dynamic position sizing strategies, adjusting the size of each trade based on market volatility and account risk.
-
Market State Recognition: Add logic to identify market states (trending, ranging, high volatility) and adopt different trading parameters for different market environments.
-
Backtesting and Optimization: Conduct extensive historical data backtesting to optimize strategy parameters such as time periods and condition thresholds.
Summary
The Three-Week High-Low Momentum Trading Strategy is a simple yet effective method for medium-term trend following. By comparing the latest high, latest close, and the closing price from three weeks ago, the strategy can capture price breakouts and momentum changes. Its strengths lie in filtering short-term noise, capturing medium-term trends, and its simple, easy-to-understand logic. However, the strategy also faces challenges such as false breakouts, signal lag, and insufficient risk management.
Future optimization directions should focus on multi-time frame analysis, volume confirmation, dynamic risk management, and market state recognition. Through these improvements, the strategy has the potential to perform more robustly in different market environments, providing traders with more reliable decision support.
Overall, this strategy provides a good starting point for quantitative trading. With continuous optimization and refinement, it has the potential to become a powerful trading tool. However, investors should be cautious when applying it in practice, fully recognizing market risks and using the strategy in conjunction with their own risk tolerance and investment objectives.
- 1