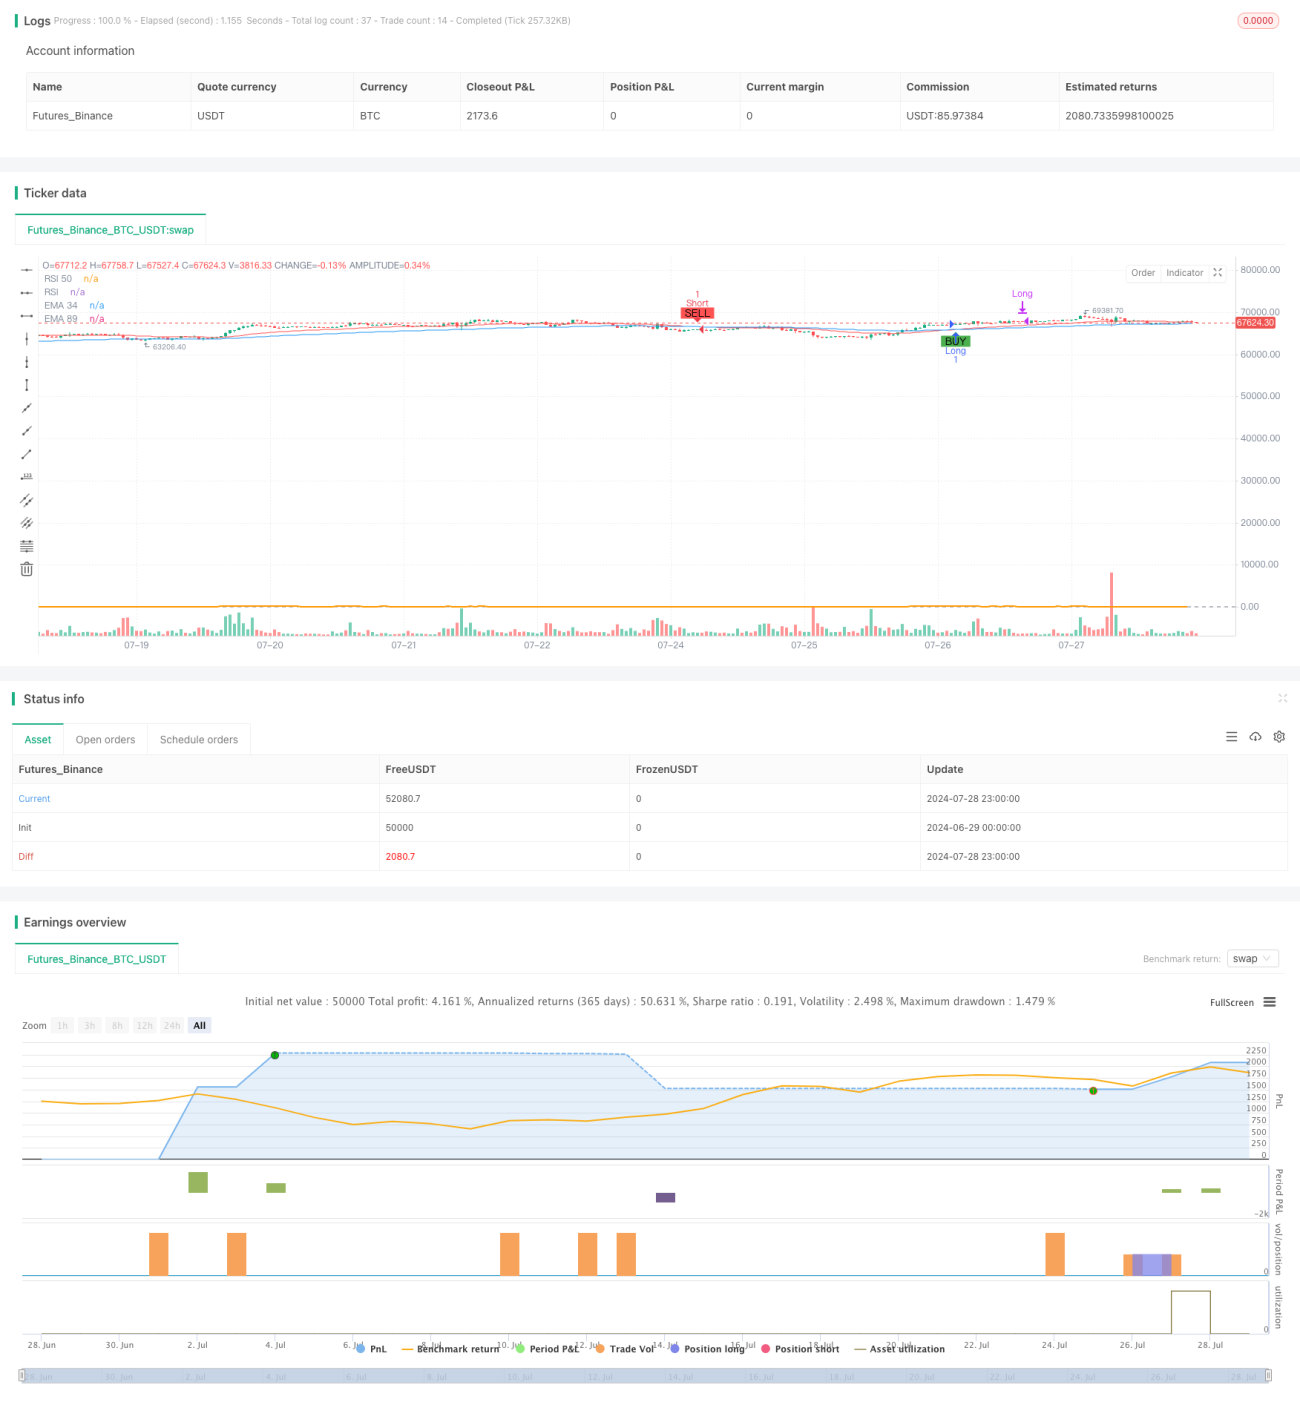
এই কৌশলটি একাধিক প্রযুক্তিগত সূচকের উপর ভিত্তি করে একটি সমন্বিত ট্রেডিং সিস্টেম, যা মূলত সূচক মুভিং এভারেজ (EMA), আপেক্ষিকভাবে দুর্বল সূচক (RSI) এবং লেনদেনের পরিমাণ ব্যবহার করে লেনদেনের সংকেত তৈরি করে এবং পজিশন পরিচালনা করে। এই কৌশলটি ইএমএ ক্রস করে বাজারের প্রবণতা নির্ধারণ করে, যখন আরএসআই সূচকটি ওভার-বিক্রয় এবং লেনদেনের পরিমাণের সাথে সংযুক্ত করে সংকেতের শক্তি নিশ্চিত করার জন্য ব্যবহৃত হয়। তদতিরিক্ত, কৌশলটিতে একটি গতিশীল স্টপ লস মেশিন এবং স্থির পজিশন হোল্ডিংয়ের সময়সীমা রয়েছে যা ঝুঁকি নিয়ন্ত্রণ এবং লেনদেনের পারফরম্যান্সকে অনুকূল করে তোলে।
ট্রেডিং সিগন্যাল জেনারেটঃ
ডায়নামিক স্টপ লসঃ
ফিক্সড পজিশন হোল্ডিং সময়ঃ
ইএমএ বন্ধঃ
লেনদেনের পরিমাণঃ
একাধিক সূচক সমন্বয়ঃ ইএমএ, আরএসআই এবং লেনদেনের পরিমাণের সমন্বয়ে, বাজার পরিস্থিতির বিস্তৃত বিশ্লেষণ, সংকেতের নির্ভরযোগ্যতা বাড়ানো।
গতিশীল ঝুঁকি ব্যবস্থাপনাঃ বাজারের ওঠানামা অনুযায়ী রিয়েল টাইমে স্টপ-অফ-লস সামঞ্জস্য করে, বিভিন্ন বাজারের পরিবেশের সাথে খাপ খাইয়ে নেয়।
ফিক্সড হোল্ডিং টাইমঃ দীর্ঘমেয়াদী হোল্ডিংয়ের ঝুঁকি এড়াতে এবং প্রতিটি লেনদেনের এক্সপোজার টাইম নিয়ন্ত্রণ করতে।
EMA গতিশীল ক্ষতিঃ গতিশীল সমর্থন প্রতিরোধের হিসাবে সমান্তরাল ব্যবহার করে, আরও নমনীয় ক্ষতির সুরক্ষা প্রদান করে।
ট্রেডিং ভলিউম নিশ্চিতকরণঃ ট্রেডিং ভলিউম ব্রেকআপ ব্যবহার করে সিগন্যালের শক্তি নিশ্চিত করা এবং ট্রেডিংয়ের নির্ভুলতা বাড়ানো।
ভিজ্যুয়ালাইজেশনঃ ক্রয়-বিক্রয় সংকেত এবং মূল মূল্যের স্তরগুলি চার্টগুলিতে বিশ্লেষণ এবং সিদ্ধান্ত গ্রহণের সুবিধার্থে।
ঝড়ের ঝুঁকিঃ EMA ক্রসগুলি ঘন ঘন মিথ্যা সংকেত তৈরি করতে পারে।
RSI থ্রেশহোল্ড স্থিরঃ স্থির RSI থ্রেশহোল্ড সব বাজার পরিস্থিতিতে প্রযোজ্য নাও হতে পারে।
লেনদেনের পরিমাণে মূল্য হ্রাসের সংবেদনশীলতাঃ লেনদেনের গড় পরিমাণের ৩ গুণ মূল্য হ্রাস খুব বেশি বা খুব কম হতে পারে এবং নির্দিষ্ট বাজারের সাথে সামঞ্জস্য করা প্রয়োজন।
ফিক্সড পজিশনিং টাইম লিমিটঃ 15 টি K-লাইন ফিক্সড পজিশনিং টাইম লাভজনক ট্রেডিংয়ের অকাল সমাপ্তির কারণ হতে পারে।
স্টপ লস প্রাইস সেটআপঃ উচ্চ ট্রেডিং ভলিউম দেখা দিলে ক্লোজ-আপ প্রাইসটি স্টপ লস প্রাইস হিসেবে যথেষ্ট অপ্টিমাইজড নাও হতে পারে।
ডায়নামিক আরএসআই থ্রেশহোল্ডঃ বাজারের অস্থিরতার উপর নির্ভর করে আরএসআই-এর ওভার-বই ওভার-বিক্রয় থ্রেশহোল্ড স্বয়ংক্রিয়ভাবে সমন্বয় করে।
ট্রেডিং ভলিউম অবমূল্যায়ন অপ্টিমাইজ করুনঃ ঐতিহাসিক তথ্যের উপর ভিত্তি করে ট্রেডিং ভলিউমের গতিশীলতার উপর ভিত্তি করে একটি স্ব-অনুকূলিতকরণ ব্যবস্থা চালু করুন।
পজিশন হোল্ডিং সময় ব্যবস্থাপনা উন্নত করুনঃ প্রবণতা শক্তি এবং লাভজনকতার সাথে মিলিত, সর্বাধিক পজিশন হোল্ডিং সময়কে গতিশীলভাবে সামঞ্জস্য করুন
স্টপ লস সেটিং অপ্টিমাইজ করুনঃ এটিআর সূচকটি চালু করার কথা বিবেচনা করুন, বাজারের অস্থিরতার গতিশীলতার উপর ভিত্তি করে স্টপ লস মূল্য সেট করুন।
প্রবণতা ফিল্টার যুক্ত করুনঃ দীর্ঘমেয়াদী ইএমএ বা প্রবণতা সূচকগুলি প্রবর্তন করুন, মূল প্রবণতার বিপরীতে ট্রেডিং এড়াতে।
দামের আচরণ বিশ্লেষণের প্রবর্তনঃ কে-লাইন আকৃতি এবং সমর্থন প্রতিরোধের স্তরের সমন্বয়, প্রবেশ এবং প্রস্থানগুলির যথার্থতা উন্নত করে।
প্রত্যাহার নিয়ন্ত্রণ যোগ করার কথা বিবেচনা করুনঃ সর্বোচ্চ প্রত্যাহারের সীমা সেট করুন এবং নির্দিষ্ট প্রত্যাহারের স্তর পৌঁছানোর পরে প্লেইন বাধ্যতামূলক করুন।
EMA, RSI এবং ট্রেডিং ভলিউমের সমন্বয়ে এই মাল্টি-ইনডিকেটর ইন্টিগ্রেটেড ডায়নামিক ট্রেডিং কৌশলটি একটি বিস্তৃত ট্রেডিং সিস্টেম তৈরি করে। এটি কেবলমাত্র বাজারের প্রবণতা ক্যাপচার করতে সক্ষম নয়, তবে গতিশীল স্টপ লস এবং ফিক্সড হোল্ডিং টাইমের মাধ্যমে ঝুঁকি পরিচালনা করতে পারে। কৌশলটির সুবিধা হল এর বহু-মাত্রিক বিশ্লেষণ এবং নমনীয় ঝুঁকি পরিচালনা, তবে একই সাথে বাজারের পরিবেশের পরিবর্তনের দ্বারা সৃষ্ট চ্যালেঞ্জগুলির মুখোমুখি। আরএসআই হ্রাস, ট্রেডিং ভলিউম বিচারক মানদণ্ড, হোল্ডিং সময় পরিচালনা এবং স্টপ লস সেটিং আরও অপ্টিমাইজ করার মাধ্যমে, কৌশলটি বিভিন্ন বাজারের পরিবেশে আরও ভাল পারফরম্যান্সের সম্ভাবনা রয়েছে। অবশেষে, এই কৌশলটি ব্যবসায়ীদের একটি নির্ভরযোগ্য কাঠামো সরবরাহ করে যা ব্যক্তিগত ট্রেডিং শৈলী এবং বাজারের বৈশিষ্ট্য অনুসারে তৈরি এবং উন্নত করা যেতে পারে।
/*backtest
start: 2024-06-29 00:00:00
end: 2024-07-29 00:00:00
period: 1h
basePeriod: 15m
exchanges: [{"eid":"Futures_Binance","currency":"BTC_USDT"}]
*/
//@version=5
strategy("EMA & RSI Strategy", overlay=true)
// Install indicators
ema34 = ta.ema(close, 34)
ema89 = ta.ema(close, 89)
ema54 = ta.ema(close, 54)
ema150 = ta.ema(close, 150)
rsi = ta.rsi(close, 14)
// Draw indicator
plot(ema34, color=color.red, title="EMA 34")
plot(ema89, color=color.blue, title="EMA 89")
//plot(ema54, color=color.green, title="EMA 54")
//plot(ema150, color=color.yellow, title="EMA 150")
hline(50, "RSI 50", color=color.gray)
plot(rsi, title="RSI", color=color.orange, linewidth=2, offset=-1)
// condition long or short
longCondition = ta.crossover(ema34, ema89) and rsi > 30
shortCondition = ta.crossunder(ema34, ema89) and rsi < 70
// Add strategy long
if (longCondition)
strategy.entry("Long", strategy.long)
// Add strategy short
if (shortCondition)
strategy.entry("Short", strategy.short)
// Calculate the average volume of previous candles
length = 20 // Number of candles to calculate average volume
avgVolume = ta.sma(volume, length)
highVolumeCondition = volume > 3 * avgVolume
// Determine take profit and stop loss prices when there is high volume
var float takeProfitPriceLong = na
var float stopLossPriceLong = na
var float takeProfitPriceShort = na
var float stopLossPriceShort = na
if (longCondition)
takeProfitPriceLong := na
stopLossPriceLong := na
if (shortCondition)
takeProfitPriceShort := na
stopLossPriceShort := na
// Update take profit and stop loss prices when volume is high
if (strategy.opentrades.entry_id(0) == "Long" and highVolumeCondition)
takeProfitPriceLong := close
stopLossPriceLong := close
if (strategy.opentrades.entry_id(0) == "Short" and highVolumeCondition)
takeProfitPriceShort := close
stopLossPriceShort := close
// Execute exit orders for buy and sell orders when there is high volume
if (not na(takeProfitPriceLong))
strategy.exit("Take Profit Long", from_entry="Long", limit=takeProfitPriceLong, stop=stopLossPriceLong)
if (not na(takeProfitPriceShort))
strategy.exit("Take Profit Short", from_entry="Short", limit=takeProfitPriceShort, stop=stopLossPriceShort)
// Track the number of candles since the order was opened
var int barsSinceEntryLong = na
var int barsSinceEntryShort = na
var bool longPositionClosed = false
var bool shortPositionClosed = false
if (longCondition)
barsSinceEntryLong := 0
longPositionClosed := false
if (shortCondition)
barsSinceEntryShort := 0
shortPositionClosed := false
if (strategy.opentrades.entry_id(0) == "Long")
barsSinceEntryLong := barsSinceEntryLong + 1
if (strategy.opentrades.entry_id(0) == "Short")
barsSinceEntryShort := barsSinceEntryShort + 1
// Check the conditions to close the order at the 15th candle
if (strategy.opentrades.entry_id(0) == "Long" and barsSinceEntryLong >= 15 and not longPositionClosed)
strategy.close("Long")
longPositionClosed := true
if (strategy.opentrades.entry_id(0) == "Short" and barsSinceEntryShort >= 15 and not shortPositionClosed)
strategy.close("Short")
shortPositionClosed := true
// Thêm stop loss theo EMA34
if (strategy.opentrades.entry_id(0) == "Long")
strategy.exit("Stop Loss Long", from_entry="Long", stop=ema34)
if (strategy.opentrades.entry_id(0) == "Short")
strategy.exit("Stop Loss Short", from_entry="Short", stop=ema34)
// Displays buy/sell signals and price levels on the chart
plotshape(series=longCondition, location=location.belowbar, color=color.green, style=shape.labelup, text="BUY")
plotshape(series=shortCondition, location=location.abovebar, color=color.red, style=shape.labeldown, text="SELL")
// Displays take profit and stop loss prices on the chart
// var line takeProfitLineLong = na
// var line stopLossLineLong = na
// var line takeProfitLineShort = na
// var line stopLossLineShort = na
// if (not na(takeProfitPriceLong))
// if na(takeProfitLineLong)
// takeProfitLineLong := line.new(x1=bar_index, y1=takeProfitPriceLong, x2=bar_index + 1, y2=takeProfitPriceLong, color=color.blue, width=1, style=line.style_dashed)
// else
// line.set_xy1(takeProfitLineLong, x=bar_index, y=takeProfitPriceLong)
// line.set_xy2(takeProfitLineLong, x=bar_index + 1, y=takeProfitPriceLong)
// if (not na(stopLossPriceLong))
// if na(stopLossLineLong)
// stopLossLineLong := line.new(x1=bar_index, y1=stopLossPriceLong, x2=bar_index + 1, y2=stopLossPriceLong, color=color.red, width=1, style=line.style_dashed)
// else
// line.set_xy1(stopLossLineLong, x=bar_index, y=stopLossPriceLong)
// line.set_xy2(stopLossLineLong, x=bar_index + 1, y=stopLossPriceLong)
// if (not na(takeProfitPriceShort))
// if na(takeProfitLineShort)
// takeProfitLineShort := line.new(x1=bar_index, y1=takeProfitPriceShort, x2=bar_index + 1, y2=takeProfitPriceShort, color=color.blue, width=1, style=line.style_dashed)
// else
// line.set_xy1(takeProfitLineShort, x=bar_index, y=takeProfitPriceShort)
// line.set_xy2(takeProfitLineShort, x=bar_index + 1, y=takeProfitPriceShort)
// if (not na(stopLossPriceShort))
// if na(stopLossLineShort)
// stopLossLineShort := line.new(x1=bar_index, y1=stopLossPriceShort, x2=bar_index + 1, y2=stopLossPriceShort, color=color.red, width=1, style=line.style_dashed)
// else
// line.set_xy1(stopLossLineShort, x=bar_index, y=stopLossPriceShort)
// line.set_xy2(stopLossLineShort, x=bar_index + 1, y=stopLossPriceShort)
// // Shows annotations for take profit and stop loss prices
// if (not na(takeProfitPriceLong))
// label.new(x=bar_index, y=takeProfitPriceLong, text="TP Long", style=label.style_label_down, color=color.blue, textcolor=color.white)
// if (not na(stopLossPriceLong))
// label.new(x=bar_index, y=stopLossPriceLong, text="SL Long", style=label.style_label_up, color=color.red, textcolor=color.white)
// if (not na(takeProfitPriceShort))
// label.new(x=bar_index, y=takeProfitPriceShort, text="TP Short", style=label.style_label_up, color=color.blue, textcolor=color.white)
// if (not na(stopLossPriceShort))
// label.new(x=bar_index, y=stopLossPriceShort, text="SL Short", style=label.style_label_down, color=color.red, textcolor=color.white)