ডাবল স্মুথড গড় প্রবণতা অনুসরণ কৌশল - উন্নত পিং আন জিয়াংশি কে-লাইনের উপর ভিত্তি করে

ওভারভিউ
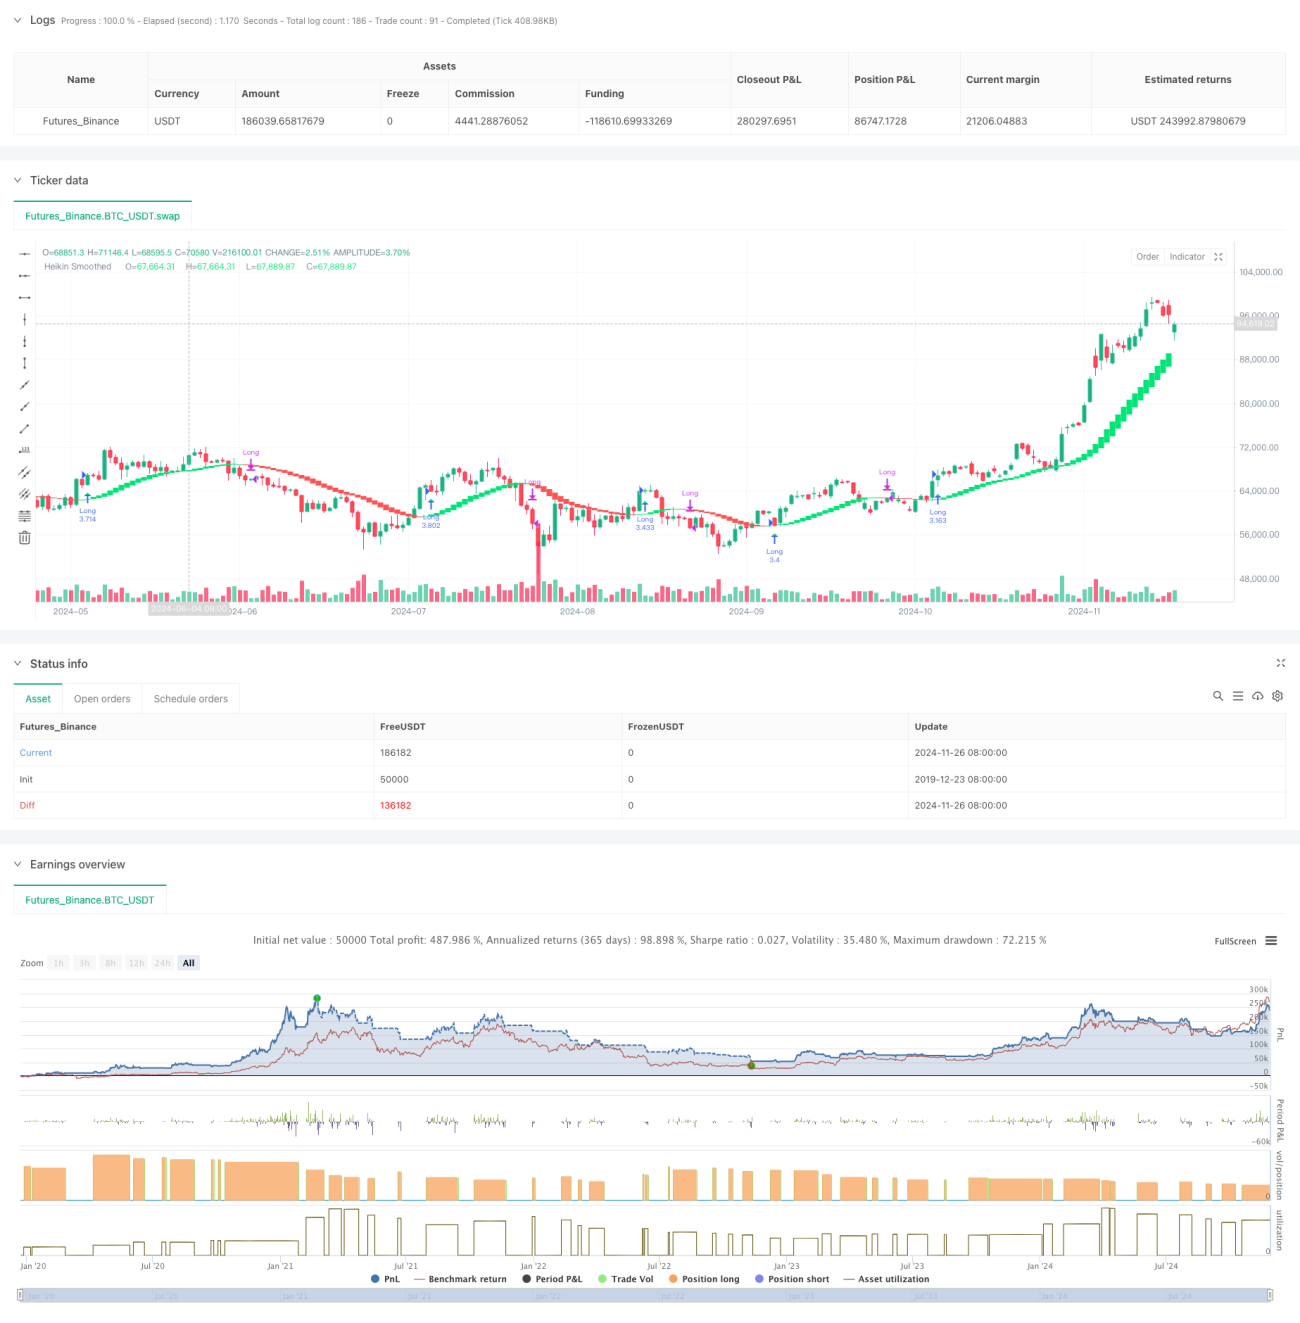
এই কৌশলটি হেইকিন-আশির একটি পরিমার্জিত প্রবণতা ট্র্যাকিং সিস্টেমের উপর ভিত্তি করে তৈরি করা হয়েছে। ঐতিহ্যবাহী হেইকিন-আশির K-লাইনগুলির উপর ডাবল ইন্ডেক্সাল মুভিং এভারেজ (EMA) মসৃণকরণ দ্বারা কার্যকরভাবে বাজারের শব্দকে হ্রাস করে এবং আরও পরিষ্কার প্রবণতা সংকেত সরবরাহ করে। কৌশলটি কেবলমাত্র একাধিক পদ্ধতিতে কাজ করে, একটি উত্থান প্রবণতা এবং একটি পতনের প্রবণতা স্থির অবস্থানের জন্য, একটি কার্যকর প্রবণতা ক্যাপচার দ্বারা বাজারের লাভ অর্জনের জন্য।
কৌশল নীতি
কৌশলটির মূল যুক্তিতে নিম্নলিখিত মূল পদক্ষেপগুলি অন্তর্ভুক্ত রয়েছে:
- ওএইচএলসি মূল্যের তথ্যের প্রথম ইএমএ মসৃণকরণ
- সমতলীকরণের পরে মূল্য গণনা করার জন্য উন্নত পাইংইয়াং-এর কে লাইন
- দ্বিতীয় ইএমএ মসৃণকরণে পিয়াংজিয়াংয়ের কে লাইন গণনা করা হয়েছে
- K-লাইন রঙের পরিবর্তনের জন্য, খোলার এবং বন্ধের মূল্যের সমন্বয় করুন
- কে লাইনে লাল থেকে সবুজ এবং সবুজ থেকে লাল বিক্রয় সংকেত তৈরি করে
- অ্যাকাউন্টের মোট মূল্যের ১০০% পজিশনে লেনদেন করা
কৌশলগত সুবিধা
- দ্বৈত মসৃণকরণ উল্লেখযোগ্যভাবে মিথ্যা সংকেত হ্রাস করে
- শুধু একাধিক কৌশল অবলম্বন করলেই, আপনি খালি পেটে যাওয়ার ঝুঁকি কমিয়ে আনতে পারেন।
- প্রবণতা নিশ্চিত হওয়ার পরেই খেলতে শুরু করুন এবং আপনার হার বাড়ান
- সম্পূর্ণ সিগন্যাল সিস্টেম স্বয়ংক্রিয় লেনদেন সমর্থন করে
- বিভিন্ন লেনদেনের চাহিদা পূরণের জন্য নমনীয় সময়সীমার বিকল্প
- সহজ ও সুস্পষ্ট খেলার নিয়মাবলী
- বিভিন্ন বাজার অবস্থার অধীনে তহবিল ব্যবস্থাপনা সমর্থন
কৌশলগত ঝুঁকি
- প্রবণতা বিপরীতের প্রথম দিকে একটি বড় প্রত্যাহার হতে পারে
- বাজারে ধারাবাহিক ভুল সংকেত সৃষ্টি হতে পারে
- সম্পূর্ণ পজিশনের ট্রেডিং পদ্ধতিতে তহবিলের ঝুঁকি বাড়ায়
- ইনকামিং সিগন্যাল বিলম্বিত হওয়ার কারণে কিছু বৃদ্ধি মিস করা হতে পারে
- বিভিন্ন সময়কালের মধ্যে বড় পার্থক্য
কৌশল অপ্টিমাইজেশনের দিকনির্দেশনা
- প্রবণতা তীব্রতা ফিল্টারগুলি প্রবর্তন করে, বাজারের ভ্রান্ত সংকেতগুলি হ্রাস করে
- ডায়নামিক হোল্ডিং ম্যানেজমেন্ট বৃদ্ধি এবং তহবিলের ব্যবহার অনুকূলিতকরণ
- মোবাইল স্টপ লস যোগ করা হয়েছে, যা প্রত্যাহারের ঝুঁকি নিয়ন্ত্রণ করে
- অন্যান্য প্রযুক্তিগত সূচকগুলির সাথে সংযুক্ত সংকেত কার্যকারিতা নিশ্চিত করুন
- কৌশলগত স্থিতিশীলতা বাড়ানোর জন্য একটি অভিযোজিত প্যারামিটার সিস্টেম তৈরি করা
সারসংক্ষেপ
এই কৌশলটি একটি শক্তিশালী প্রবণতা ট্র্যাকিং সিস্টেম তৈরি করে, যার মূল অংশটি দ্বিগুণ মসৃণকরণ এবং একটি সংশোধিত পিআইজিএএনজিএস কে লাইন। এই কৌশলটি সংক্ষিপ্ত, সহজেই বোঝা যায় এবং কার্যকর করা যায় এবং বিভিন্ন বাজার পরিস্থিতিতে অভিযোজিত হওয়ার জন্য একাধিক অপ্টিমাইজেশান দিক সরবরাহ করে। যদিও কিছু পিছিয়ে পড়া এবং প্রত্যাহারের ঝুঁকি রয়েছে, তবে যুক্তিসঙ্গত তহবিল পরিচালনা এবং ঝুঁকি নিয়ন্ত্রণের ব্যবস্থাগুলির মাধ্যমে এই কৌশলটি বিনিয়োগকারীদের জন্য একটি নির্ভরযোগ্য প্রবণতা ট্র্যাকিং সরঞ্জাম সরবরাহ করতে পারে।
/*backtest
start: 2019-12-23 08:00:00
end: 2024-11-27 08:00:00
period: 1d
basePeriod: 1d
exchanges: [{"eid":"Futures_Binance","currency":"BTC_USDT"}]
*/

//@version=5
strategy("Smoothed Heiken Ashi Strategy Long Only", overlay=true, initial_capital=1000, default_qty_type=strategy.percent_of_equity, default_qty_value=100)

len = input.int(10, title="EMA Length")- 1