
ওভারভিউ
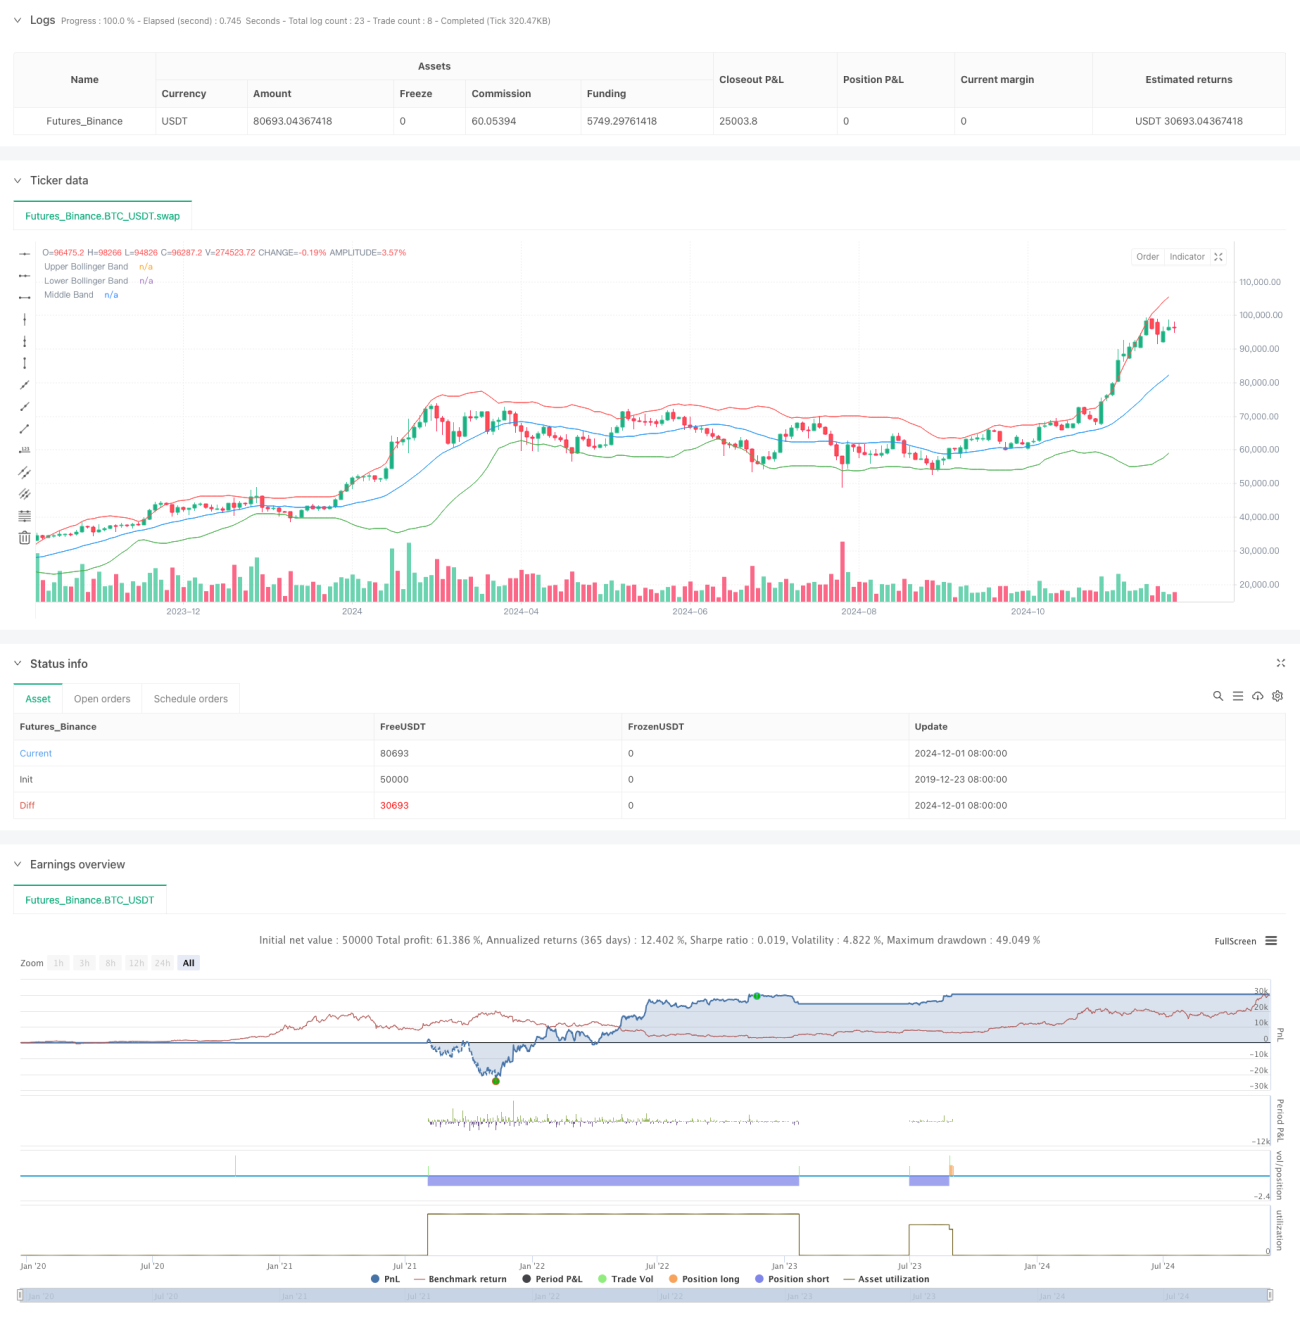
এই কৌশলটি হ'ল একটি উচ্চ-ফ্রিকোয়েন্সি ট্রেডিং সিস্টেম যা বুলিন ব্যান্ডের সূচকগুলি এবং মূল্যের ব্রেকডাউনগুলির সাথে মিলিত হয়। কৌশলটি দামের সাথে বুলিন ব্যান্ডের অবস্থান সম্পর্কিত সম্পর্ক পর্যবেক্ষণ করে, পূর্ববর্তী উচ্চ-নিম্ন ব্রেকডাউন সংকেতগুলির সাথে মিলিত হয়, যখন বাজারে ওভারব্লু ওভারসেল হয় তখন বিপরীত ট্রেডিং করা হয়। সিস্টেমটি 1:1 ঝুঁকি-লাভের তুলনায় স্টপ লস সেট করে এবং বিভিন্ন মূল মূল্যকে দৃশ্যমান উপায়ে প্রদর্শন করে, যা ব্যবসায়ীদের বাজারের গতিবিধির দৃষ্টিভঙ্গি বুঝতে সহায়তা করে।
কৌশল নীতি
কৌশলটির কেন্দ্রীয় যুক্তি দুটি প্রধান বিচার শর্তের উপর ভিত্তি করে তৈরি করা হয়েছেঃ যখন দাম পূর্বের উচ্চতা অতিক্রম করে এবং পূর্বের উচ্চতা বুলিন বন্ডের নীচে অবস্থিত হয়, তখন একাধিক সংকেত ট্রিগার করা হয়; যখন দাম পূর্বের নিম্নের নীচে পড়ে এবং পূর্বের নিম্নটি বুলিন বন্ডের উপরে অবস্থিত হয়, তখন একটি খালি সংকেত ট্রিগার করা হয়। বুলিন বন্ডের প্যারামিটারটি বাজারের অস্থিরতার পরিধি এবং ওভারব্লড ওভারসোল জোন সিস্টেমের বিচার করার জন্য 20 পিরিয়ডের মুভিং এভারেজ এবং 2 গুণ স্ট্যান্ডার্ড ডিফারেনসিয়াল ব্যবহার করে। ট্রেডিং সিগন্যাল ট্রিগার করার পরে, স্বয়ংক্রিয়ভাবে সংশ্লিষ্ট স্টপ লস এবং টার্গেট পয়েন্ট সেট করা হয় এবং বিভিন্ন স্টাইলের লাইনগুলির মাধ্যমে দৃশ্যমান করা হয়।
কৌশলগত সুবিধা
- ট্রেন্ড ব্রেকিং এবং গড় মূল্যের রিটার্নের সাথে একত্রিত হওয়া দুটি ট্রেডিং চিন্তাধারা বিভিন্ন বাজারের পরিবেশে স্থিতিশীলতা বজায় রাখতে সক্ষম
- স্থির ঝুঁকি-লাভের অনুপাত ব্যবহার করে পজিশন পরিচালনা করা, যা দীর্ঘমেয়াদী স্থিতিশীল লাভের পক্ষে সহায়ক
- এন্ট্রি, স্টপ লস এবং টার্গেট পয়েন্টগুলিকে দৃশ্যমান করে কৌশলটির কার্যকারিতা বাড়ানো
- ব্রিন-ব্যান্ড সূচক ব্যবহার করা হয়েছে বাজারের ওভারবয় ও ওভারসেলিং সনাক্ত করতে এবং লেনদেনের সঠিকতা বাড়াতে
- কৌশলগত ধারণাগুলি সহজ এবং স্পষ্ট, সহজে বোঝা এবং কার্যকর করা যায়
কৌশলগত ঝুঁকি
- উচ্চ ফ্রিকোয়েন্সির লেনদেনের জন্য উচ্চ লেনদেনের খরচ হতে পারে, যার ফলে কমিশনের প্রভাব বিবেচনা করা প্রয়োজন
- ঘন ঘন মিথ্যা ব্রেকিং সিগন্যাল হতে পারে
- স্থির ঝুঁকি-লাভের অনুপাত বড় প্রবণতা সম্পর্কে সঠিক ধারণা নাও থাকতে পারে
- ব্রিন-ব্যান্ড প্যারামিটার ফিক্সড সব বাজার পরিস্থিতিতে উপযুক্ত নাও হতে পারে
- সিগন্যালের সময়মত কার্যকরকরণ নিশ্চিত করতে রিয়েল-টাইম মার্কেট মনিটরিং প্রয়োজন
কৌশল অপ্টিমাইজেশনের দিকনির্দেশনা
- সিগন্যাল নিশ্চিতকরণের জন্য ট্রানজিট সূচক প্রবর্তন করা হয়েছে, যা ব্রেকআউটের নির্ভরযোগ্যতা বাড়িয়ে তুলবে
- বাজার ওঠানামার গতিশীলতার উপর ভিত্তি করে ব্রিনের বেন্ড প্যারামিটারগুলি সমন্বয় করা
- ট্রেন্ড ফিল্টার যুক্ত করুন এবং হরতালের বাজারে ঘন ঘন ট্রেডিং এড়িয়ে চলুন
- সময় ফিল্টার যুক্ত করার কথা ভাবুন এবং নিষ্ক্রিয় সময়ে লেনদেন এড়িয়ে চলুন
- স্বনির্ধারিত ঝুঁকি-লাভ-প্রতি-অবস্থান ব্যবস্থা তৈরি করা
সারসংক্ষেপ
এটি একটি সম্পূর্ণ ট্রেডিং সিস্টেম যা একাধিক প্রযুক্তিগত বিশ্লেষণের ধারণাগুলিকে একীভূত করে। বুলিন-ব্যান্ডের সূচকগুলিকে মূল্যের ব্রেকডাউনগুলির সাথে একত্রিত করার মাধ্যমে, কৌশলটি বাজারের ওভার-বিক্রয় ওভার-বিক্রয় অঞ্চলে বিপরীত সুযোগগুলি ধরতে সক্ষম হয়। যদিও কিছু অপ্টিমাইজেশনের জায়গা রয়েছে, তবে সিস্টেমের মৌলিক কাঠামোটি ভাল স্কেলযোগ্যতা এবং ব্যবহারিক মূল্য রয়েছে। যুক্তিসঙ্গত ঝুঁকি ব্যবস্থাপনা এবং প্যারামিটার অপ্টিমাইজেশনের মাধ্যমে, কৌশলটি প্রকৃত লেনদেনের ক্ষেত্রে স্থিতিশীল আয় পাওয়ার সম্ভাবনা রয়েছে।
- 1