ওভারভিউ
এই কৌশলটি একটি ট্রেডিং সিস্টেম যা ফিবোনাচি রিটার্নের স্তর এবং কে-লাইন ফর্ম্যাটের উপর ভিত্তি করে। এটি একাধিক সময়কালের উপর কাজ করে, প্রযুক্তিগত বিশ্লেষণ এবং ঝুঁকি ব্যবস্থাপনার নীতিগুলি একত্রিত করে। কৌশলটি মূলত সম্ভাব্য ট্রেডিংয়ের সুযোগগুলি খুঁজে বের করার জন্য গুরুত্বপূর্ণ ফিবোনাচি রিটার্নের স্তরগুলি (০.৬১৮ এবং ০.৭৮৬) সনাক্ত করে এবং স্টপ লস এবং লাভের লক্ষ্যমাত্রা ব্যবহার করে ঝুঁকি পরিচালনা করে।
কৌশল নীতি
কৌশলটির মূল যুক্তি নিম্নলিখিত মূল উপাদানগুলির উপর ভিত্তি করে:
- সময়কাল নির্বাচনঃ কৌশলটি 4 ঘন্টা, দিবালোক, ঘূর্ণিঝড় এবং চাঁদ লাইনের মতো একাধিক সময়কালের উপর কাজ করার অনুমতি দেয়, যা বিভিন্ন ট্রেডিং শৈলীর সাথে খাপ খায়।
- ফিবোনাচি স্তর গণনাঃ 50 চক্রের সর্বোচ্চ এবং সর্বনিম্ন মূল্য ব্যবহার করে 0.618 এবং 0.786 দুটি গুরুত্বপূর্ণ প্রত্যাহারের স্তর গণনা করা হয়।
- ইনপুট সিগন্যাল জেনারেশনঃ যখন ক্লোজিং প্রাইস নির্দিষ্ট অবস্থার অধীনে ফিবোনাচি স্তর অতিক্রম করে তখন সিস্টেমটি একটি ওভার বা ডাউন সিগন্যাল তৈরি করে। ওভার সিগন্যালের জন্য ক্লোজিং প্রাইসটি ওপেন প্রাইসের চেয়ে বেশি এবং 0.618 স্তরের উপরে থাকা দরকার; একটি ডাউন সিগন্যালের জন্য ক্লোজিং প্রাইসটি ওপেন প্রাইসের চেয়ে কম এবং 0.786 স্তরের নীচে থাকা দরকার।
- ঝুঁকি ব্যবস্থাপনাঃ কৌশলটি একটি নির্দিষ্ট শতাংশ স্টপ লস ব্যবহার করে এবং একটি পূর্বনির্ধারিত ঝুঁকি-লাভের অনুপাতের মাধ্যমে লাভের লক্ষ্য নির্ধারণ করে।
কৌশলগত সুবিধা
- বহু-চক্রীয় অভিযোজনযোগ্যতা: বিভিন্ন সময় চক্রের উপর কাজ করে, কৌশলগুলি বিভিন্ন বাজার পরিবেশ এবং ট্রেডিং শৈলীর সাথে খাপ খাইয়ে নিতে পারে।
- পদ্ধতিগত ঝুঁকি ব্যবস্থাপনাঃ প্রতি লেনদেনের জন্য সুস্পষ্ট ঝুঁকি নিয়ন্ত্রণ নিশ্চিত করুন, যার জন্য স্টপ লস এবং রিটার্নের লক্ষ্য নির্ধারণ করুন।
- টেকনিক্যাল ইন্টিগ্রেটেডঃ ফিবোনাচি রিট্র্যাকশন এবং কে-লাইন মডেল বিশ্লেষণের সমন্বয়ে আরও নির্ভরযোগ্য ট্রেডিং সিগন্যাল প্রদান করে।
- কাস্টমাইজযোগ্যতাঃ ফিবোনাচি স্তর, রিস্ক-পেয়ার রেট এবং স্টপ লস শতাংশের মতো মূল প্যারামিটারগুলি ব্যক্তিগত পছন্দ অনুসারে সামঞ্জস্য করা যায়।
কৌশলগত ঝুঁকি
- বাজারের অস্থিরতার ঝুঁকিঃ উচ্চ অস্থিরতার সময়, দাম দ্রুত স্টপ লস পয়েন্ট অতিক্রম করতে পারে যার ফলে ক্ষতি হয়।
- ভুয়া ব্রেকিংয়ের ঝুঁকিঃ বাজারে ভুয়া ফিবোনাচি লেভেল ব্রেকিংয়ের সংকেত আসতে পারে।
- প্যারামিটার অপ্টিমাইজেশনের ঝুঁকিঃ প্যারামিটার অপ্টিমাইজেশনের ফলে কৌশলটি রিয়েল-টাইমে খারাপ কাজ করতে পারে।
- তরলতা ঝুঁকিঃ নির্দিষ্ট সময়কাল বা বাজার অবস্থার অধীনে, তরলতার অভাবের সমস্যা হতে পারে।
কৌশল অপ্টিমাইজেশনের দিকনির্দেশনা
- বাজার প্রবণতা ফিল্টার যোগ করুনঃ আপনি চলমান গড় বা অন্যান্য প্রবণতা সূচক যোগ করতে পারেন বিপরীতমুখী সংকেত ফিল্টার করতে।
- ভর্তির সময় অপ্টিমাইজ করুনঃ ভর্তির সঠিকতা বাড়ানোর জন্য ভর্তি নিশ্চিতকরণ বা গতিশীলতার সূচক যুক্ত করার বিষয়টি বিবেচনা করুন।
- ডায়নামিক স্টপ ম্যানেজমেন্টঃ বাজারের বিভিন্ন অবস্থার সাথে সামঞ্জস্য রেখে ওঠানামা-ভিত্তিক ডায়নামিক স্টপ ম্যানেজমেন্ট।
- সময় ফিল্টার যুক্ত করুনঃ ট্রেডিংয়ের সময় উইন্ডোতে সীমাবদ্ধতা যুক্ত করুন, যাতে খারাপ বাজারের সময় ট্রেডিং করা যায় না।
- মাল্টি-ডাইমেনশনাল সিগন্যাল কনফার্মেশনঃ অতিরিক্ত সিগন্যাল কনফার্মেশন প্রদানের জন্য অন্যান্য প্রযুক্তিগত সূচকগুলিকে একত্রিত করা।
সারসংক্ষেপ
এটি একটি সুসংগঠিত প্রবণতা অনুসরণ কৌশল যা ব্যবসায়ীদের একটি পদ্ধতিগত ট্রেডিং পদ্ধতি সরবরাহ করে, ফিবোনাচি রিট্র্যাক্ট, কে-লাইন ফর্ম্যাট এবং ঝুঁকি পরিচালনার নীতিগুলিকে একত্রিত করে। যদিও কিছু ঝুঁকি রয়েছে, তবে প্রস্তাবিত অপ্টিমাইজেশান দিকনির্দেশগুলি কৌশলটির স্থায়িত্ব এবং নির্ভরযোগ্যতা আরও বাড়িয়ে তুলতে পারে। কৌশলটির বহু-চক্রের বৈশিষ্ট্য এবং কাস্টমাইজযোগ্য প্যারামিটারগুলি এটি বিভিন্ন ধরণের ব্যবসায়ীদের ব্যবহারের জন্য উপযুক্ত করে তোলে।
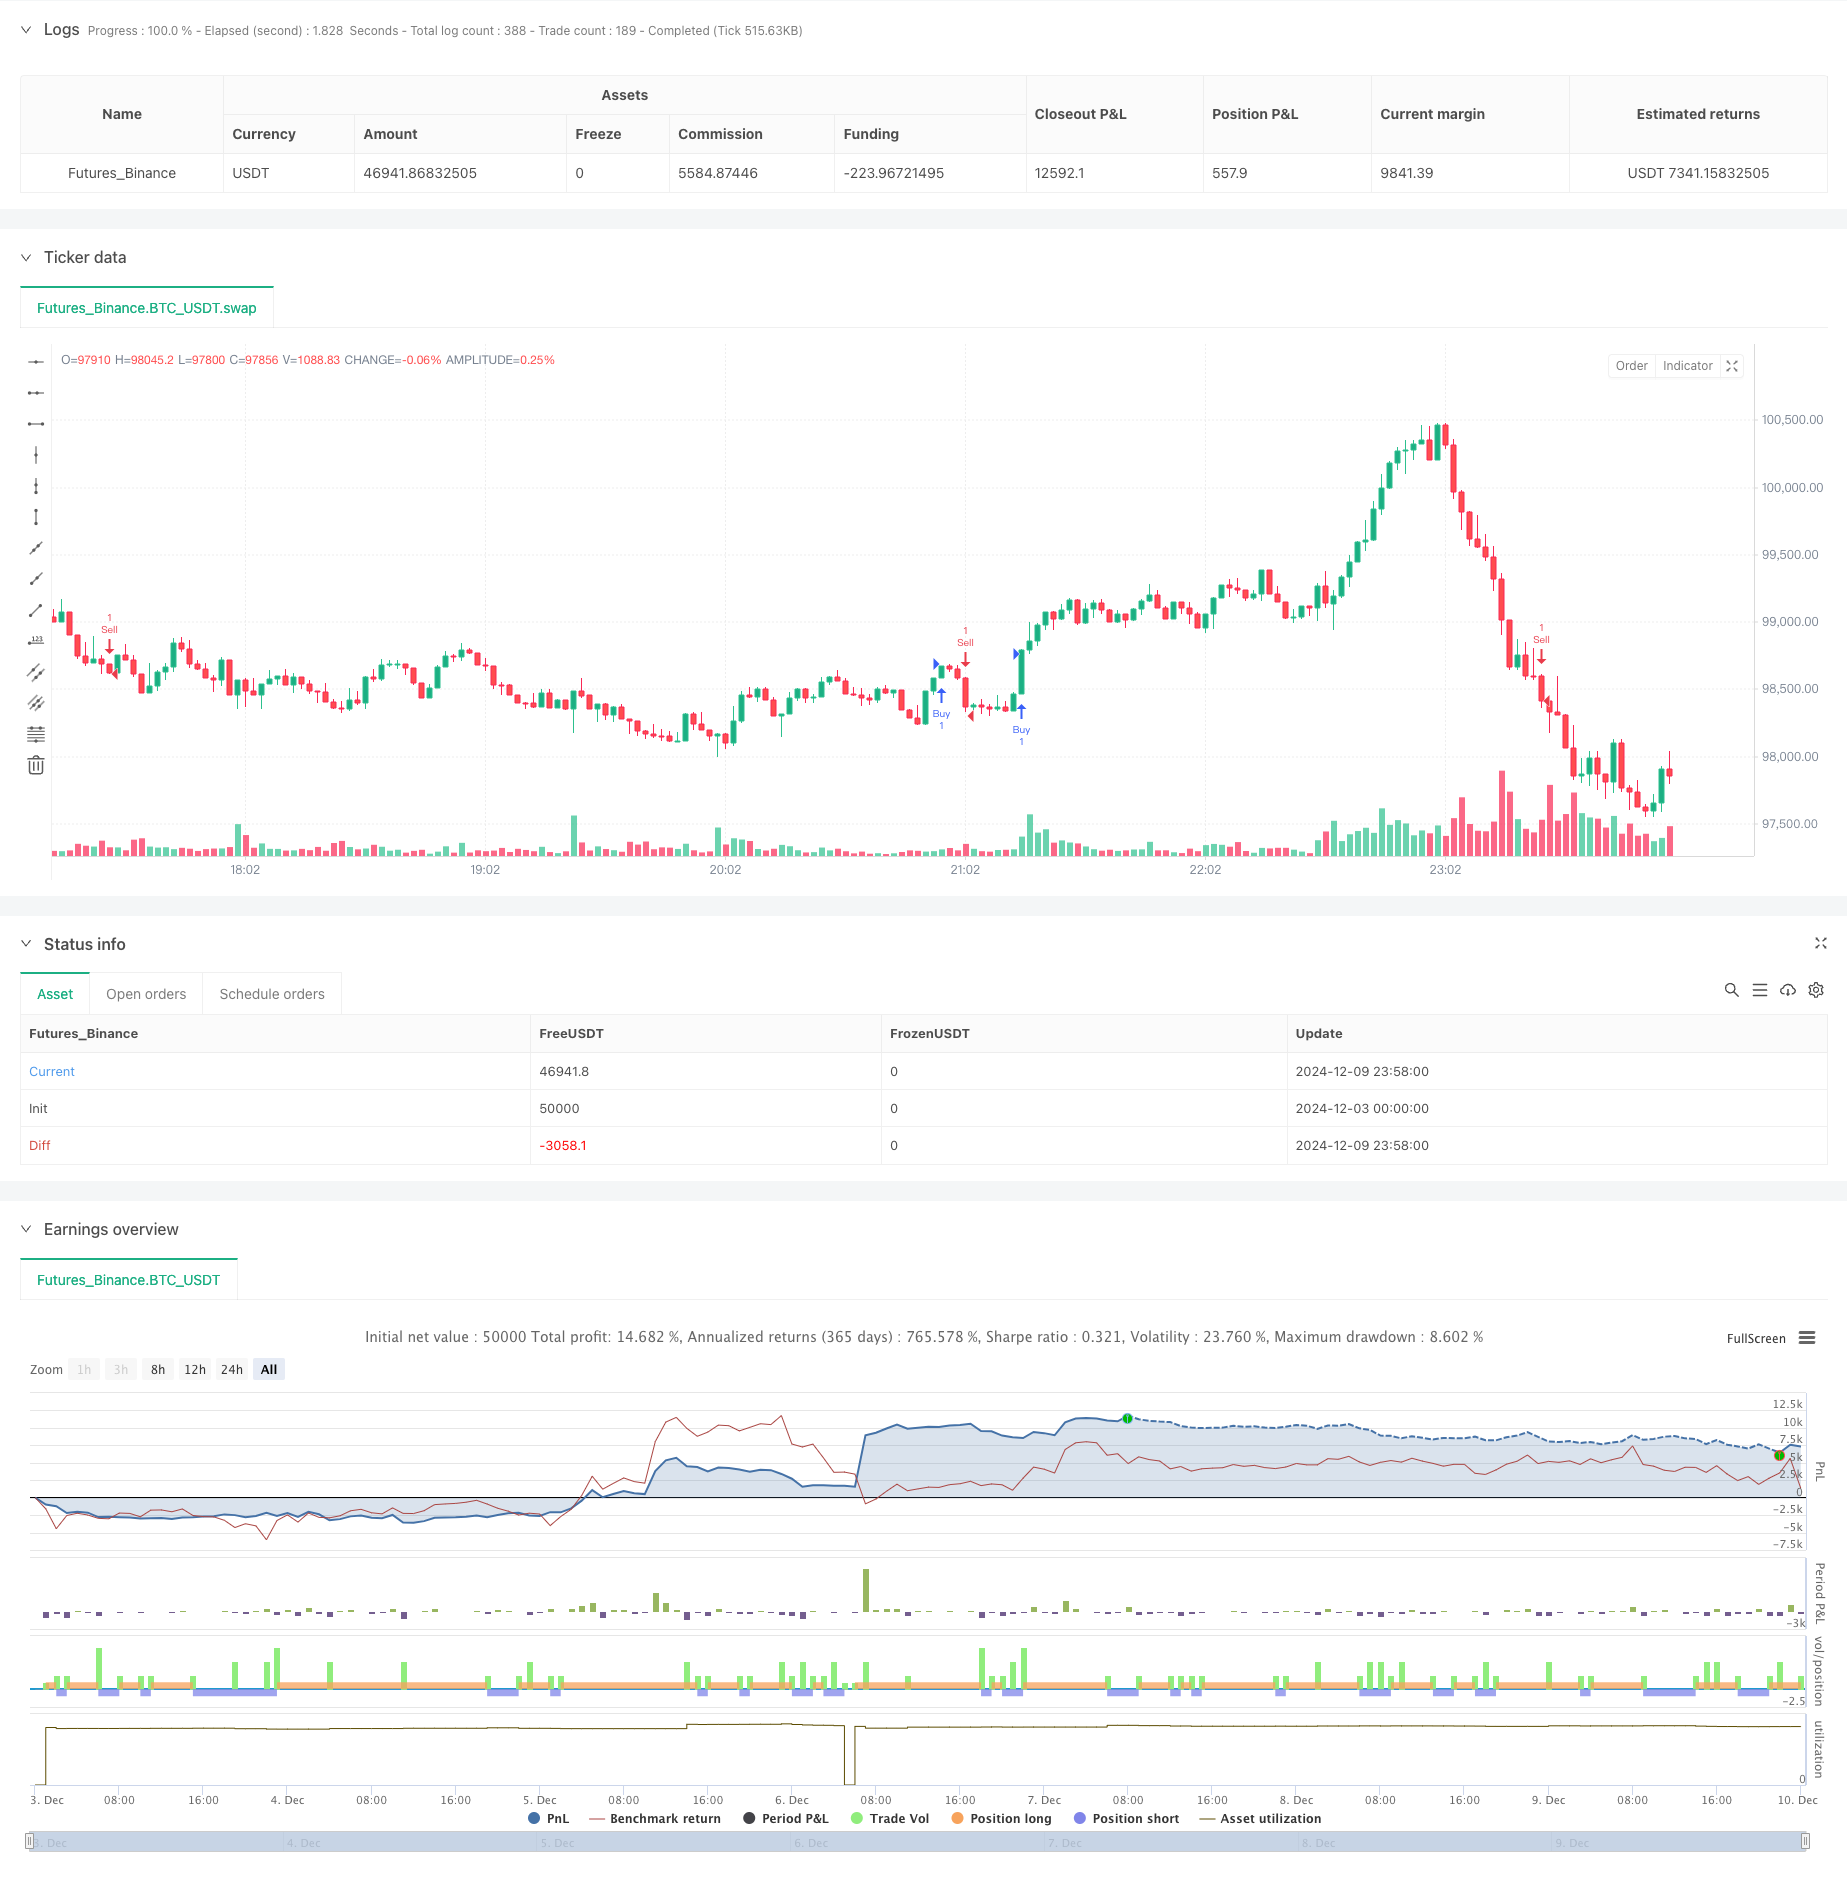
/*backtest
start: 2024-12-03 00:00:00
end: 2024-12-10 00:00:00
period: 2m
basePeriod: 2m
exchanges: [{"eid":"Futures_Binance","currency":"BTC_USDT"}]
*/

// This Pine Script™ code is subject to the terms of the Mozilla Public License 2.0 at https://mozilla.org/MPL/2.0/
// © jontucklogic7467

//@version=5
strategy("Fibonacci Swing Trading Bot", overlay=true)

// Input parameters
fiboLevel1 = input.float(0.618, title="Fibonacci Retracement Level 1")
fiboLevel2 = input.float(0.786, title="Fibonacci Retracement Level 2")
riskRewardRatio = input.float(2.0, title="Risk/Reward Ratio")
stopLossPerc = input.float(1.0, title="Stop Loss Percentage") / 100

// Timeframe selection
useTimeframe = input.timeframe("240", title="Timeframe for Analysis", options=["240", "D", "W", "M"])

// Request data from selected timeframe
highTF = request.security(syminfo.tickerid, useTimeframe, high)
lowTF = request.security(syminfo.tickerid, useTimeframe, low)

// Swing high and low calculation over the last 50 bars in the selected timeframe
highestHigh = ta.highest(highTF, 50)
lowestLow = ta.lowest(lowTF, 50)

// Fibonacci retracement levels
fib618 = highestHigh - (highestHigh - lowestLow) * fiboLevel1
fib786 = highestHigh - (highestHigh - lowestLow) * fiboLevel2

// Plot Fibonacci levels
// line.new(bar_index[1], fib618, bar_index, fib618, color=color.red, width=2, style=line.style_dashed)
// line.new(bar_index[1], fib786, bar_index, fib786, color=color.orange, width=2, style=line.style_dashed)

// Entry signals based on candlestick patterns and Fibonacci levels
bullishCandle = close > open and close > fib618 and close < highestHigh
bearishCandle = close < open and close < fib786 and close > lowestLow

// Stop loss and take profit calculation
stopLoss = bullishCandle ? close * (1 - stopLossPerc) : close * (1 + stopLossPerc)
takeProfit = bullishCandle ? close + (close - stopLoss) * riskRewardRatio : close - (stopLoss - close) * riskRewardRatio

// Plot buy and sell signals
if bullishCandle
    strategy.entry("Buy", strategy.long)
    strategy.exit("Take Profit", "Buy", limit=takeProfit, stop=stopLoss)

if bearishCandle
    strategy.entry("Sell", strategy.short)
    strategy.exit("Take Profit", "Sell", limit=takeProfit, stop=stopLoss)