ওভারভিউ
এই কৌশলটি সূচকীয় চলমান গড় (ইএমএ) এবং গতিশীলতার সূচকগুলির উপর ভিত্তি করে একটি প্রবণতা-অনুসরণ কৌশল। এটি একটি গতিশীল বিরতি সংকেত এবং ইএমএ প্রবণতা ফিল্টারের সাথে মিলিত হয়, যখন বাজারের প্রবণতা স্পষ্ট হয় তখন ট্রেডিং করা হয়। কৌশলটিতে একটি সম্পূর্ণ ঝুঁকি ব্যবস্থাপনা মডিউল, নমনীয় ট্রেডিং সময় ফিল্টার এবং কৌশলটির স্থায়িত্ব এবং নির্ভরযোগ্যতা বাড়ানোর জন্য বিশদ পরিসংখ্যান বিশ্লেষণের বৈশিষ্ট্য রয়েছে।
কৌশল নীতি
কৌশলটির মূল যুক্তি নিম্নলিখিত মূল উপাদানগুলির উপর ভিত্তি করে:
- ভর সংকেত সনাক্তকরণঃ ব্যবহারকারীর কাস্টমাইজড সময়কালের মধ্যে ভর মান গণনা করে, যখন ভরটি উপরের সারি থ্রেশহোল্ডটি অতিক্রম করে তখন একটি মাল্টিসিগন্যাল উত্পন্ন হয় এবং নীচের সারি থ্রেশহোল্ডটি অতিক্রম করলে একটি ফাঁকা সংকেত উত্পন্ন হয়।
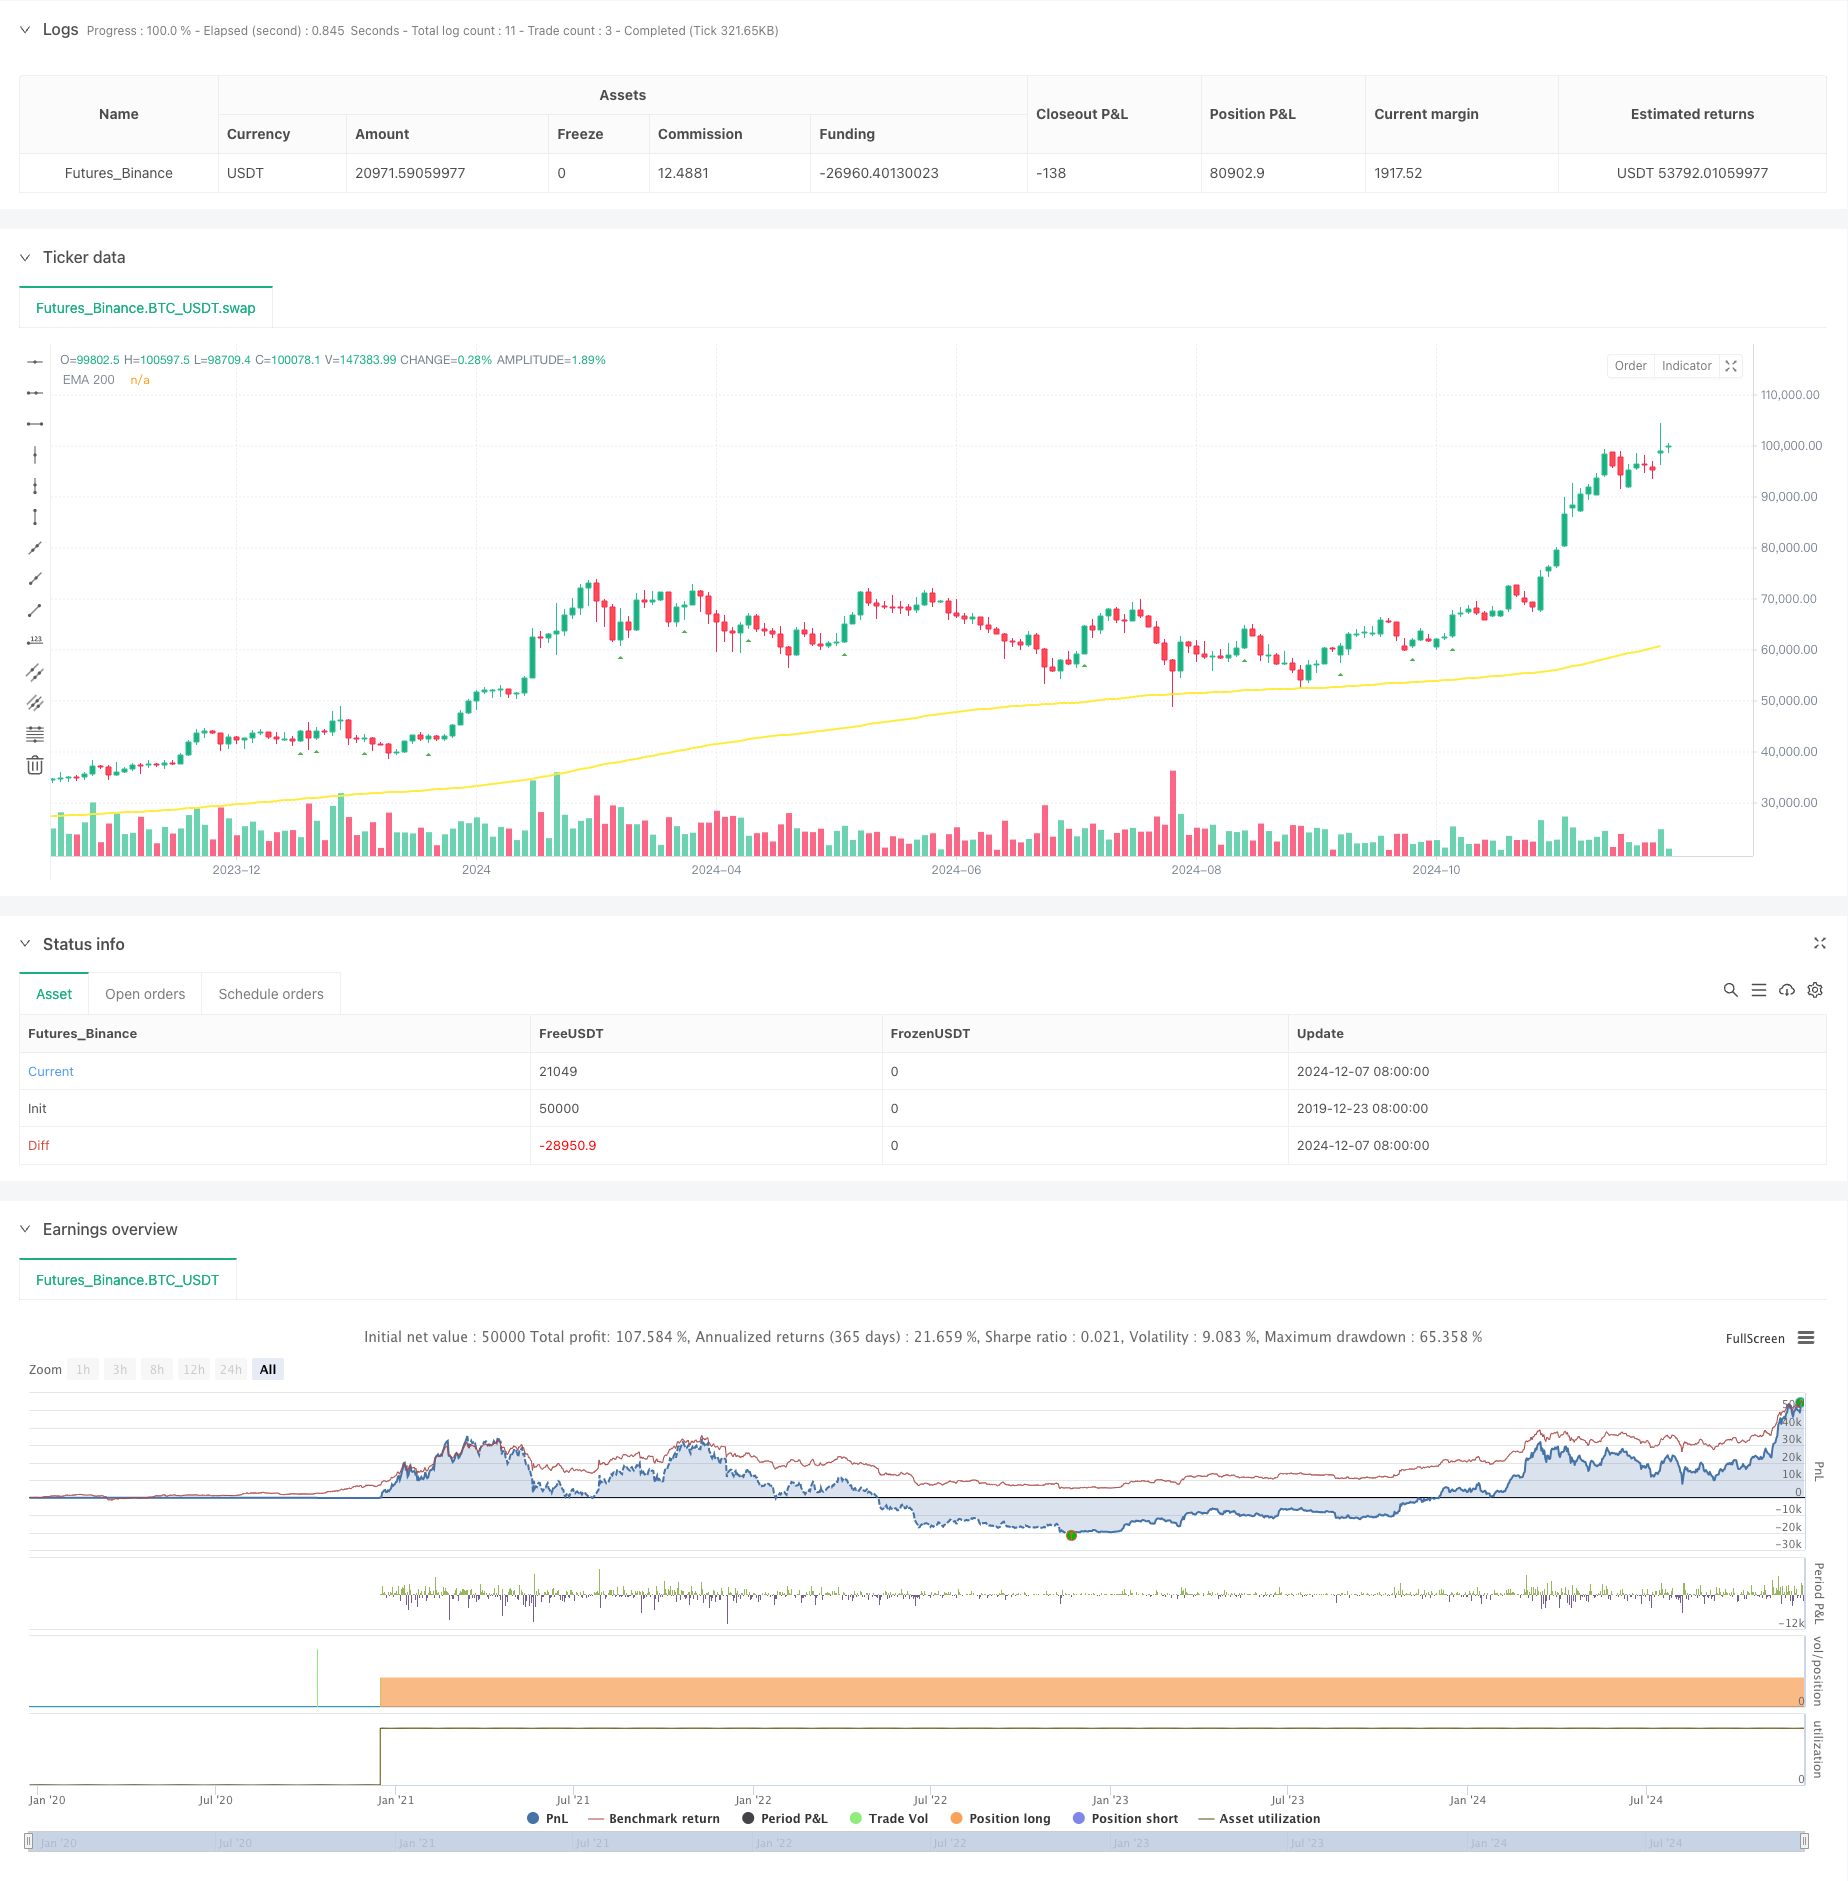
- ইএমএ ট্রেন্ড ফিল্টারঃ 200-চক্রের ইএমএ ব্যবহার করে ট্রেন্ডিংয়ের ভিত্তি হিসাবে, দামগুলি ইএমএর উপরে বেশি করার অনুমতি দেয় এবং দামগুলি ইএমএর নীচে খালি করার অনুমতি দেয়।
- সময় ফিল্টারঃ নির্দিষ্ট ট্রেডিং সময় সেট করা যায় এবং GMT টাইমজোন সামঞ্জস্যের জন্য সমর্থন করা হয়, যাতে কৌশলটি বিভিন্ন বাজারের ট্রেডিং সময়ের সাথে আরও ভালভাবে খাপ খায়।
- ঝুঁকি নিয়ন্ত্রণঃ এটিআর বা স্থির শতাংশের উপর ভিত্তি করে স্টপ এবং স্টপ সেটিং সমর্থন করে এবং প্রতিদিনের সর্বোচ্চ লেনদেনের সংখ্যা সীমাবদ্ধ করে।
কৌশলগত সুবিধা
- প্রবণতা ট্র্যাকিং ক্ষমতা শক্তিশালীঃ ইএমএ এবং গতিশীলতার দ্বৈত নিশ্চিতকরণের মাধ্যমে, প্রধান প্রবণতা কার্যকরভাবে ধরা যায়।
- ঝুঁকি ব্যবস্থাপনা উন্নতঃ এটিআর ডায়নামিক স্টপ এবং ফিক্সড শতাংশ স্টপ ব্যবহার করে বিভিন্ন ধরণের স্টপ অফার করে।
- পরিসংখ্যান বিশ্লেষণ ব্যাপকঃ বাস্তব সময়ে একাধিক পারফরম্যান্স সূচক ট্র্যাকিং, যার মধ্যে রয়েছে বহুমুখী বিজয় হার, ঝুঁকি-লাভের অনুপাত ইত্যাদি।
- প্যারামিটারগুলির নমনীয়তাঃ প্রধান প্যারামিটারগুলিকে বিভিন্ন বাজারের বৈশিষ্ট্য অনুসারে অনুকূলিতকরণ করা যেতে পারে।
কৌশলগত ঝুঁকি
বাজারের ঝড়ের ঝুঁকিঃ ঘন ঘন মিথ্যা ব্রেকিং সিগন্যাল হতে পারে। প্রস্তাবিত সমাধানঃ কম্পন পরিমাপ ফিল্টার বা বিপর্যয় থ্রেশহোল্ড বাড়ানো।
স্লাইড পয়েন্টের ঝুঁকিঃ প্রবল অস্থিরতার সময় বড় স্লাইড পয়েন্ট হতে পারে। প্রস্তাবিত সমাধানঃ যুক্তিসঙ্গত স্টপ ল্যাম্প সেট করুন এবং উচ্চ অস্থিরতার সময় ট্রেডিং এড়িয়ে চলুন।
অতিরিক্ত লেনদেনের ঝুঁকিঃ খুব ঘন ঘন সংকেত অতিরিক্ত লেনদেনের কারণ হতে পারে। প্রস্তাবিত সমাধানঃ প্রতিদিন সর্বোচ্চ লেনদেনের সীমা নির্ধারণ করুন।
কৌশল অপ্টিমাইজেশনের দিকনির্দেশনা
- ডায়নামিক প্যারামিটার অপ্টিমাইজেশানঃ বাজারের ওঠানামা অনুযায়ী স্বয়ংক্রিয়ভাবে ডায়নামিক থ্রেশহোল্ড এবং ইএমএ চক্রের সমন্বয় করা যায়।
- মাল্টি টাইম সাইকেল অ্যানালিসিসঃ একাধিক টাইম সাইকেল যুক্ত করে ট্রেন্ড নিশ্চিতকরণ, সিগন্যাল নির্ভরযোগ্যতা বৃদ্ধি করে।
- বাজার পরিবেশে সনাক্তকরণঃ বিভিন্ন বাজার পরিবেশে বিভিন্ন প্যারামিটার সেট আপ করার জন্য ওঠানামা বিশ্লেষণ মডিউল যোগ করা হয়েছে।
- সিগন্যাল স্ট্রেনথ গ্রেডিংঃ সিগন্যাল স্ট্রেনথ গ্রেডিং, সিগন্যাল স্ট্রেনথের গতিশীলতার উপর ভিত্তি করে হোল্ডিং স্কেল সামঞ্জস্য করা।
সারসংক্ষেপ
এটি একটি সুনির্দিষ্টভাবে পরিকল্পিত ট্রেন্ড ট্র্যাকিং কৌশল যা গতিশীলতা বিঘ্ন এবং ইএমএ প্রবণতার সমন্বয়ে বাজারের সুযোগকে ক্যাপচার করে। কৌশলটির ঝুঁকি ব্যবস্থাপনা সিস্টেমটি সম্পূর্ণ, পরিসংখ্যানগত বিশ্লেষণের ক্ষমতা শক্তিশালী, ভাল ব্যবহারযোগ্যতা এবং স্কেলযোগ্যতা রয়েছে। ক্রমাগত অপ্টিমাইজেশন এবং পরিমার্জনের মাধ্যমে, কৌশলটি বিভিন্ন বাজারের পরিবেশে স্থিতিশীল পারফরম্যান্স বজায় রাখার প্রত্যাশা করে।
/*backtest
start: 2019-12-23 08:00:00
end: 2024-12-09 08:00:00
period: 2d
basePeriod: 2d
exchanges: [{"eid":"Futures_Binance","currency":"BTC_USDT"}]
*/

//@version=6
strategy("[Mustang Algo] EMA Momentum Strategy",
         shorttitle="[Mustang Algo] Mom Strategy",
         overlay=true,
         initial_capital=10000,
         default_qty_type=strategy.fixed,
         default_qty_value=1,
         pyramiding=0,
         calc_on_every_tick=false,
         max_bars_back=5000)

// Momentum Parameters
len = input.int(10, minval=1, title="Length")
src = input(close, title="Source")
momTimeframe = input.timeframe("", title="Momentum Timeframe")
timeframe_gaps = input.bool(true, title="Autoriser les gaps de timeframe")
momFilterLong = input.float(5, title="Filtre Momentum Long", minval=0)
momFilterShort = input.float(-5, title="Filtre Momentum Short", maxval=0)

// EMA Filter
useEmaFilter = input.bool(true, title="Utiliser Filtre EMA")
emaLength = input.int(200, title="EMA Length", minval=1)

// Position Size
contractSize = input.float(1.0, title="Taille de position", minval=0.01, step=0.01)

// Time filter settings
use_time_filter = input.bool(false, title="Utiliser le Filtre de Temps")
start_hour = input.int(9, title="Heure de Début", minval=0, maxval=23)
start_minute = input.int(30, title="Minute de Début", minval=0, maxval=59)
end_hour = input.int(16, title="Heure de Fin", minval=0, maxval=23)
end_minute = input.int(30, title="Minute de Fin", minval=0, maxval=59)
gmt_offset = input.int(0, title="Décalage GMT", minval=-12, maxval=14)

// Risk Management
useAtrSl = input.bool(false, title="Utiliser ATR pour SL/TP")
atrPeriod = input.int(14, title="Période ATR", minval=1)
atrMultiplier = input.float(1.5, title="Multiplicateur ATR pour SL", minval=0.1, step=0.1)
stopLossPerc = input.float(1.0, title="Stop Loss (%)", minval=0.01, step=0.01)
tpRatio = input.float(2.0, title="Take Profit Ratio", minval=0.1, step=0.1)

// Daily trade limit
maxDailyTrades = input.int(2, title="Limite de trades par jour", minval=1)

// Variables for tracking daily trades
var int dailyTradeCount = 0

// Reset daily trade count
if dayofweek != dayofweek[1]
    dailyTradeCount := 0

// Time filter function
is_within_session() =>
    current_time = time(timeframe.period, "0000-0000:1234567", gmt_offset)
    start_time = timestamp(year, month, dayofmonth, start_hour, start_minute, 0)
    end_time = timestamp(year, month, dayofmonth, end_hour, end_minute, 0)
    in_session = current_time >= start_time and current_time <= end_time
    not use_time_filter or in_session

// EMA Calculation
ema200 = ta.ema(close, emaLength)

// Momentum Calculation
gapFillMode = timeframe_gaps ? barmerge.gaps_on : barmerge.gaps_off
mom = request.security(syminfo.tickerid, momTimeframe, src - src[len], gapFillMode)

// ATR Calculation
atr = ta.atr(atrPeriod)

// Signal Detection with Filters
crossoverUp = ta.crossover(mom, momFilterLong)
crossoverDown = ta.crossunder(mom, momFilterShort)

emaUpTrend = close > ema200
emaDownTrend = close < ema200

// Trading Conditions
longCondition = crossoverUp and (not useEmaFilter or emaUpTrend) and is_within_session() and dailyTradeCount < maxDailyTrades and barstate.isconfirmed
shortCondition = crossoverDown and (not useEmaFilter or emaDownTrend) and is_within_session() and dailyTradeCount < maxDailyTrades and barstate.isconfirmed

// Calcul des niveaux de Stop Loss et Take Profit
float stopLoss = useAtrSl ? (atr * atrMultiplier) : (close * stopLossPerc / 100)
float takeProfit = stopLoss * tpRatio

// Modification des variables pour éviter les erreurs de repainting
var float entryPrice = na
var float currentStopLoss = na
var float currentTakeProfit = na

// Exécution des ordres avec gestion des positions
if strategy.position_size == 0
    if longCondition
        entryPrice := close
        currentStopLoss := entryPrice - stopLoss
        currentTakeProfit := entryPrice + takeProfit
        strategy.entry("Long", strategy.long, qty=contractSize)
        strategy.exit("Exit Long", "Long", stop=currentStopLoss, limit=currentTakeProfit)
        dailyTradeCount += 1

    if shortCondition
        entryPrice := close
        currentStopLoss := entryPrice + stopLoss
        currentTakeProfit := entryPrice - takeProfit
        strategy.entry("Short", strategy.short, qty=contractSize)
        strategy.exit("Exit Short", "Short", stop=currentStopLoss, limit=currentTakeProfit)
        dailyTradeCount += 1

// Plot EMA
plot(ema200, color=color.yellow, linewidth=2, title="EMA 200")

// Plot Signals
plotshape(longCondition, title="Long Signal", location=location.belowbar, color=color.green, style=shape.triangleup, size=size.small)
plotshape(shortCondition, title="Short Signal", location=location.abovebar, color=color.red, style=shape.triangledown, size=size.small)

// // Performance Statistics
// var int longWins = 0
// var int longLosses = 0
// var int shortWins = 0
// var int shortLosses = 0

// if strategy.closedtrades > 0
//     trade = strategy.closedtrades - 1
//     isLong = strategy.closedtrades.entry_price(trade) < strategy.closedtrades.exit_price(trade)
//     isWin = strategy.closedtrades.profit(trade) > 0

//     if isLong and isWin
//         longWins += 1
//     else if isLong and not isWin
//         longLosses += 1
//     else if not isLong and isWin
//         shortWins += 1
//     else if not isLong and not isWin
//         shortLosses += 1

// longTrades = longWins + longLosses
// shortTrades = shortWins + shortLosses

// longWinRate = longTrades > 0 ? (longWins / longTrades) * 100 : 0
// shortWinRate = shortTrades > 0 ? (shortWins / shortTrades) * 100 : 0
// overallWinRate = strategy.closedtrades > 0 ? (strategy.wintrades / strategy.closedtrades) * 100 : 0

// avgRR = strategy.grossloss != 0 ? math.abs(strategy.grossprofit / strategy.grossloss) : 0

// // Display Statistics
// var table statsTable = table.new(position.top_right, 4, 7, border_width=1)
// if barstate.islastconfirmedhistory
//     table.cell(statsTable, 0, 0, "Type", bgcolor=color.new(color.blue, 90))
//     table.cell(statsTable, 1, 0, "Win", bgcolor=color.new(color.blue, 90))
//     table.cell(statsTable, 2, 0, "Lose", bgcolor=color.new(color.blue, 90))
//     table.cell(statsTable, 3, 0, "Daily Trades", bgcolor=color.new(color.blue, 90))
//     table.cell(statsTable, 0, 1, "Long", bgcolor=color.new(color.blue, 90))
//     table.cell(statsTable, 1, 1, str.tostring(longWins), bgcolor=color.new(color.blue, 90))
//     table.cell(statsTable, 2, 1, str.tostring(longLosses), bgcolor=color.new(color.blue, 90))
//     table.cell(statsTable, 3, 1, str.tostring(dailyTradeCount) + "/" + str.tostring(maxDailyTrades), bgcolor=color.new(color.blue, 90))
//     table.cell(statsTable, 0, 2, "Short", bgcolor=color.new(color.blue, 90))
//     table.cell(statsTable, 1, 2, str.tostring(shortWins), bgcolor=color.new(color.blue, 90))
//     table.cell(statsTable, 2, 2, str.tostring(shortLosses), bgcolor=color.new(color.blue, 90))
//     table.cell(statsTable, 0, 3, "Win Rate", bgcolor=color.new(color.blue, 90))
//     table.cell(statsTable, 1, 3, "Long: " + str.tostring(longWinRate, "#.##") + "%", bgcolor=color.new(color.blue, 90))
//     table.cell(statsTable, 2, 3, "Short: " + str.tostring(shortWinRate, "#.##") + "%", bgcolor=color.new(color.blue, 90))
//     table.cell(statsTable, 0, 4, "Overall", bgcolor=color.new(color.blue, 90))
//     table.cell(statsTable, 1, 4, "Win Rate: " + str.tostring(overallWinRate, "#.##") + "%", bgcolor=color.new(color.blue, 90))
//     table.cell(statsTable, 2, 4, "Total: " + str.tostring(strategy.closedtrades) + " | RR: " + str.tostring(avgRR, "#.##"), bgcolor=color.new(color.blue, 90))
//     table.cell(statsTable, 0, 5, "Trading Hours", bgcolor=color.new(color.blue, 90))
//     table.cell(statsTable, 1, 5, "Start: " + str.format("{0,time,HH:mm}", start_hour * 60 * 60 * 1000 + start_minute * 60 * 1000), bgcolor=color.new(color.blue, 90))
//     table.cell(statsTable, 2, 5, "End: " + str.format("{0,time,HH:mm}", end_hour * 60 * 60 * 1000 + end_minute * 60 * 1000), bgcolor=color.new(color.blue, 90))
//     table.cell(statsTable, 3, 5, "GMT: " + (gmt_offset >= 0 ? "+" : "") + str.tostring(gmt_offset), bgcolor=color.new(color.blue, 90))
//     table.cell(statsTable, 0, 6, "SL/TP Method", bgcolor=color.new(color.blue, 90))
//     table.cell(statsTable, 1, 6, useAtrSl ? "ATR-based" : "Percentage-based", bgcolor=color.new(color.blue, 90))
//     table.cell(statsTable, 2, 6, useAtrSl ? "ATR: " + str.tostring(atrPeriod) : "SL%: " + str.tostring(stopLossPerc), bgcolor=color.new(color.blue, 90))
//     table.cell(statsTable, 3, 6, "TP Ratio: " + str.tostring(tpRatio), bgcolor=color.new(color.blue, 90))